High Rates of Antimicrobial Resistance and Emergence of High‐Risk Clones in Community‐Acquired Uropathogenic Escherichia coli
Vívian Santos Galvão, Adriano Souza Santos Monteiro, João Lucas Pinheiro Leite, Isabela Oliveira Sousa, Soraia Machado Cordeiro, Joice Neves Reis

TL;DR
This study finds high antimicrobial resistance in community-acquired UTIs caused by E. coli, with specific clones and resistance patterns identified.
Contribution
The study identifies high-risk E. coli clones and resistance patterns in community-acquired UTIs, offering insights for treatment and surveillance.
Findings
High resistance to trimethoprim-sulfamethoxazole and fluoroquinolones was observed in community-acquired UTI E. coli isolates.
Phylogenetic group B2 was most prevalent and associated with increased virulence genes.
ST1193 emerged as the dominant multidrug-resistant clone among the isolates.
Abstract
Urinary tract infection (UTI) is the most common bacterial infection globally and is often treated empirically in community settings, contributing to antimicrobial resistance. Uropathogenic E. coli (UPEC) is the leading cause of community‐acquired UTIs (CA‐UTIs), yet data on its clinical and molecular characteristics remain limited. To investigate the clinical and microbiological features of CA‐UTIs, focusing on antimicrobial resistance, phylogenetic groups, virulence genes, and clonal profiles. Randomly selected E. coli isolates from CA‐UTI cases underwent antimicrobial susceptibility testing. PCR was used to detect β‐lactamase genes, phylogenetic groups, and key virulence factors. MLST was used for clonal typing. Clinical and demographic data were obtained through structured interviews. Among 98 CA‐UPEC isolates, most were from female patients (95.9%), median age 48 years. High…
Genes, proteins, chemicals, diseases, species, mutations and cell lines named across the full text — each resolved to its canonical identifier and authoritative record.
Click any figure to enlarge with its caption.
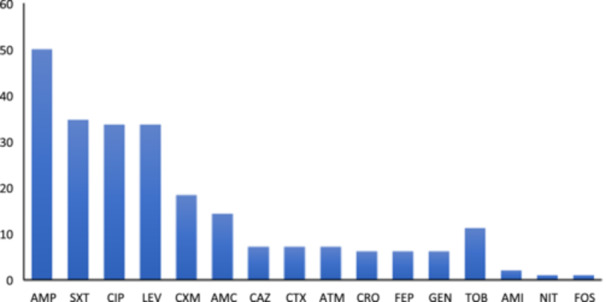 Figure 1
| Characteristics | CA‐UTI 98 (%) | B2 | Non‐B2 |
| Univariate | |
|---|---|---|---|---|---|---|
| 47 (%) | 51 (%) | OR | 95% CI | |||
|
| ||||||
| Female | 94 (95.9) | 44 (93.6) | 50 (98.0) | 0.35 | — | — |
| Male | 4 (4.1) | 3 (6.4) | 1 (2.0) | 3.41 | 0.42–70.3 | |
| Pregnant | 15 (16.0) | 9 (19.1) | 6 (11.8) | 0.40 | 1.78 | 0.59–5.73 |
| Age (years), median (1 qt–3qt) | 48 (32‐65) | 48 (31‐66) | 46 (30‐63) | 0.97 | ||
| < 30 | 21 (21.4) | 10 (21.2) | 11 (21.6) | — | — | |
| 30–60 | 42 (42.9) | 19 (40.4) | 23 (45.1) | 0.96 | 0.34–2.75 | |
| > 60 | 31 (31.6) | 15 (31.9) | 16 (31.4) | 1.10 | 0.36–3.35 | |
|
| ||||||
| Diabetes mellitus | 22 (22.4) | 12 (25.5) | 10 (19.6) | 0.63 | 1.41 | 0.54–3.71 |
| Rheumatoid arthritis | 6 (6.1) | 1 (2.1) | 5 (9.8) | 0.21 | 0.20 | 0.01–1.30 |
| Systemic arterial hypertension | 31 (31.6) | 15 (31.9) | 16 (31.4) | > 0.99 | 1.03 | 0.43–2.41 |
|
| ||||||
| BM + DYS | 29 (29.6) | 12 (25.5) | 17 (33.3) | 0.51 | 0.69 | 0.28–1.64 |
| UI + DYS | 24 (24.5) | 11 (23.4) | 13 (25.5) | > 0.99 | 0.89 | 0.35–2.25 |
| BM + UI | 23 (23.5) | 9 (19.1) | 14 (27.4) | 0.35 | 0.63 | 0.23–1.60 |
| BM + DYS + UI | 18 (18.4) | 7 (14.9) | 11 (21.6) | 0.44 | 0.64 | 0.21–1.78 |
| BM + DYS + UI + FEV | 4 (4.1) | 2 (4.2) | 2 (3.9) | > 0.99 | 1.09 | 0.13–9.38 |
|
| > 0.99 | |||||
| Non‐MDR | 74 (75.5) | 35 (74.5) | 39 (76.5) | — | — | |
| MDR | 24 (24.5) | 12 (25.5) | 12 (23.5) | 1.11 | 0.44–2.82 | |
| Phylogroup | MDR | Non‐MDR | Total |
| Univariate OR 95% CI | |
|---|---|---|---|---|---|---|
| A | 7 (29.2) | 6 (8.1) | 13 (13.3) |
| 4.67 | 1.38–16.3 |
| B1 | 2 (8.3) | 16 (21.6) | 18 (18.4) | 0.16 | 0.33 | 0.05–1.29 |
| B2 | 12 (50.0) | 35 (47.3) | 47 (48.0) | 0.82 | 1.11 | 0.44–2.82 |
| D | 2 (8.3) | 8 (10.8) | 10 (10.2) | 0.73 | 0.75 | 0.11–3.28 |
| Others | 1 (4.2) | 9 (12.2) | 10 (10.2) | 0.28 | 0.31 | 0.02–1.81 |
| Virulence genes and PAIs | Distribution of phylogenetic groups | ||||||||
|---|---|---|---|---|---|---|---|---|---|
| A ( | B1 ( | B2 ( | D ( | C ( | E ( | F ( | NT ( | Total ( | |
|
| 5 | 5 | |||||||
|
| 8 | 8 | |||||||
|
| 12 | 12 | |||||||
|
| 12 | 1 | 13 | ||||||
|
| 2 | 1 | 1 | 4 | |||||
|
| 3 | 13 | 2 | 1 | 19 | ||||
|
| 1 | 12 | 2 | 4 | 2 | 21 | |||
|
| 7 | 3 | 11 | 3 | 1 | 1 | 2 | 28 | |
|
| 1 | 1 | 21 | 1 | 1 | 1 | 4 | 30 | |
|
| 5 | 2 | 23 | 7 | 1 | 3 | 2 | 44 | |
|
| 6 | 3 | 23 | 6 | 1 | 4 | 2 | 45 | |
|
| 1 | 43 | 8 | 4 | 56 | ||||
|
| 6 | 7 | 46 | 9 | 1 | 4 | 2 | 75 | |
|
| 12 | 17 | 47 | 8 | 2 | 2 | 4 | 2 | 94 |
| PAI ICFT073 | 1 | 18 | 2 | 21 | |||||
| PAI IICFT073 | 27 | 2 | 29 | ||||||
| PAI IV536 | 7 | 7 | 46 | 9 | 1 | 4 | 2 | 76 | |
| Antibiotics | Trait | Prevalence of trait among isolates ( |
| Univariate | ||
|---|---|---|---|---|---|---|
| Susceptible | Resistant | OR | 95% CI | |||
| Ampicillin |
| 15/49 (30.6) | 29/49 (59.2) | < 0.01 | 2.97 | 1.30–6.79 |
|
| 17/49 (34.7) | 28/49 (57.1) | 0.04 | 2.28 | 1.01–5.14 | |
| Ciprofloxacin/Levofloxacin |
| 12/65 (18.5) | 0/33 (0.0) | < 0.01 | 0.06 | 0.00–1.25 |
|
| 12/65 (18.5) | 1/33 (3.0) | 0.05 | 0.20 | 0.03–1.21 | |
|
| 19/65 (29.2) | 2/33 (6.1) | < 0.01 | 0.19 | 0.05–0.78 | |
|
| 12/65 (18.5) | 18/33 (54.5) | < 0.01 | 5.11 | 2.02–12.9 | |
|
| 21/65 (32.3) | 23/33 (69.7) | < 0.01 | 4.63 | 1.88–11.4 | |
|
| 22/65 (33.8) | 23/33 (69.7) | < 0.01 | 4.33 | 1.76–10.6 | |
| Trimethoprim + Sulfamethoxazole |
| 23/64 (35.9) | 21/34 (61.8) | 0.02 | 2.81 | 1.19–6.62 |
|
|
| |||||
| Mutidrug Resistance |
| 12/74 (16.2) | 0/24 (0.0) | 0.03 | 9.80 | 0.50–193 |
|
| 13/74 (17.6) | 0/24 (0.0) | 0.03 | 10.8 | 0.55–209 | |
|
| 20/74 (27.0) | 1/24 (1.3) | 0.02 | 5.89 | 1.01–34.4 | |
|
| 27/74 (36.5) | 17/24 (70.8) | < 0.01 | 0.25 | 0.09–0.66 | |
|
| 28/74 (37.8) | 17/24 (70.8) | < 0.01 | 0.26 | 0.10–0.70 | |
- —This study was supported by the Brazilian Federal Agency for Support and Evaluation of Graduate Education (CAPES, Financial code 001), the Research Support Foundation of the State of Bahia (FAPESB‐ PP
Peer Reviews
No public reviews on file for this paper yet. If you reviewed it on a platform where reviews are public (OpenReview, ICLR, NeurIPS, ICML), you can paste yours below so the community can read it here.
Videos
No videos yet. Explain this paper in a talk, walkthrough, or lecture? Add one.
Taxonomy
TopicsAntibiotic Resistance in Bacteria · Escherichia coli research studies · Urinary Tract Infections Management
Introduction
1
Urinary tract infections (UTIs) are among the most prevalent bacterial infections globally, affecting over 150 million individuals yearly and imposing significant social and economic burdens (He et al. 2025). Community‐acquired UTIs (CA‐UTIs) constitute the majority of these cases, with uropathogenic Escherichia coli (UPEC) responsible for approximately 70–80% of infections in otherwise healthy individuals (Flores‐Mireles et al. 2015; Tano et al. 2022). In Brazil, however, most investigations on UPEC have been concentrated in the South and Southeast regions, and well‐characterized studies remain scarce, limiting a comprehensive understanding of the national epidemiological scenario.
Managing UTIs has become increasingly challenging due to the rapid emergence and dissemination of antibiotic‐resistant E. coli strains. Notably, extended‐spectrum β‐lactamase (ESBL)‐producing E. coli has been identified as the second most critical priority pathogen for public health, with a growing prevalence not only in hospital settings but also within the community (Sati et al. 2025; Fuga et al. 2022). Additionally, resistance to ESBLs, fluoroquinolones, and aminoglycosides severely restricts therapeutic options, heightens the risk of treatment failure, and often necessitates the use of last‐resort antibiotics such as carbapenems (Naghavi et al. 2024; Zeng et al. 2022).
UPEC strains originate from various phylogenetic groups, each associated with different virulence profiles and antibiotic resistance patterns. The pathogenicity of E. coli is primarily attributed to a multitude of virulence factors—such as adhesins, iron acquisition systems, and toxins—that facilitate colonization, invasion, immune evasion, and tissue damage during UTIs (Bien et al. 2012; Foxman 2014; Barrios‐Villa et al. 2023). These virulence genes are often located on pathogenicity‐associated islands (PAIs), which can be horizontally transferred between strains, enhancing UPEC's adaptability and pathogenic potential (Nascimento et al. 2022; Desvaux et al. 2020).
Epidemiological studies have revealed that a limited number of pandemic sequence types (STs) are responsible for most ExPEC infections worldwide. Specifically, ST131, ST69, ST73, ST95, ST127, ST10, and ST38 have been identified as predominant lineages, collectively accounting for over 50% of ExPEC infections globally (Manges et al. 2019; Fibke et al. 2019; Yamaji et al. 2018). These lineages are often associated with multidrug resistance and/or heightened virulence, contributing significantly to the global burden of UTIs. However, data on the distribution of these CA‐UPEC lineages in Brazil remain scarce. Thus, this study aims to characterize UPEC isolates from CA‐UTIs, focusing on their antibiotic resistance profiles, phylogenetic groups, virulence factors, and clonal lineages to provide insights into their pathogenic potential and support targeted strategies for effective UTI management.
Material and Methods
2
Study Design and Recruitment Process
2.1
This study included samples of patients with CA‐UTI obtained from a cross‐sectional study conducted from April 2019 to January 2022 at the Clinical Analysis Laboratory of the School of Pharmacy at the Federal University of Bahia, Brazil. Patients suspected of having a UTI with a request for urine culture were included when E. coli was identified in a positive urine culture, without age or sex restrictions. A new isolate was considered if a patient had a positive urine culture for E. coli more than 90 days after a previous positive result.
To classify an infection as a CA, patients must not have received intravenous therapy, renal dialysis, invasive urinary procedures, or any specialized or wound care within the previous 30 days. Additionally, they must not have undergone surgery or been hospitalized within the past 90 days nor resided in nursing homes or long‐term care facilities in the 12 months before urine culture collection. Information on sex, age, symptoms, and other relevant clinical and demographic data were gathered through questionnaire interviews.
Bacterial Identification and Antimicrobial Resistance Profile
2.2
A positive urine culture result was defined as growth ≥ 10^5^ CFU/mL, and E. coli isolates were identified through standard biochemical tests.
Antimicrobial susceptibility testing was conducted using the Kirby‐Bauer disk diffusion method for 19 antibiotics, including ampicillin (10 μg), amoxicillin‐clavulanate (20/10 μg), piperacillin‐tazobactam (100/10 μg), cefepime (30 μg), cefotaxime (30 μg), ceftriaxone (30 μg), ceftazidime (30 μg), cefuroxime (30 μg), aztreonam (30 μg), imipenem (10 μg), meropenem (10 μg), gentamicin (10 μg), tobramycin (10 μg), amikacin (30 μg), ciprofloxacin (5 μg), levofloxacin (5 μg), trimethoprim‐sulfamethoxazole (1.25/23.75 μg), fosfomycin (200 μg) and nitrofurantoin (300 μg), according to Clinical and Laboratory Standards Institute guidelines, 2023 (CLSI 2023). ESBL production was investigated using a disk approximation test, and isolates resistant to at least three different antimicrobial categories were classified as multidrug‐resistant (MDR) (Jiménez Pearson et al. 2019; Magiorakos et al. 2012). Quality control was ensured using E. coli ATCC 25922.
β‐lactamases Genes
2.3
DNA extraction from the isolates was performed using the boiling method, followed by PCR amplification to detect β‐lactamase genes, including bla SHV, bla TEM, bla OXA‐1‐like, bla CTX‐M‐1, bla CTX‐M‐2, bla CTX‐M‐9, bla IMP, bla VIM, bla KPC according to the protocol described by (Dallenne et al. 2010). Additionally, the presence of bla CTX‐M‐type genes was assessed following the method described by (Pagani et al. 2003). PCR products were visualized on 2% agarose gels stained with GelRed after electrophoresis, and images were captured using the l‐Pix EX system (Loccus).
Phylogeny Classification
2.4
The phylogenetic groups were determined by PCR assay, using a set of DNA markers to classify isolates into the eight recognized groups (A, B1, B2, C, D, E, F, G) and clade I, as previously described by Clermont and colleagues (Clermont et al. 2019, 2013).
Virulence Genes and Pathogenicity Islands
2.5
PCR assays were also used to identify key virulence factor genes: hlyA (hemolysin), *cnf‐*1 (cytotoxic necrotizing factor), fimH (type 1 fimbrial adhesin), papC, and papG (P‐fimbriae), sfa (S‐fimbrial adhesin), draD/afa (afimbrial adhesin), traT (serum resistance‐associated outer membrane lipoprotein), kpsM and neuA (capsules) and siderophore: iutA and aer (aerobactin), fyuA (yersiniabactin), iroN (salmochelina) (Yamamoto et al. 1995; Poey et al. 2012). To detect major pathogenicity islands (PAIs), a triplex PCR was performed, including PAI I_CFT076_, PAI II_CFT076_, and PAI IV_536_ (Johnson and Stell 2000; Sabaté et al. 2006). The oligonucleotides used for the 15 virulence genes and PAIs are detailed in Appendices (Table A1). Positive and negative control strains were included in each assay.
A virulence score (VS) was assigned to assess the virulence of the strains, with one point awarded for each detected gene, with adjustment for multiple detections of the aer and/or iutA.
Genotyping by Multilocus Sequence Typing
2.6
Multilocus sequence typing (MLST) was performed on all isolates classified as MDR and on those harboring 10 or more virulence genes, using this threshold as a pragmatic strategy to prioritize isolates with a higher predicted pathogenic potential, given resource limitations. The E. coli MLST scheme developed by Achtman, based on sequencing internal fragments of seven housekeeping genes (adk, fumC, gyrB, icd, mdh, purA, and recA) was applied (Wirth et al. 2006). Each isolate's sequence type (ST) was determined using the Escherichia spp. PubMLST database (https://pubmlst.org/organisms/escherichia-spp), and data was analyzed using the goeBURST algorithm implemented in the PHYLOViZ program (http://www.phyloviz.net/goeburst/). Clusters were defined as groups of STs sharing five or six identical loci, including the founder ST and its single‐ or double‐locus variants (SLVs or DLVs).
Statistical Analysis
2.7
Associations between UPEC phylogroups, antimicrobial resistance, and the presence of virulence factors were initially assessed using Fisher's exact test for categorical variables and the Mann‐Whitney U test for continuous variables. Binomial logistic regression models were applied to evaluate the role of virulence genes and phylogenetic background as predictors of resistance to specific antimicrobial agents. Multivariate models were constructed to adjust for potential confounders and to account for multiple comparisons. Statistical significance was set at p < 0.05. All analyzes were performed using RStudio software (version 2025.09.0 + 387).
Results
3
Clinical Characteristics
3.1
During the study period, 4,099 urine cultures were performed, of which 451 (11.0%) yielded positive results. Among the positive cultures, E. coli was the most frequently isolated pathogen, accounting for 60.5% (282/451), followed by Klebsiella pneumoniae (13.1%; 59/451), Streptococcus agalactiae (10.6%; 48/451), Staphyloccocus saprophyticus (2.4%; 11/451), Klebsiella aerogenes (2.2%–10/451), and Citrobacter sp. (1.3%; 6/451). Other microorganisms accounted for ≤ 1% each.
Ninety‐five patients with CA‐UTI caused by E. coli consented to participate in the study. One patient experienced two distinct UTIs during the study period, and another experienced three, resulting in 98 E. coli isolates. The majority of infections occurred in female patients (95.9%; 94/98), with a median age of 48 years (range: 31‐65) (Table 1). The most frequently reported comorbidity was diabetes mellitus (22.4%; 22/98). The primary clinical symptoms included burning micturition (50.0%; 49/98) and dysuria (41.8%; 41/98). All patients who reported the combined symptoms of burning micturition, dysuria, and fever also reported urinary incontinence.
Antimicrobial Resistance
3.2
A notable proportion of E. coli isolates exhibited resistance to antibiotics commonly prescribed for CA‐UTI, such as ampicillin (50.0%), trimethoprim‐sulfamethoxazole (34.7%), fluoroquinolones (33.7%), cefuroxime (18.4%) and amoxicillin‐clavulanate (14.3%). Lower resistance rates were detected for aztreonam, third‐ and fourth‐generation cephalosporins, gentamicin, and amikacin (Figure 1). Only one isolate was non‐susceptible to nitrofurantoin, and another was fosfomycin. No resistance was identified to piperacillin‐tazobactam, imipenem, or meropenem. Overall, 70.4% of the isolates were resistant to at least one agent, while the remainder showed susceptibility to all tested antimicrobials.
Frequency of antimicrobial resistance among 98 Escherichia coli isolates from community‐acquired urinary tract infections in Salvador, Brazil. AMI, amikacin; AMC, amoxicillin‐clavulanate; AMP, ampicillin; ATM, aztreonam; CAZ, ceftazidime; CIP, ciprofloxacin; CRO, ceftriaxone; CTX, cefotaxime; CXM, cefuroxime; FEP, cefepime; FOS, fosfomycin; GEN, gentamicin; LEV, levofloxacin; NIT, nitrofurantoin; SXT, trimethoprim‐sulfamethoxazole; TOB, tobramycin.
MDR profile was observed in 24.5% (24/98) of the isolates, and 6.1% (6/98) were identified as ESBL producers. Additionally, the median age of patients with MDR isolates (54 years) and ESBL‐producing isolates (58 years) was higher than that of patients with non‐MDR isolates (45 years). However, the difference was not statistically significant.
We also analyzed the presence of β‐lactamase genes and found that 33 out of 98 isolates were positive. Among these, 25 harbored bla TEM, one carried only bla CTX‐M‐1, two carried only bla CTX‐M‐9, and five exhibited coexistences, including combinations such as bla TEM + bla CTX‐M‐1; bla TEM + bla CTX‐M‐2; bla TEM + bla CTX‐M‐9; bla TEM + bla OXA‐1‐like, and bla TEM + bla CTX‐M‐9 + bla OXA‐1‐like. All ESBL‐producing E. coli isolates carried a bla CTX‐M gene.
Phylogenetic Group Distribution
3.3
Phylogroup B2 was the most prevalent among the UPEC isolates, comprising 48.0% (47/98) of the strains, followed by B1 (18.4%; 18/98), A (13.3%; 13/98), and D (10.2%; 10/98). Less common phylogroups included F (4.1%; 4/98), C (2.0%; 2/98), and E (2.0%; 2/98). Based on the Clermont method, two isolates could not be assigned to any phylogroup. A statistically significant association was observed between phylogroup A and multidrug‐resistant phenotype (p = 0.01) (Table 2).
Virulence Genes Distribution and Association With Phylogroups
3.4
Table 3 summarize the prevalence of virulence gene among E. coli isolates. The adhesin gene fimH was the most frequently detected (95.9%; 94/98), followed by the siderophore gene fyuA (76.5%; 75/98) and the capsule synthesis gene kpsM (57.1%; 56/98). Although less prevalent overall, the virulence genes papG, cnf‐1, sfa, and hlyA were almost exclusively found in isolates belonging to phylogroup B2. Additionally, genes such as neuA, kpsM, fyuA, and pathogenicity islands (PAI I_CFT073_, PAI II_CFT073_, and PAI IV_536_) were significantly associated with phylogroup B2 (p < 0.05) (Supporting Information Table A2).
Phylogroup B2 exhibited the highest proportion of isolates carrying multiple virulence factors. Notably, all isolates harboring 10 or more virulence genes were members of this group. However, when considering the average number of virulence genes per isolate, phylogroup F, despite being infrequent, showed the highest virulence score (7.5 genes/isolate), followed closely by B2 (7.3 genes/isolate) (Supporting Information Table A3). In contrast, phylogroups A and B1, traditionally regarded as commensal, displayed lower virulence score (3.6 and 2.1 genes/isolate, respectively), yet together accounted for more than 30% of all CA‐UTI cases in this study.
The strains carrying a higher number of virulence genes, defined by a virulence score ≥ 10 and representing 13.5% (12/98) of the isolates, were exclusively found within phylogroup B2. Interestingly, these isolates demonstrated an inverse relationship with antimicrobial resistance: none were classified as MDR, and 83.3% (10/12) lacked any of the tested resistance genes.
When analyzing the relationship between virulence factors and antimicrobial resistance, isolates carrying sfa, hlyA, and papC were significantly more susceptible to ciprofloxacin and levofloxacin. Additionally, the presence of papC was strongly associated with non‐MDR isolates (Table 4). On the other hand, isolates harboring the siderophore genes iutA and aer were significantly associated with resistance to ampicillin, ciprofloxacin, levofloxacin, and the MDR phenotype (p < 0.05).
MLST Analysis and Clonal Distribution
3.5
MLST analysis of 36 isolates identified 16 distinct sequence type (STs). The most prevalent was ST1193 (25.0%; 9/36), with all isolates exhibiting fluoroquinolone resistance and belonging to phylogroup B2. ST73 and ST127 were the next most frequent, each accounting for four isolates (11.1%).
GoeBURST analysis, based on single‐locus variants (SLVs) or double‐locus variants (DLVs), revealed two main clonal complexes. Clonal complex CC14 comprises ST1193 and ST14, representing 10 isolates (27.8%). Clonal complex CC10 included six isolates (16.7%) distributed across five STs, ST10 (n = 2), ST44, ST617, ST744, and ST1286 (each n = 1). The remaining STs were singletons, showing no clonal relatedness within the analyzed data set.
MDR isolates were distributed across several STs, including ST1193, ST131, ST10, ST224, ST38, ST44, ST46, ST410, ST617, ST744, and ST1286. Most MDR isolates (87.5%; 21/24) belonged to high‐risk pandemic clones associated with human infections. In contrast, the isolates harboring the highest virulence factors were ST73, ST127, ST698, ST95, and ST14, all of which were non‐MDR.
Discussion
4
In this study, E. coli was the most frequently isolated pathogen in community‐acquired urinary tract infections (CA‐UTI). More than 90% of cases occurred in women, with the highest frequency among individuals aged 31‐59 years, aligning with previous studies from Brazil and Japan (Tano et al. 2022; Matsukawa et al. 2019). Diabetes mellitus was the most common comorbidity, consistent with its well‐established role as a major risk factor for UTIs. These findings align with early CA‐UTI studies reporting diabetes prevalence rates between 21% and 31% (Foxman 2014; Blanco et al. 2016; Bian et al. 2024).
Phylogenetic analysis showed that most UPEC isolates belonged to phylogroup B2 (48.0%), followed by B1 (18.4%) and A (13.3%). This distribution is consistent with findings from Egypt (El‐baz et al. 2022) and Romania (Cristea et al. 2019), but differs from reports from other regions of Brazil, where higher frequencies of phylogroups B2 and D and lower proportions of A and B1, have been observed (Lara et al. 2017; de Souza da‐Silva et al. 2020; De Souza. 2019; Coura et al. 2021). Notably, several studies highlight that phylogroup distribution can vary significantly, even within the same country or geographic region, reflecting substantial heterogeneity across different populations (El‐baz et al. 2022; Rezatofighi et al. 2021; Wang et al. 2023; Miranda‐Estrada et al. 2017).
Our findings highlight that strains traditionally considered commensal, particularly those belonging to phylogroups A and B1, which accounted for approximately one‐third of the isolates, are capable of causing extraintestinal infections. This ability is attributed to E. coli's remarkable capacity to acquire virulence genes through horizontal gene transfer within the gastrointestinal tract (Sabaté et al. 2006; Lara et al. 2017). Acquiring these genes enhance the pathogen's virulence potential, facilitating effective colonization and infection of the urinary tract.
The antimicrobial resistance patterns observed in this study reinforce the recommendation of nitrofurantoin and fosfomycin as first‐line treatments for CA‐UTIs. These findings are consistent with reports from other regions of Brazil (Tano et al. 2022; de Souza da‐Silva et al. 2020; De Souza. 2019; Coura et al. 2021), as well as from Europe (Cristea et al. 2019; Grados et al. 2019) and the Middle East (Yazdanpour et al. 2020; Darraj 2023). Our results underscore antimicrobial stewardship's importance in mitigating the risk of increasing resistance, particularly nitrofurantoin. While fosfomycin remains underutilized, primarily due to its relatively high cost and unavailability in the public health system, nitrofurantoin is more commonly prescribed. Furthermore, our findings highlight the need for caution when prescribing fluoroquinolones and trimethoprim‐sulfamethoxazole, given that resistance rates exceeded 30% among isolates despite continued use in CA‐UTI treatment.
The frequencies of MDR phenotype and ESBL‐producing strains among CA‐UPEC isolates in our study are comparable to those reported in other Brazilian studies (Tano et al. 2022; de Souza da‐Silva et al. 2020; De Souza. 2019; Coura et al. 2021). In contrast, significantly higher resistance rates have been observed in Mexico and Iran, where the prevalence of MDR and ESBL‐producing strains exceeds 50% (Miranda‐Estrada et al. 2017; Belmont‐Monroy et al. 2022; Mostaghimi et al. 2024). Our analysis, revealed that MDR isolates were significantly associated with phylogroup A, which differs from findings in Rio de Janeiro, Brazil, where MDR strains were predominantly linked to phylogroups B2, D, and F (Campos et al. 2018).
Moreover, the most recent study conducted in our region indicated that the prevalence of ESBL‐producing E. coli was less than one percent (Berman et al. 2014). This highlights a concerning increase in resistance over the past decade in CA‐UTI cases. This rising trend is alarming and corresponds with global reports of increasing antimicrobial resistance in community settings (Achukutty et al. 2020; Devi et al. 2020). This pattern has been particularly evident in several Asian countries (Kumar et al. 2021; Jia et al. 2021; Islam et al. 2022; Halaji et al. 2021) and may have been further exacerbated by the widespread overuse and misuse of antibiotics during the COVID‐19 pandemic (Venugopal et al. 2024; Abdelaziz Abdelmoneim et al. 2024).
UPEC strains harbor a wide array of virulence factors that enable them to effectively colonize the urinary tract and evade the host immune defenses (Barrios‐Villa et al. 2023; Etefia 2021). In the present study, all isolates were positive for at least two of the virulence genes analyzed. The most prevalent was fimH, a critical component of UPEC pathogenicity, as it mediates adhesion to uroepithelial cells (Hyun et al. 2021; Khairy et al. 2019). The fimH gene has emerged as a promising vaccine targed for UTI prevention, primarily due to the ability of specific antibodies to inhibit its function and block bladder colonization (Flores‐Mireles et al. 2015). The iron acquisition system encoded by fyuA and PAI IV_536_ was frequently detected among UPEC strains in CA‐UTI, with prevalence rates of 76.5% and 77.5% among UPEC strains, respectively. Similar findings have been reported in other studies, as the expression of this factor plays a critical role in the pathogenesis of ascending UTIs and is essential to overcoming iron limitation in host environments such as urine (Nascimento et al. 2022; Etefia 2021).
Interestingly, we observed an inverse relationship between antibiotic resistance and virulence. Phylogroups F and B2 exhibited higher virulence profiles but were predominantly non‐MDR, in contrast to findings from other studies that report a positive correlation between virulence and resistance (Campos et al. 2018; Allami et al. 2022; Ballesteros‐Monrreal et al. 2020).
Regarding molecular genotyping, MLST analysis revealed ST1193 as the predominant clone among MDR CA‐UPEC isolates in our study, consistent with findings from a study in China (Zeng et al. 2021). In contrast, studies from the USA, Canada, and Europe have reported lower frequencies of ST1193; however, its global dissemination has been well documented in UPEC and other ExPEC isolates across multiple continents (Fibke et al. 2019; Yamaji et al. 2018; Flament‐Simon et al. 2020; Tsui et al. 2024). In Brazil, previous studies, particularly from Rio de Janeiro, have reported ST69, ST73, and ST131 as the most prevalent CA‐UPEC lineages, and a nationwide study employing a One Health approach highlighted the clonal heterogeneity of UPEC across different Brazilian regions but did not report the presence of ST1193, suggesting its emergence as a novel clone in our region (Fuga et al. 2022; de Souza da‐Silva et al. 2020).
ST1193 is recognized as an emerging clone, and our findings emphasize its growing relevance in MDR community‐associated isolates. Pitout et al (Pitout et al. 2022). suggest that ST1193 follows a similar evolutionary trajectory to E. coli ST131, often described as “the most successful MDR clone of all time” due to shared resistance traits, high transmissibility, and increasing global dissemination. Importantly, most MDR isolates in our study (87.5%; 21/24) belonged to high‐risk pandemic clonal groups in humans, reinforcing the critical role of epidemic clones in spreading of antimicrobial resistance.
This study has some limitations, most notably its local scope, which may restrict the generalizability of the findings. Recruitment, was also constrained by logistical challenges, resulting in the inclusion of only a subset of eligible cases. While MLST provided important insights into clonal distribution, the absence of whole genome sequencing as well as plasmid and integron analysis limited a deeper exploration of the genetic determinants of resistance and virulence. Even so, the resistance patterns observed and the emergence of high‐risk clones, such as ST1193, mirror the global trends, indicating broader epidemiological relevance. Furthermore, the scarcity of published data from our region, together with the inclusion of well‐characterized community‐acquired infections supported by detailed clinical data, underscores the relevance of this study.
In conclusion, E. coli was responsible for most CA‐UTI cases in this study. Phylogroup B2, characterized by an extensive repertoire of virulence genes, and phylogroup A, associated with greater antimicrobial resistance, were the most prevalent. Among the antibiotics tested, nitrofurantoin and fosfomycin demonstrated the highest efficacy against UPEC isolates in our study. In contrast, high resistance rates to commonly prescribed empirical therapies, such as ampicillin, fluoroquinolones, and trimethoprim‐sulfamethoxazole, highlight the need for updated treatment guidelines based on local resistance patterns. Notably, ST1193 emerged as the dominant MDR clone, and its increasing presence in community settings reinforces the urgent need for integrated surveillance and infection control strategies to curb the spread of MDR E. coli.
Author Contributions
Vivian Santos Galvão: conceptualization (supporting), investigation (lead), methodology (supporting), visualization (lead), data curation (lead), writing – original draft (lead), validation (lead), formal analysis (lead), writing – review and editing (equal). Adriano Souza Santos Monteiroand and João Lucas Pinheiro Leite: investigation (supporting), methodology (supporting), formal analysis (supporting), data curation (supporting), validation (supporting), writing – review and editing (equal). Isabela Oliveira Sousa: investigation (supporting), methodology (lead), validation (supporting), writing – review and editing (equal). Soraia Machado Cordeiro: supervision (supporting), conceptualization (supporting), project administration (supporting), resources investigation (supporting), funding acquisition (supporting), methodology (supporting), validation (supporting), writing – review and editing (equal). Joice Neves Reis: supervision (lead), conceptualization (lead), project administration (lead), resources investigation (supporting), funding acquisition (lead), methodology (supporting), data curation (supporting), formal analysis (supporting), visualization (supporting), validation (supporting), writing – review and editing (equal). All authors read and approved the final article.
Ethics Statement
The study was conducted in accordance with the ethical standards of both the institutional and national research committee and was approved by the Research Ethics Committee of the Federal University of Bahia (approval numbers 2.170.080/2017 and 2.012.382).
Consent
Written or verbal informed consent was obtained from all participants before data collection.
Conflicts of Interest
The authors declare no conflicts of interest.
Supporting information
Table A1: Oligonucleotides for the identification of virulence factors and pathogenicity islands. Table A2: Virulence factors and islands of pathogenicity relation with phylogenetic groups of E. coli isolates from CA‐UTI (n=98). Table A3: Patterns of virulence genes in E. coli from community‐acquired urinary tract infections, stratified by phylogenetic groups.
The reference list from the paper itself. Each links out to its DOI / PubMed record.
- 1Abdelaziz Abdelmoneim, S. , R. Mohamed Ghazy E. Anwar Sultan , M. A. Hassaan , and M. Anwar Mahgoub . 2024. “Antimicrobial Resistance Burden Pre and Post‐COVID‐19 Pandemic With Mapping the Multidrug Resistance in Egypt: A Comparative Cross‐Sectional Study.” Scientific Reports 14, no. 1: 7176.38531847 10.1038/s 41598-024-56254-4PMC 10966009 · doi ↗ · pubmed ↗
- 2Achukutty, T. , H. Aravind , D. Emil , R. Ravina , R. Lakshmi , and T. Appu . 2020. “Antimicrobial Susceptibility of Uropathogens and Prescribing Patterns in Hospital‐ and Community‐Acquired Urinary Tract Infections in a Tertiary Care Hospital.” Journal of Applied Pharmaceutical Science 10, no. 11: 050–058.
- 3Allami, M. , M. Bahreini , and M. R. Sharifmoghadam . 2022. “Antibiotic Resistance, Phylogenetic Typing, and Virulence Genes Profile Analysis of Uropathogenic Escherichia coli Isolated From Patients in Southern Iraq.” Journal of Applied Genetics 63, no. 2: 401–412.35143031 10.1007/s 13353-022-00683-2 · doi ↗ · pubmed ↗
- 4Ballesteros‐Monrreal, M. G. , M. M. P. Arenas‐Hernández , and Y. Enciso‐Martínez , et al. 2020. “Virulence and Resistance Determinants of Uropathogenic Escherichia coli Strains Isolated From Pregnant and Non‐Pregnant Women From Two States in Mexico.” Infection and Drug Resistance 13: 295–310.32099421 10.2147/IDR.S 226215 PMC 6997036 · doi ↗ · pubmed ↗
- 5Barrios‐Villa, E. , L. R. Picón , R. B. Reynaga , and M. M. de la P. Arenas‐Hernández . 2023. “An Updated Overview on the Resistance and Virulence of UPEC.” In Em: Trending Topics in Escherichia coli Research, 249–276. Springer International Publishing.
- 6Belmont‐Monroy, L. , R. M. Ribas‐Aparicio , E. González‐Villalobos , et al. 2022. “Molecular Typification of Escherichia coli From Community‐Acquired Urinary Tract Infections in Mexico.” International Journal of Antimicrobial Agents 60, no. 4: 106667.36038094 10.1016/j.ijantimicag.2022.106667 · doi ↗ · pubmed ↗
- 7Berman, H. , M. G. Barberino , E. D. Moreira , L. Riley , and J. N. Reis . 2014. “Distribution of Strain Type and Antimicrobial Susceptibility of Escherichia coli Isolates Causing Meningitis in a Large Urban Setting in Brazil.” Journal of Clinical Microbiology 52, no. 5: 1418–1422.24523478 10.1128/JCM.03104-13PMC 3993653 · doi ↗ · pubmed ↗
- 8Bian, C. , Y. Zhu , X. Fang , et al. 2024. “Risk Factors and Economic Burden for Community‐Acquired Multidrug‐Resistant Organism‐Associated Urinary Tract Infections: A Retrospective Analysis.” Medicine 103, no. 21: 38248.10.1097/MD.0000000000038248 PMC 1112471538788007 · doi ↗ · pubmed ↗