Patient risk evaluation for transcatheter aortic valve replacement (PRE-TAVR) — identification of real-time predictors of short- and long-term mortality
Julian Kreutz, Philipp Lauten, Georgios Chatzis, Marie Nabrotzki, Nikolaos Patsalis, Styliani Syntila, Harald Lapp, Bernhard Schieffer, Birgit Markus

TL;DR
This study developed a new risk model (PRE-TAVR) to better predict short- and long-term mortality after TAVR procedures, outperforming existing scores.
Contribution
A novel, more accurate risk prediction model for TAVR patients using real-time clinical variables.
Findings
The PRE-TAVR model achieved an AUC of 0.770 for 1-year mortality, outperforming EuroSCORE II and STS/ACC TAVR scores.
For 30-day mortality, the model showed an AUC of 0.699, slightly better than EuroSCORE II and comparable to the STS/ACC TAVR score.
Key predictors included age, NYHA stage, COPD, atrial fibrillation, and biomarkers like C-reactive protein and platelet count.
Abstract
The steadily increasing number of transcatheter aortic valve replacement (TAVR) procedures being performed on a heterogeneous patient population highlights the need for robust risk assessment. While EuroSCORE II is well established for surgical risks, it is less effective for TAVR, and the newer STS/ACC TAVR score has so far been validated mainly for in-hospital and 30-day mortality. This study aims to improve risk stratification for TAVR patients by identifying real-time predictors of 30-day and 1-year mortality that incorporate comprehensive, procedure-specific factors. Five-year data from 2256 transfemoral TAVR procedures performed at two German Heart Centers (2017–2022) were retrospectively analyzed. Predictors of 1-year and 30-day mortality were assessed using multivariable logistic and LASSO regression, considering a broad spectrum of patient demographics, comorbidities, and…
Genes, proteins, chemicals, diseases, species, mutations and cell lines named across the full text — each resolved to its canonical identifier and authoritative record.
Click any figure to enlarge with its caption.
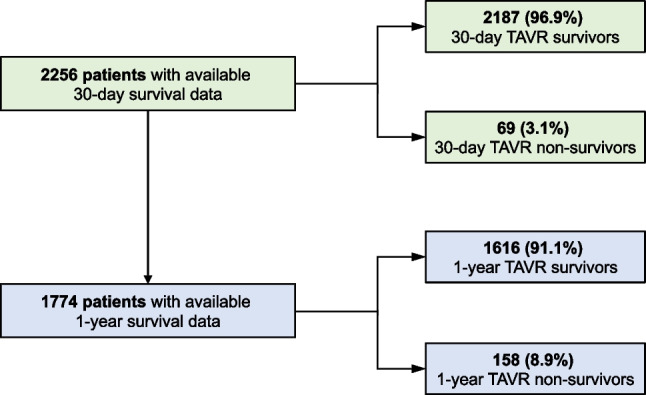 Figure 1
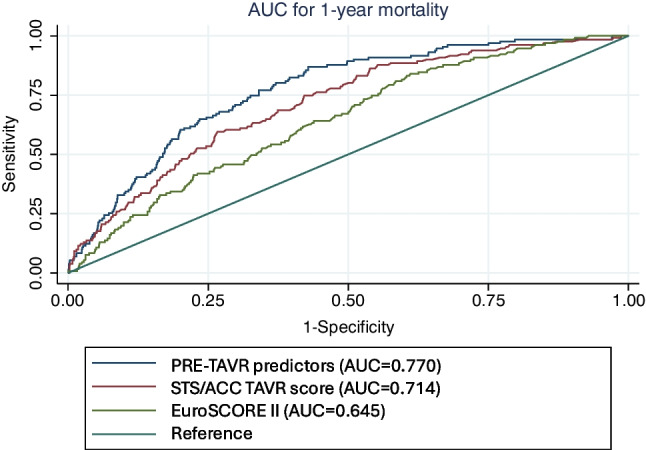 Figure 2
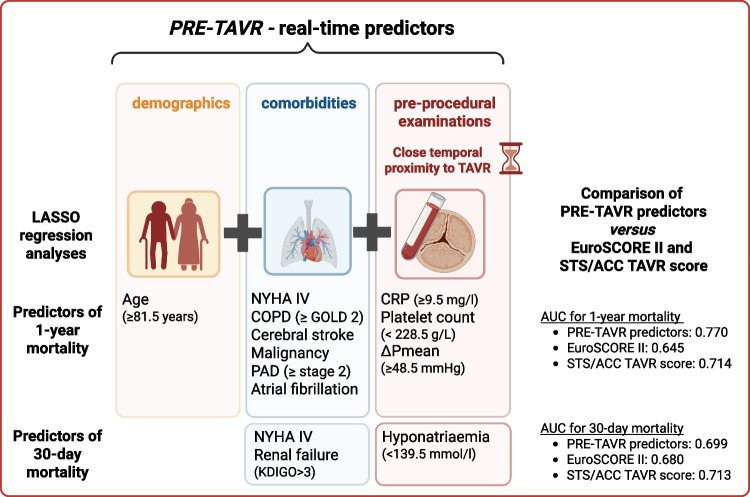 Figure 3
- —Philipps-Universität Marburg (1009)
Peer Reviews
No public reviews on file for this paper yet. If you reviewed it on a platform where reviews are public (OpenReview, ICLR, NeurIPS, ICML), you can paste yours below so the community can read it here.
Videos
No videos yet. Explain this paper in a talk, walkthrough, or lecture? Add one.
Taxonomy
TopicsCardiac Valve Diseases and Treatments · Infective Endocarditis Diagnosis and Management · Aortic Disease and Treatment Approaches
Introduction
In the past decades, transcatheter aortic valve replacement (TAVR) has become a well-established treatment option for patients with severe aortic stenosis. According to available study data, the therapy is currently applicable to a broad patient cohort. Initially limited to patients ineligible for or at high risk for surgical aortic valve replacement (SAVR), the indication has been extended in recent years to include those at intermediate and low risk, as well as patients at different stages and severity of the disease [1–6]. To optimize outcomes in these heterogeneous patient cohorts, this, in turn, underscores the need for assessing diverse and individualized risk profiles. Heart teams consistently rely on widely accepted surgical risk prediction models, such as the European System for Cardiac Operative Risk Evaluation (EuroSCORE II), to evaluate mortality and outcomes [7]. However, these models often fail to accurately predict mortality following interventional procedures such as TAVR, which significantly limits their validity and applicability [8, 9]. Although, over time, new TAVR-specific tools, such as the FRANCE-2 model, have shown superior performance compared to EuroSCORE II in external validation cohorts, their utility and clinical application remain limited [10, 11]. This limitation may stem from their static nature and broad temporal scope, which prevent them from capturing the dynamic range of relevant factors. The STS/ACC TAVR in-hospital mortality risk score, which uses 12 variables, has been evaluated for short-term outcomes and has demonstrated superior performance compared to existing models, establishing its potential as a valuable tool [12]. However, reliable predictors of 1-year mortality, which are essential for long-term outcomes, remain elusive. The aim of this study was to identify real-time predictors of both 30-day and 1-year mortality to improve the evaluation of the peri-interventional period and enable a more targeted approach to risk stratification. The term ‘real-time’ in this context, emphasizes the ability of these predictors to support clinical decision-making based on parameters obtained in close temporal proximity to the procedure, reflecting the patient’s actual clinical condition. Advanced statistical methods, including Least Absolute Shrinkage and Selection Operator (LASSO) analysis, were applied to improve predictive accuracy beyond traditional risk models. This approach seeks to facilitate more appropriate, timely, and personalized clinical decision-making.
Materials and methods
Study design
This multicenter study retrospectively analyzes comprehensive 5-year data (January 2017 and December 2022) from patients with severe aortic stenosis who underwent TAVR implantation at the Heart Centers of the University Hospital of Marburg and the Central Hospital of Bad Berka (Germany). Inclusion criteria for further data analysis were transfemoral TAVR implantation and availability of 30-day mortality data; no other exclusion criteria were applied, resulting in a consecutive cohort. To identify independent predictors of 30-day and 1-year mortality, this study compares data from TAVR survivors and non-survivors, focusing on the effects of demographics, comorbidities, and pre-interventional examinations, including electrocardiograms (ECG), chest X-rays, blood tests, computed tomography, and echocardiography. Additionally, it correlates peri-interventional complications with 30-day and 1-year mortality**.** The EuroSCORE II and the STS/ACC TAVR in-hospital mortality risk score were calculated using data from hospital records, but only for patients who had complete data for all the necessary variables.
Patient selection followed the European Society of Cardiology (ESC)/European Association for Cardio-Thoracic Surgery (EACTS) guidelines for TAVR implantation. Periprocedural management was similar following comparable standard operating procedures (SOPs) in both heart centers, with a consistent team of experienced professionals over the years. Patient cases were pre-evaluated and reviewed by each center’s heart team. Data collection included physician letters, laboratory results, admission ECGs, imaging reports, and procedural protocols.
Statistical analysis
Descriptive statistics and bivariate analyses
Statistical analyses were performed using SPSS (IBM, version 29) and Stata (StataCorp LLC., version 16) to compare data between 30-day TAVR survivors and non-survivors as well as between 1-year TAVR survivors and non-survivors. Continuous variables were assessed for normality and described as mean ± standard deviation or median and interquartile range (IQR) for non-normal distributions. Categorical variables were summarized using counts and percentages. Bivariate analyses were conducted to compare TAVR survivors and non-survivors using t-tests or Mann–Whitney tests for continuous variables and Chi-squared tests or Fisher’s exact tests for categorical variables, with a significance level set at p < 0.05.
Handling of missing data
Missing data was handled using the multiple imputation procedure in Stata 16.1, including all variables intended for subsequent testing. Twenty imputations were generated for each missing value. The imputation model used linear regression for continuous variables and logistic regression for categorical variables, maintaining consistency across variable types.
LASSO regression analyses
Additionally, to identify predictors of 1-year and 30-day mortality, LASSO regression analyses were conducted. LASSO regression is effective at refining models by shrinking irrelevant coefficients toward zero and selecting the most informative predictors. This approach reduces the risk of overfitting and stabilizes estimates when predictors are highly correlated, or multicollinear. It is also well-suited for high-dimensional datasets. To address the missing data, we performed multiple imputation and created 20 complete datasets. We then performed LASSO regression separately on each of these 20 imputed datasets, producing slightly different models depending on the imputed values. We considered variables that appeared in at least 10 of the 20 models to be robust or “stable” predictors. We then included these stable predictors in multivariable logistic regression analyses to identify independent predictors of 1-year and 30-day mortality.
Multivariable regression analyses and model performance assessment
Multivariable regression analyses were performed to identify independent predictors of 1-year and 30-day mortality from statistically significant factors in the previous bivariate comparisons. Additionally, multivariable regression analyses were conducted using the variables identified in the LASSO analyses. Stata software was used to calculate the area under the curve (AUC) of the receiver operating characteristic (ROC) for logistic regression models and compare them with EuroSCORE II predictions for patients for whom this information was available. To compare the differences between the AUC of the ROC curves, the DeLong test was employed. Relevant biomarkers were log-transformed for analysis, and further regression models calculated odds ratios (OR) and confidence intervals (CI) to the second decimal place. It should be noted that OR values of 1.00 were never included in the models but could be the result of rounding to the second decimal place. Cut-off values were determined using Youden’s index for each identified significant predictor.
Positive and negative predictive value calculations
To provide additional clinical context for our models, we calculated the positive and negative predictive values for 1-year and 30-day mortality. We used the actual survival outcome (alive or deceased) as the “true state” and the logistic regression model predictions as the “test result.” We performed logistic regressions to generate continuous linear predictor values (log-odds). To dichotomize these values, we identified the optimal cutoff using Youden’s index to maximize sensitivity and specificity for our dataset. Using these thresholds, we created binary predictions of “likely dead” or “likely alive.” From the resulting 2 × 2 tables, we calculated the PPV, NPV, sensitivity, and specificity (with 95% confidence intervals). We applied the same approach to the EuroSCORE II and STS/ACC TAVR score for direct comparison.
Correlation analysis of peri-interventional complications
Moreover, correlation analysis was employed to assess the relationship between peri-interventional complications and 30-day and 1-year mortality. The Phi coefficient for binary variables assessed the impact of specific complications on mortality. For continuous or ordinal variables, Pearson’s r quantified linear relationships. Values close to ± 0.1 indicated weak, ± 0.3 moderate, and ± 0.5 strong correlations, up to ± 1 for very strong correlations.
Clinical trial registration and ethics approval
The study was registered in the German Clinical Trials Register (ID DRKS00035463) and approved by the local ethics committees of the Philipps University of Marburg (approval date: 27 October 2022) and the Ethics Committee of the Thuringia Medical Association (approval date: 13 July 2023) in accordance with the Declaration of Helsinki.
Results
Study cohort
This retrospective analysis included data from 2256 patients (Fig. 1) who underwent transfemoral TAVR implantation at one of the two participating centers during the study period and for whom 30-day mortality data were available (5 patients were previously excluded due to missing data). 1-year survival data were available for 1774 patients. Of these patients, 1616 (91.1%) survived one year after TAVR implantation (1-year TAVR survivors) and 158 (8.9%) died within the first year (1-year TAVR non-survivors). The median EuroSCORE II score was 4.6 (IQR 2.7–8.5) for 1-year TAVR survivors and 7.0 (IQR 4.2–14.8) for 1-year TAVR non-survivors (p < 0.001). The first 30 days were survived by 2187 (96.9%) of the 2256 patients (30-day TAVR survivors), while 69 patients (3.1%) died within the first 30 days (30-day TAVR non-survivors). The overall outcome of the entire study cohort remained stable over the years without significant changes. The median EuroSCORE II score was 4.5 (IQR 2.7–8.1) for 30-day TAVR survivors and 6.9 (IQR 4.5–16.4) for 30-day TAVR non-survivors (p < 0.001). One thousand four hundred forty-nine patients received the Edwards Sapien 3 balloon-expanding system. In 587 patients, the Medtronic CoreValve/Evolut platform self-expanding system was implanted, and in 391 patients the Boston Scientific SYMETIS ACURATE neoTM TF self-expanding system. The Boston Scientific LotusEdge mechanical expansion system was implanted in 29 patients.Fig. 1. Study cohort
Identification of predictors of 1-year mortality
To determine the predictors of 1-year mortality, the TAVR patient cohort was divided into two subgroups: 1-year TAVR survivors and non-survivors. First, demographic data and comorbidities of both subgroups were compared in a bivariate comparative analysis and LASSO analysis. Results, including p-values from bivariate comparisons and frequencies of LASSO models including each variable, are shown in Table 1. Table 1. Demographics and comorbidities of 1-year TAVR survivors vs. non-survivorsn = 1-year TAVR survivors1-year TAVR non-survivorsp-valueNumber of LASSO modelsNumber of patients^a^17741616 (91.6)158 (8.9)Age (years)^b^177479.0 (± 6.4)81.4 (± 5.8) < 0.00120Male sex^a^1774852 (52.7)95 (60.1)0.07520BMI (kg/m^2^)^b^177128.8 (± 5.4)28.1 (± 4.9)0.13619CHD ^a^1774872 (54.0)102 (64.6)0.01120Cardiac bypass surgery^a^177396 (5.9)12 (7.6)0.4080Atrial fibrillation^a^1774538 (33.3)84 (53.2) < 0.00120PAD (≥ stage 2)^a^1773114 (7.1)21 (13.3)0.00520Heart failure ≥ NYHA III^a^17451083 (68.2)128 (82.1) < 0.00120Arterial hypertension^a^17731409 (87.2)138 (87.3)0.9720Diabetes mellitus^a^1773676 (41.9)67 (42.4)0.89415Insulin-dependent diabetes mellitus^a^1725276 (17.1)25 (22.7)0.1310Nicotine abuse (> 5py)^a^1774248 (15.3)26 (16.5)0.7130Chronic renal failure KDIGO ≥ stage 3^a^1774629 (38.9)99 (62.7) < 0.00120Need for renal replacement therapy^a^177426 (1.6)3 (1.9)0.73914COPD ≥ GOLD 2^a^1774158 (9.8)29 (18.4) < 0.00120Cerebral Stroke^a^177346 (2.8)11 (7.0)0.00520Malignant disease^a^177390 (5.6)19 (12.0)0.00120Pacemaker^a^1771176 (10.9)13 (8.3)0.30920n number of patients with valid data, *BMI *body mass index, CHD coronary heart disease, PAD peripheral arterial disease, NYHA New York Heart Association, py pack years, KDIGO Kidney Disease Improve Global Outcomes, COPD chronic obstructive pulmonary disease^a^n (%); ^b^Mean(SD)
Subsequently, bivariate comparisons and LASSO analysis were made for the pre-interventional examinations (ECG, chest x-ray, blood values in the 24 h before TAVR, computed tomography, and echocardiography) according to the pre-described statistical procedures (Table 2). Table 2. Pre-interventional examinations of 1-year TAVR survivors versus non-survivorsn =1-year TAVR survivors1-year TAVR non-survivorsp-valueNumber of LASSO modelsPre-interventional ECG Heart rate at rest (bpm)^b^176175.2 (± 14.2)76.2 (± 15.9)0.4470 Right bundle branch block^a^1774138 (8.5)16 (10.0)0.4990 Left bundle branch block^a^1774148 (9.2)19 (12.0)0.2390 First degree AV block^a^1774176 (10.9)11 (7.0)0.12520Pre-interventional chest X-ray Pleural effusion^a^1774174 (10.8)31 (19.6) < 0.0016 Other signs of congestion^a^177487 (5.4)15 (19.5)0.0340Pre-interventional blood values (24 h before TAVR) CRP (mg/dL)^c^17682.9 (1.2–7.3)5.4 (2.2–14.0) < 0.00120 HbA1c (%)^b^17246.2 (± 0.9)6.2 (± 1.1)0.8000 Hemoglobin (g/L)^b^1774126.5 (± 17.4)119.7 (± 19.9) < 0.00120 Hematocrit (L/L)^b^17720.382 (± 0.047)0.365 (± 0.054) < 0.0010 Leucocyte count (g/L)^c^17667.7 (6.5–9.3)8.1 (6.5–9.7)0.1870 Platelet count (g/L)^b^1774214.5 (± 69.2)202.9 (± 80.7)0.48020 Sodium (mmol/L)^b^1760140.9 (± 3.4)140.0 (± 4.9)0.03420 NT-proBNP (pg/mL)^c^12671514.0 (579.0–3520.3)3942.0 (1293.0–7774.5) < 0.00120Pre-interventional CT scan Diameter of aortic valve annulus^b^174624.6 (± 2.4)24.8 (± 2.4)0.5360 Diameter of ascending aorta^b^120934.8 (± 4.4)34.8 (± 4.3)0.93111 Bicuspid aortic valve ^a^1774166 (10.3)12 (7.6)0.2850Pre-interventional echocardiography LVEF ≤ 45%^a^1763403 (25.1)48 (30.6)0.13319 Vmax (mmHg)^b^15434.2 (± 0.7)4.0 (± 0.7)0.0020 ΔPmean (mmHg)^b^162945.6 (± 15.6)40.1 (± 15.3) < 0.00120 Vitium (grade 2/3) of the mitral valve^a^1747513 (32.2)61 (39.1)0.08214 Vitium (grade 2/3) of the tricuspid valve^a^1748333 (20.9)57 (36.5) < 0.00120n number of patients with valid data, bpm beats per minute, AV Block atrioventricular block, CRP C-reactive protein, HbA1c hemoglobin A1c, NT-proBNP N-terminal prohormone of brain natriuretic peptide, LVEF left ventricular ejection fraction, Vmax peak transvalvular velocity of aortic valve, ΔPmean mean aortic valve pressure gradient^a^n (%); ^b^Mean (SD); ^c^Median (IQR)
Multivariable regression analysis of parameters from bivariate comparisons between 1-year TAVR survivors and non-survivors
In a second step, multiple regression analysis (Supplementary Table 1) was performed to identify independent predictors of 1-year mortality using variables that previously showed significant differences between 1-year TAVR survivors and non-survivors (Tables 1 and 2). Since the analysis revealed a high correlation between hemoglobin and hematocrit, which led to large confidence intervals for hematocrit, the variable “hematocrit” was excluded from the subsequent models. NYHA III and NYHA IV stages were treated separately. Moreover, predictors with no significant p-values were progressively excluded to simplify the model. The final regression model (Table 3), which included 1410 patients with available EuroSCORE II data, achieved an AUC of 0.747 (95% CI 0.705–0.789). This model significantly outperformed both the EuroSCORE II (AUC 0.645, 95% CI 0.599–0.691) and the STS/ACC TAVR score (AUC 0.7139, 95% CI 0.670–0.758), as validated by the DeLong test (p < 0.001). Cut-off values of these predictors were established using the Youden index (Table 3). Table 3. Predictors for 1-year mortality from multivariable regression analysis including significant variables from Supplementary Table 1 and cut-off values for predictors using the Youden index. Parameters were initially identified from the bivariate comparisons between 1-year TAVR survivors and non-survivors from Table 1 (demographics and comorbidities) and Table 2 (pre-interventional examinations). Predictors that were found to be non-informative were previously excludedOR (95% CI)p-valueCut-off valueAge (years)1.07 (1.04–1.12)< 0.00181.5Heart failure NYHA IV1.97 (1.25–3.11)0.004/COPD ≥ GOLD 22.27 (1.39–3.72)0.001/Cerebral stroke2.99 (1.35–6.65)0.007/Malignant disease2.44 (1.32–4.51)0.005/Atrial fibrillation1.71 (1.16–2.52)0.007/CRP (mg/l)1.22 (1.06–1.41)0.0059.5ΔPmean (mmHg)0.98 (0.97–1.00)0.01248.5NYHA New York Heart Association, COPD chronic obstructive pulmonary disease, CRP C-reactive protein, ΔPmean mean aortic valve pressure gradient
LASSO analysis for identifying predictors of 1-year mortality
For the LASSO analysis, variables included in at least 10 of 20 LASSO models from previous analyses (Tables 1 and 2) were identified as stable predictors and further evaluated in multiple regression analyses (Supplementary Table 2). NYHA stages III and IV were analyzed separately, analogous to the previous multiple regression model (“Multivariable regression analysis of parameters from bivariate comparisons between 1-year TAVR survivors and non-survivors” section). The original imputed model was confirmed by a robustness analysis with non-imputed data, which showed no relevant differences. Once again, predictors with a p-value > 0.05 were progressively excluded to simplify the model. In the LASSO analysis, the previously identified PRE-TAVR predictors were confirmed, and peripheral arterial disease (≥ stage 2) and the platelet count before TAVR were also shown to be significant predictors, with cut-off values identified using the Youden index (Table 4). The final predictor model for 1-year mortality (PRE-TAVR predictors), which included 1410 patients with fully documented data, had an AUC of 0.770 (95% CI 0.731–0.809). This significantly exceeded the AUCs of the EuroSCORE II (0.645, 95% CI 0.599–0.691) and the STS/ACC TAVR score (0.7139, 95% CI 0.66994–0.75791), and the superiority was confirmed by a DeLong test with a p-value of < 0.001. The corresponding ROC curves are shown in Fig. 2. Additionally, the PRE-TAVR model demonstrated a PPV of 17.2% (95% CI 14.4–20.3%) and a NPV of 97.7% (95% CI 96.4–98.7%). For comparison, the EuroSCORE II had a PPV of 12.3% (95% CI 10.3–14.7%) and a NPV of 96.0% (95% CI 93.9–97.5%). The STS/ACC TAVR score achieved a PPV of 18.6% (95% CI 15.0–22.7%) and an NPV of 94.7% (95% CI 93.1–96.0%). Table 4PRE-TAVR predictors (LASSO analysis). Multivariable regression analysis including significant variables from Supplementary Table 2 and cut-off values for predictors using the Youden index. Parameters were initially identified from the LASSO analyses between 1-year TAVR survivors and non-survivors from Table 1 (demographics and comorbidities) and Table 2 (pre-interventional examinations). Predictors that were found to be non-informative were previously excludedOR (95% CI)p-valueCut-off valueAge (years)1.08 (1.04–1.12) < 0.00181.5Heart failure NYHA IV1.95 (1.23–3.09)0.004/COPD ≥ GOLD 22.23 (1.38–3.73)0.001/Cerebral stroke3.05 (1.36–6.85)0.007/Malignant disease2.35 (1.27–4.38)0.007/PAD (≥ stage 2)2.22 (1.27–3.90)0.005/Atrial fibrillation1.71 (1.16–2.53)0.007/CRP (mg/L)1.25 (1.08–1.44)0.0029.5Platelet count (g/L)1.00 (0.99–1.00)0.012228.5ΔPmean (mmHg)0.98 (0.97–1.00)0.01648.5NYHA New York Heart Association, COPD chronic obstructive pulmonary disease, PAD peripheral arterial disease, CRP C-reactive protein, ΔPmean mean aortic valve pressure gradientFig. 2Comparative analysis of the predictive power of different models. ROC curves for survival comparing the PRE-TAVR predictor model in Table 4 (blue curve, AUC 0.770 [95% CI 00.731–0.809]) with the STS/ACC TAVR score (green curve, AUC 0.7139 [95% CI 0.66994–0.75791] and the EuroSCORE II (red curve, AUC 0.645 [95% CI 0.599–0.691])
Validation cohort for predictors of 1-year mortality identified in multiple regression analyses from bivariate comparisons and LASSO analyses
The multiple regression models for parameters from the bivariate comparisons (Table 3) and the LASSO analyses (Table 4), included patients with a documented EuroSCORE II (n = 1410). This patient cohort represents 79.5% of the patient cohort with available 1-year mortality data (n = 1774). To assess the stability and transferability of the model, the remaining 364 patients (20.5%) of this cohort with available 1-year mortality data but without documented EuroSCORE II were used as a validation cohort for the models shown in Tables 3 and 4. Missing data in the validation cohort were imputed. The AUC of the validation cohort (mean of the 20 AUCs across the imputed data sets) for the predictors identified by multiple regression analysis based on bivariate comparisons (Table 3) was 0.771 (95% CI 0.680–0.862). For the predictors identified by multiple regression based on LASSO analyses (Table 4), the AUC was 0.794 (95% CI: 0.699–0.888).
Multivariable regression analysis of parameters from bivariate comparisons and LASSO-analysis between 30-day TAVR survivors and non-survivors
To identify predictors of 30-day mortality, bivariate comparisons were first performed with the variables used in the analyses for 1-year mortality (see Table 1: Demographics and comorbidities and Table 2: Pre-interventional examinations; data not shown). LASSO analyses for 30-day mortality were then performed using the same variables after multiple imputations. For comparison with EuroSCORE II, only patients with complete data sets and documented EuroSCORE II were included in these analyses (n = 1539).
In bivariate comparisons, six variables initially showed significant differences and were subsequently included in a multiple regression model for further analysis (Supplementary Table 3), with NYHA class IV being the only independent significant variable (OR 3.34, 95% CI 1.68–6.66, p = 0.001). In the LASSO analysis, NYHA class IV, age, chronic renal insufficiency, tricuspid valve disease (grade 2/3), sodium, and NT-proBNP before TAVR were included in at least 10 out of 20 models. However, in subsequent multiple regression analyses, only NYHA class IV (p < 0.001), chronic renal failure (p = 0.031) and pre-TAVR sodium (p = 0.035) were significant. The cut-off value determined by the Youden index was 139.5 mmol/l for sodium. For the combined model, the AUC for predicting 30-day mortality was 0.699 (95% CI 0.611–0.788), with the AUC for NYHA class IV alone being 0.623 (95% CI 0.551–0.701). In comparison, the AUC for 30-day mortality for EuroSCORE II is 0.680 (95% CI 0.604–0.756) and for the STS/ACC TAVR score is 0.7129 (95% CI 0.63323–0.79261). Additionally, we assessed the predictive performance of the 30-day mortality models using PPV and NPV. The combined 30-day mortality predictor model of this study achieved a PPV of 4.5% (95% CI 3.1–6.3%) and an NPV of 98.9% (95% CI 98.0–99.5%). For comparison, the EuroSCORE II model showed a PPV of 4.4% and a NPV of 99.4%, the STS/ACC TAVR score achieved a PPV of 4.4% (95% CI 3.1–6.0%) and an NPV of 99.4% (95% CI 98.5–99.8%).
Evaluation of peri-interventional complications and their impact on 1-year and 30-day mortality
The most common peri-interventional complications during the TAVR-procedure were analyzed to assess their impact on 1-year and 30-day mortality. For the correlation of peri-interventional complications and 1-year mortality, the data of all patients with available information on survival status were used, analyzing both, the overall cohort (n = 1774) and a cohort that excluded patients who died within the first 30 days (n = 1726; Supplementary Table 4). In the overall cohort, only weak correlations were observed, with renal failure requiring renal replacement therapy (RRT) (phi = 0.21), extended post-interventional vasopressor therapy (phi = 0.19), pericardial tamponade (phi = 0.16), and cardiopulmonary resuscitation (phi = 0.15) showing the strongest relationships. After excluding patients who died within 30 days, major cerebral stroke (phi = 0.11) and length of hospital stay after the TAVR procedure (r = 0.11) showed the strongest correlations.
For 30-day mortality (Supplementary Table 5) the strongest correlations were observed with renal failure requiring RRT (phi = 0.32), vasopressor therapy for more than 6 h after TAVR (phi = 0.27), cardiopulmonary resuscitation (phi = 0.27), and pericardial tamponade (phi = 0.26).
Discussion
Over the past two decades, recent studies have shown improved survival rates following TAVR procedures [13, 14]. This improvement is partly attributed to factors such as growing interventionist expertise, continuous advancements in prosthetic valve technology, and routine pre-procedural imaging, including screening CT [15]. This remarkable evolution in technical expertise and procedural skills has extended the use of TAVR beyond high-risk patients to intermediate and low-risk patients [1–3]. However, outcomes following TAVR are often limited, particularly in patients with specific pre-existing demographics and relevant comorbidities [16]. Thus, patient selection at the appropriate time and peri-procedural management remain significant challenges for clinicians. In this regard, the utility of commonly used surgical risk scores, such as EuroSCORE II, remains limited [17–19]. While most PRE-TAVR predictors are also included in the EuroSCORE II, its algorithm and factor weighting are primarily tailored to surgical patients undergoing coronary artery bypass grafting (CABG). As a result, first, while the EuroSCORE II is well established, it offers only moderate discrimination in predicting 30-day mortality in TAVR patients and tends to overestimate the risk of mortality [20, 21]. Second, the score is typically assessed well in advance of the procedure, introducing uncertainty when evaluating the patient’s clinical status in the pre-TAVR setting. Third, time-critical bedside use is challenging, as the EuroSCORE II requires the input of multiple parameters into a calculator or algorithm-based model before risk prediction can be applied. Furthermore, the EuroSCORE II includes a relatively large number of variables. As our study cohort lacks information on factors such as pulmonary hypertension, the EuroSCORE II could not be calculated retrospectively for all patients. Following the recognition of the limited performance of EuroSCORE II in TAVR, several modified risk scores have been developed and validated. These are, e.g., the PARTNER risk score, the FRANCE-2 score, the OBSERVANT risk score based on Italian registry data, the ACEF and ACEF-7 scores (which consider age, creatinine levels, and ejection fraction), the VARC-3 criteria and the American College of Cardiology TVT Registry risk model and STS/ACC TAVR score [10, 11, 22–26]. The STS/ACC TAVR score has recently been shown to be superior to other well-established risk scores, despite requiring only a small number of variables [12]. This is why we have also included it in the current study for comparison.
Despite the development of several modified risk scores, which in part already offer improved predictive accuracy compared to the EuroSCORE II, these tools have not been widely adopted in clinical practice. This limited implementation may be due to their inability to fully capture the complex and multifactorial nature of TAVR patients. As a result, there is an increasing recognition that traditional risk scores alone may not be sufficient for guiding clinical decision-making. Laurent et al. even suggest that simple bedside clinical assessments could provide more accurate predictions of outcomes after TAVR, emphasizing the importance of incorporating frailty and quality of life into the risk assessment process [27]. The underlying aspects of this analysis are entirely valid, as they emphasize the long-standing call for timely risk assessment and the need for a more comprehensive approach to the peri-procedural risk evaluation in TAVR [28–30].
The PRE-TAVR predictors identified in this study exhibited statistically significant prognostic superiority over EuroSCORE II, especially in predicting 1-year mortality. This may stem from their ability to consider a broad range of “real-time” parameters, reflecting the current state of the patient, including comorbidities and precisely pre-defined general clinical conditions in close temporal proximity to the TAVR procedure (e.g., NYHA IV, COPD Gold ≥ 2, atrial fibrillation, ΔPmean of the aortic valve ≥ 48.5 mmHg). Additionally, they account for dynamic laboratory markers, such as CRP and platelet count, which reflect the presence of outcome-relevant inflammation, infection, and bleeding risk. Although these factors can be partially addressed prior to intervention, our study does not directly demonstrate that such optimization improves outcomes. The optimal cut-off values identified by the model may reflect cohort-specific patterns and should therefore be interpreted cautiously until validated in independent datasets to ensure generalizability and to minimize the risk of overfitting.
Based on the large and comprehensive data set of the present study, the most significant independent predictor for 30-day mortality was NYHA class IV. This underscores the prognostic impact of pre-existing decompensated heart failure on outcomes and reinforces the importance of early diagnosis and timely decision-making for TAVR [31]. The evaluation of the role of early TAVR in asymptomatic patients with severe aortic stenosis is ongoing, yielding first promising results [4, 32]. Thus, in cases of clinically present decompensation or cardiogenic shock, alternative or staged management strategies should be considered. These may include balloon aortic valvuloplasty and/or Impella support followed by TAVR to optimize hemodynamic stability and transition the patient to a lower-risk profile for improved long-term outcomes been extended in recent years to [33–35].
The relevance of an optimized pre- and peri-procedural management of TAVR patients becomes even clearer when considering peri-procedural complications such as renal failure requiring RRT, the use of vasopressor therapy, cerebral stroke, and a prolonged in-hospital stay, which according to our data were also associated with increased 1-year mortality. Although these pathophysiological findings are well-established and known to correlate with poorer outcomes due to their prognostic value, partially addressed in previous studies, they highlight the complexity of patient profiles in TAVR. This underscores the need for timely pre-interventional assessments with the potential for early intervention of risk factors [16, 36–42].
With the ongoing demographic shift and the increasing complexity of patient populations, there is a growing overall need for more precise and personalized risk assessments in clinical practice. As the demand for efficient decision-making tools rises, there may be an opportunity to integrate predictors like PRE-TAVR into artificial intelligence (AI)-driven systems [43–45]. These tools can enable automated, real-time risk assessments, enhancing clinical decision-making and ensuring timely, individualized care without disrupting clinical workflows.
Conclusions
This study highlights the importance of identifying and optimizing pre- and peri-procedural predictors, which may support improved risk stratification and management in TAVR patients, especially those with relevant comorbidities. Our findings show that PRE-TAVR predictors are more accurate than the EuroSCORE II and the STS/ACC TAVR score at predicting 1-year mortality. Unlike scoring systems, which often oversimplify complex clinical scenarios, the timely application of individualized PRE-TAVR predictors may support more precise patient management. In the future, integrating these validated predictors into clinical decision support systems could allow for more precise risk stratification and improve clinical decision-making.
Limitations
Despite its comprehensive scope, the retrospective design of this study may introduce biases from data collection and patient selection. Due to the specific German healthcare context of the study and the specific heart valve systems used, the transferability of the results may be limited to similar healthcare systems and patient groups. The lack of external validation is an important limitation because it may restrict how generalizable our findings are to other patient populations. Although internal validation using an independent subset of our data produced consistent results, external validation in independent cohorts is necessary to confirm the robustness and broader applicability of our model. Another limitation is that the EuroSCORE II could not be calculated for the entire study population because some cases lacked the necessary variables for the retrospective data analysis. Consequently, direct comparisons between the PRE-TAVR predictors and the EuroSCORE II were limited to this group. This could lead to selection bias and limit the generalizability of our benchmarking results. Future studies should validate and refine these models for real-time clinical use. This requires consideration of the complex interplay of multiple clinical factors following TAVR to ensure robust performance in different patient populations.
Supplementary Information
Below is the link to the electronic supplementary material.ESM 1(DOCX 33.7 KB)
The reference list from the paper itself. Each links out to its DOI / PubMed record.
- 1Nashef SAM, Roques F, Sharples LD, et al (2012) Euro SCORE II. Eur J Cardiothorac Surg. discussion 41(4):734–744;744–745. 10.1093/ejcts/ezs 04310.1093/ejcts/ezs 04322378855 · doi ↗ · pubmed ↗
- 2Halkin A, Steinvil A, Witberg G, et al (2016) Mortality prediction following transcatheter aortic valve replacement: a quantitative comparison of risk scores derived from populations treated with either surgical or percutaneous aortic valve replacement. The Israeli TAVR Registry Risk Model Accuracy Assessment (IRRMA) study. Int J Cardiol 215:227-231. 10.1016/j.ijcard.2016.04.03810.1016/j.ijcard.2016.04.03827128536 · doi ↗ · pubmed ↗
- 3B I, C L, D H, et al. Predictive factors of early mortality after transcatheter aortic valve implantation: individual risk assessment using a simple score. Heart (British Cardiac Society). 2014;100(13). 10.1136/heartjnl-2013-30531410.1136/heartjnl-2013-30531424740804 · doi ↗ · pubmed ↗
- 4VARC-3 WRITING COMMITTEE:, Généreux P, Piazza N, et al (2021) Valve Academic Research Consortium 3: updated endpoint definitions for aortic valve clinical research. J Am Coll Cardiol. 77(21):2717–2746. 10.1016/j.jacc.2021.02.03810.1016/j.jacc.2021.02.03833888385 · doi ↗ · pubmed ↗
- 5Généreux P, Schwartz A, Oldemeyer JB, et al (2024) Transcatheter aortic-valve replacement for asymptomatic severe aortic stenosis. N Engl J Med. Published online. 10.1056/NEJ Moa 240588010.1056/NEJ Moa 240588039466903 · doi ↗ · pubmed ↗
- 6Jabri A, Ayyad M, Albandak M, et al (2024) Outcomes following TAVR in patients with cardiogenic shock: a systematic review and meta-analysis. Cardiovasc Revasc Med. Published online. S 1553–8389(24)00622–5. 10.1016/j.carrev.2024.08.00210.1016/j.carrev.2024.08.00239209579 · doi ↗ · pubmed ↗