Low-flow in aortic valve stenosis patients with reduced ejection fraction does not depend on left ventricular function
Svante Gersch, Torben Lange, Bo Eric Beuthner, Manar Elkenani, Niels Paul, Moritz Schnelle, Elisabeth Zeisberg, Miriam Puls, Gerd Hasenfuß, Andreas Schuster, Karl Toischer

TL;DR
The study finds that low transaortic gradient in aortic stenosis patients with reduced heart function is not due to left ventricular issues but other heart problems like mitral regurgitation or atrial fibrillation.
Contribution
The study shows that low-flow severe aortic stenosis is not caused by left ventricular dysfunction or gene expression changes but by additional cardiac pathologies.
Findings
High-gradient and low-gradient AS subgroups had similar left ventricular ejection fraction, mass, and diameter.
Myocardial fibrosis and gene expression patterns were not different between high-gradient and low-gradient AS subgroups.
Low-gradient AS was associated with more mitral regurgitation, atrial fibrillation, and right ventricular dysfunction, which may explain higher mortality.
Abstract
Patients with severe aortic stenosis (AS) and reduced left ventricular ejection fraction (LVEF) can be distinguished into high- (HG) and low-gradient (LG) subgroups. However, less is known about their characteristics and underlying (pathophysiological) hemodynamic mechanisms. 98 AS patients with reduced LVEF were included. Subgroup characteristics were analyzed by a multimodal approach using clinical and histological data, next-generation sequencing (NGS) and applying echocardiography as well as cardiovascular magnetic resonance (CMR) imaging. Biopsy samples were analyzed with respect to fibrosis and mRNA expression profiles. 40 patients were classified as HG-AS and 58 patients as LG-AS. Severity of AS was comparable between the subgroups. Comparison of both subgroups revealed no differences in LVEF (p = 0.1), LV mass (p = 0.6) or end-diastolic LV diameter (p = 0.12). Neither…
Genes, proteins, chemicals, diseases, species, mutations and cell lines named across the full text — each resolved to its canonical identifier and authoritative record.
Click any figure to enlarge with its caption.
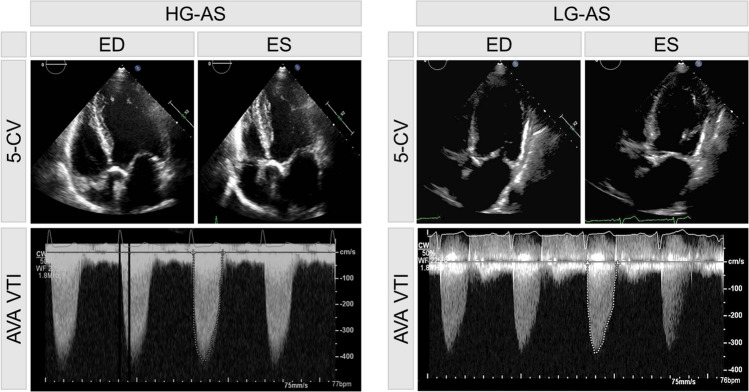 Figure 1
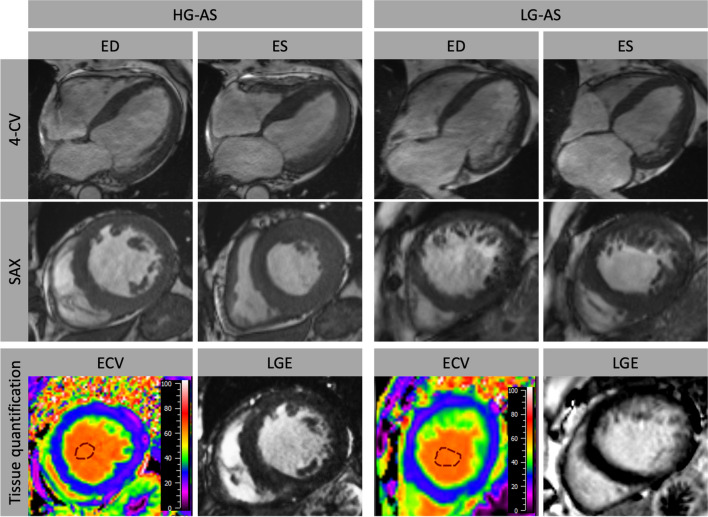 Figure 2
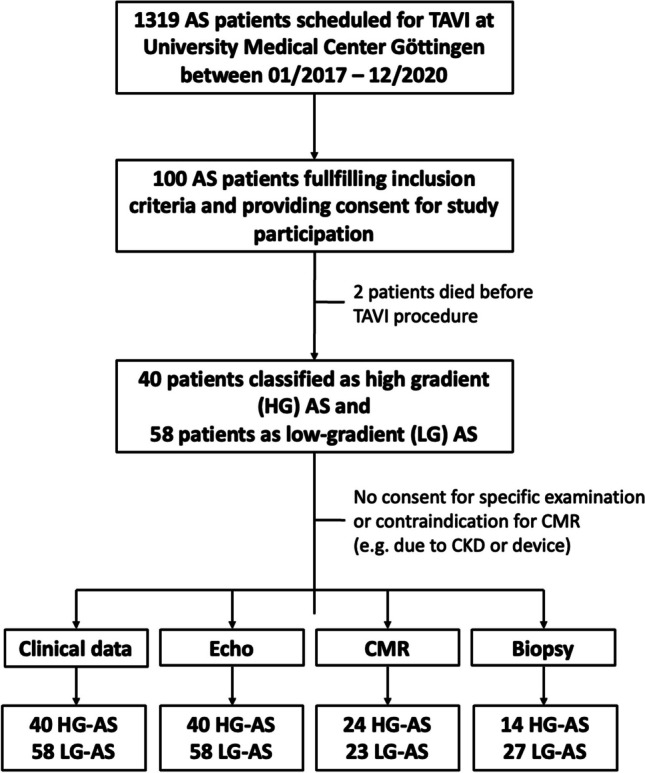 Figure 3
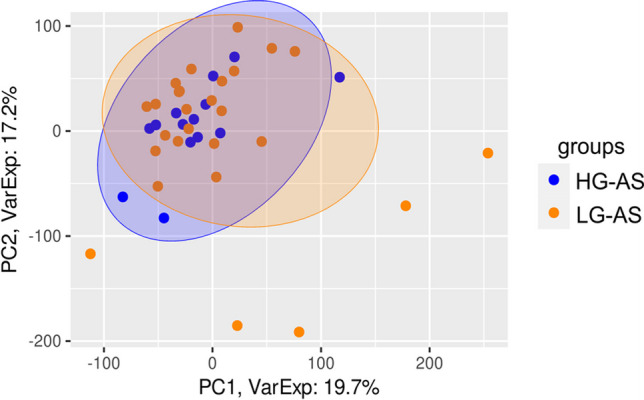 Figure 4
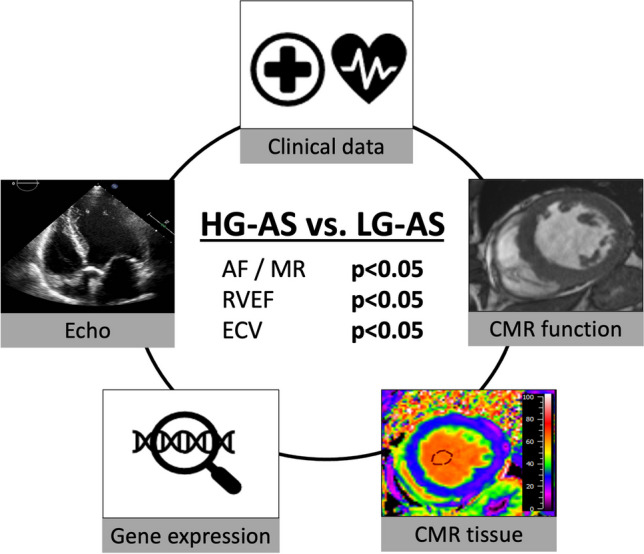 Figure 5
- —http://dx.doi.org/10.13039/501100001659Deutsche Forschungsgemeinschaft
- —Herzzentrum Göttingen (1018)
Peer Reviews
No public reviews on file for this paper yet. If you reviewed it on a platform where reviews are public (OpenReview, ICLR, NeurIPS, ICML), you can paste yours below so the community can read it here.
Videos
No videos yet. Explain this paper in a talk, walkthrough, or lecture? Add one.
Taxonomy
TopicsCardiac Valve Diseases and Treatments · Infective Endocarditis Diagnosis and Management · Coronary Interventions and Diagnostics
Introduction
Aortic stenosis (AS) is the most prevalent valve disease in the ageing society [1, 2]. Severe AS occurs in 3–5% of individuals over 75 years and is associated with a high burden of morbidity and mortality [3, 4]. AS patients with reduced left ventricular ejection fraction (LVEF) can be subdivided in two groups: 1) AS with reduced LVEF and high transaortic gradient (Vmax > 4.0 m/s or PGmean > 40 mmHg; HG-AS) and 2) AS with reduced LVEF and low gradient (Vmax < 4.0 m/s or PGmean < 40 mmHg; LG-AS).
With evolving evidence, transcatheter aortic valve implantation (TAVI) has become an established treatment method of severe AS during the past decade. While current guideline clearly recommend AVR in symptomatic patients with HG-AS irrespectively from LVEF, diagnosis and treatment of LG-AS is challenging and an extended multimodal diagnostic approach is suggested in order to achieve diagnostic certainty [5]. Importantly, in a previous study, increased myocardial fibrosis (MF) in these subgroups was shown to be associated with poor outcome [6]. Moreover, LG-AS has been demonstrated to be associated with worse prognosis compared to HG-AS even after aortic valve replacement [7, 8]. However, data on HG- and LG-AS phenotypes are scarce and potential underlying hemodynamic mechanisms remain unclear.
Therefore, the aim of this study was to characterize and compare patients with HG-AS and LG-AS in a multimodal approach using clinical data, echocardiography, cardiac magnetic resonance (CMR) imaging, histology and next-generation- sequencing (NGS) for a more in-depth understanding of these heterogenous AS subgroups.
Methods
Data for this study were gathered at the University Medical Center Göttingen. Patients were classified into a HG and a LG group according to their transvalvular gradient in echocardiography. According to current guideline recommendations HG-AS was defined as a transvalvular gradient > 40 mmHg or a peak aortic jet velocity Vmax > 4 m/s and an aortic valve area (AVA) < 1 cm^2^ and LG-AS with a gradient < 40 mmHg and an AVA < 1 cm^2^, SVI < 35 ml/m^2^. In LG-AS group a pseudo stenosis was ruled out either calcium scoring in computed tomography and/or by stress test. On admission, transthoracic echocardiography was performed, a 6-min walk test, Minnesota Living with Heart failure Quality of life questionnaire (MLHFQ), New York Heart Association (NYHA) status, and N-terminal pro-brain natriuretic peptide (NT-proBNP) levels were measured. Decision for TAVI was based on an interdisciplinary heart team decision according to current guideline recommendations. Additionally, PICP and the CITP:MMP1 ratio, which serves as an indicator of irreversible myocardial fibrosis through collagen cross-linking, was analyzed. A low CITP:MMP1 ratio indicates a presence of irreversible collagen deposition, while a high ratio suggests the possibility of reversible collagen formation [9]. This analysis was conducted using an ELISA-based assay for CITP (Orion Diagnostica, Espoo, Finland) and an alphaLISA method to quantify total serum MMP-1 levels (PerkinElmer, Waltham, Massachusetts, USA) as previously described [10, 11].
The study complied with the Principles of Helsinki and was approved by the local Ethics Committee Göttingen. All patients gave written informed before study participation.
Echocardiography
As previously described [6], all echocardiographies were performed pre-TAVI and were obtained as recommended [12]. Transvalvular pressure gradient was measured by continuity equation and stroke volume (SV) was computed with pulse wave Doppler signal from apical five-chamber view (Fig. 1). SV was then indexed to body surface area (BSA).Fig. 1. Echocardiographic images of patient with high-gradient (HG) and low-gradient (LG) aortic stenosis (AS), respectively. Pictures in the top showing a 5-chamber view (5-CV) in end-diastole (ED) and end-systole (ES). The corresponding derived aortic valve area velocity time integral (AVA VTI) signal is shown below
LVEF was calculated by Simpson’s biplane method using the manual tracing of the outline of the endocardial border on apical four and apical two-chamber view. To calculate relative wall thickness the formula (2 × posterior wall thickness/LVEDD) was used. Peak pulmonary artery systolic pressure was calculated using peak tricuspid regurgitation velocity (+ right atrial pressure). In order to validate echocardiographic findings of the study cohort, additional analyses of echocardiographic data obtained from a large clinical all-comer cohort were performed.
Next generation sequencing
The alignment, normalization and analysis of the RNA-seq data were performed using the RStudio IDE with R version 4.2.2. The raw.fastq files were aligned to the GRCh38 genome using the align function in the Rsubread R package [13]. Only uniquely mapped reads were taken into account. The Rsubread function featureCounts was used to summarize aligned reads to features of the gene annotation file taken from GenCode (Release 40) [14, 15]. After adding a pseudocount of 1 to all features the expression profiles were normalized to GeTMM values [16]. The functions lmFit and eBayes from the limma package were used to check for differentially expressed genes [17, 18].
Histology
After TAVI procedure, tissue samples were harvested from the basal anteroseptum in the left ventricle using biopsy forceps (Proflex-Bioptom 7F). These samples were then fixed in 10% paraformaldehyde and embedded in paraffin for further analysis. MF was evaluated in a blinded manner, using quantitative morphometry through Olympus Software cell-Sens 1.6. It was defined as the proportion of blue-stained area, indicating collagen presence, in sections of biopsy samples stained with Masson's trichrome. This proportion was determined by comparing the blue-stained area to the total tissue area.
Cardiovascular magnetic resonance imaging
CMR Imaging protocol
CMR imaging was performed on a 3.0-Tesla Magnetom Skyra MRI scanner (Siemens Healthcare, Erlangen, Germany) using a 32-channel cardiac surface receiver coil. Electrocardiography-gated balanced steady state free precession (b-SSFP) images of long-axis two, three- and four-chamber views (2-, 3-, 4-CV) as well as short-axis (SAX) stacks were acquired for functional myocardial assessments with the following typical image parameters: 25 frames per cardiac cycle, time of echo (TE) 1.5 ms, time of repetition (TR) 55 ms, flip angle 55°, 7 mm slice thickness with 7.7 mm inter-slice gap. Conventional 5(3)3 Modified Look-Locker Inversion Recovery (MOLLI) sequences (FOV of 360 × 306.6mm^2^, in-plane resolution 1.41 × 1.41 x 8mm^3^, TR 280 ms, TE 1.12 ms, TI 180 ms, flip angle 35°, bandwidth 1085 Hz/pixel with total acquisition of 11 heart beats) for T1-mapping were performed ahead of admission of a gadolinium contrast bolus (0.15 mmol/kg bodyweight) and 20 min after. Phase-sensitive inversion-recovery-gradient echo sequences were acquired for late gadolinium enhancement (LGE) analyses 15–20 min after the gadolinium bolus injection with the following typical imaging parameters: TR 700 ms; TE 1.24 ms; flip angle 40°; slice thickness 7 mm and individually adjusted inversion times typically between 300 and 400 ms) (Fig. 2).Fig. 2. Cardiovascular magnetic resonance imaging in patients with high-gradient (HG) and low-gradient (LG) aortic stenosis (AS). Myocardial function was analyzed in long-axis orientation including 4-chamber view (CV) as well as short-axis (SAX) orientation. Furthermore, tissue characterization comprising calculation of extracellular volume (ECV%) and late gadolinium enhancement (LGE) was performed. ED: end-diastole; ES: end-systole
CMR image analysis
Based on b-SSFP images strain assessments were performed applying dedicated CMR-feature tracking (CMR-FT) evaluation software (Medis Medical Imaging Systems, Leiden, The Netherlands). Epi- and endocardial borders were manually delineated at end-diastole and -systole in 2-, 3- and 4-CV long axis orientations to analyze global longitudinal strain (GLS). Likewise, atrial endocardial contours were delineated in 2- and 4-CV images for the quantification of LA reservoir (LA Es), conduit (LA Ee) and booster pump strain (LA Ea) as described elsewhere [19]. For ventricular volumetric analyses epi- and endocardial borders were manually delineated in SAX stacks covering the entire LV. T1-mapping based assessment of extracellular volume (ECV%) reflecting myocardial tissue that is not occupied by cells was conducted based on motion-corrected MOLLI sequences. The definition of ECV% was as follows: ECV% = (1 – hematocrit) * [Δ R1 myocardium]/ [ Δ R1 blood] according to guideline recommendations [20]. In all T1 weighted images regions of interest were drawn in excluding any LGE areas and careful visual reevaluation of the delineated regions was performed to avoid partial volume effects due to blood pool or adjacent non-myocardial structures [21]. Using SAX images of inversion recovery sequences, LGE analyses were performed by defining a 3 standard deviations (SD) threshold of signal intensity for the detection of ischemic and non-ischemic LGE enhancement after manual epi- and endocardial border delineation as previously established [22].
Statistical analysis
Statistical analysis was performed in Graph Pad prism version 9.0. Continuous variables are presented as mean ± standard deviation. Categorial data were presented as frequency and percentage. Variables were tested for normal distribution by Shapiro-Wilk test. Subgroups were compared by two-sided T-test, one-way analysis of variance or Mann-Whitney-U test, if appropriate. For categorical variables, differences between HG- and LG-group were evaluated by Fisher exact test. A p-value of < 0.05 was considered statistically significant.
Results
Baseline characteristics
98 patients with severe AS and impaired left ventricular systolic function, who were scheduled for TAVI at the University Medical Center Göttingen between January 2017 and December 2020 were included to this study (Fig. 3). 40 patients were classified as HG-AS and 58 patients as LG-AS (pseudo stenosis was ruled out either by stress test or calcium score imaging). The mean age of the overall study population was 79.3 (± 6.8) years and participants were predominantly male (75%). Cardiovascular risk factors such as dyslipidemia, arterial hypertension, and diabetes mellitus were present in most of the patients (Table 1). On admission, majority of the patients showed signs of cardiac decompensation coming along with severe symptoms (NYHA III or IV). LG-AS patients showed no significant difference for chronic coronary syndrome (HG: 65% vs. LG: 77.6%; p = 0.24), but more prior coronary interventions (HG: 17.5% vs. LG: 44.8%; p = 0.005) or coronary artery bypass graft (CABG) (HG: 2.5% vs. LG: 22.4%; p = 0.007). Furthermore, atrial fibrillation (AF) occurred more frequently in LG-AS patients (HG: 30% vs. LG: 51.7%; p = 0.03), which also correlated with an increased rate of AF on admission (HG: 12.5% vs. 41%; p = 0.0029) (Table 2). Neither NT-proBNP (HG: 8707 ± 9109 ng/L vs. LG: 9460 ± 14228 ng/L; p = 0.3) nor the 6MWT-distances differed significantly between the two subgroups. (HG: 197.9 ± 130.8 m vs. LG: 189.9 ± 118 m; p = 0.77). A more detailed overview of patient characteristics is presented in Table 1.Fig. 3. Study flow chartTable 1Baseline clinical characteristics ParametersHG-AS (n = 40)LG-AS (n = 58)p-valueAge (years)79 ± 7.679.6 ± 6.10.804Female (n)13 (32.5)11 (18.9)0.154BMI (kg/m^2^)26.2 ± 4.927.3 ± 5.40.446BSA (m^2^)1.94 ± 0.21.94 ± 0.20.896NYHA I1 (2.5)0 (-)0.408NYHA II13 (32.5)11 (18.9)0.154NYHA III21 (52.5)37 (63.7)0.3NYHA IV5 (12.5)10 (17.2)0.581Syncope7 (17.5)7 (12.0)0.45Signs of cardiac decompensation at admission (n)24 (60)38 (65.5)0.671Cardiac decompensation last 4 weeks (n)14 (35)26 (44.8)0.404Cardiac decompensation last 6 months (n)4 (10)15 (25.8)0.069MLHFQ (points)33.2 ± 15.938.5 ± 15.20.111Systolic blood pressure (mmHg)121 ± 16.4120 ± 150.920Diastolic blood pressure (mmHg)69 ± 12.366 ± 9.50.171Heart rate (1/min)72 ± 12.973 ± 9.50.432EuroScore 2 (points)5.0 ± 3.410.6 ± 10.30.0002Comobordities Diabetes mellitus (n)13 (32.5)26 (44.8)0.294 Arterial hypertension (n)32 (80)52 (89.6)0.242 Dyslipidemia (n)23 (57.5)36 (62)0.679 Smoker (n)3 (7.5)10 (17.2)0.229 Chronic coronary syndrome (n)26 (65)45 (77.5)0.25 Prior myocardial infarction (n)8 (20)18 (31)0.253 Atrial fibrillation / flutter (n)12 (30)30 (51.7)0.039 Prior PCI (n)7 (17.5)26 (44.8)0.005 Prior CABG (n)1 (2.5)13 (22.4)0.007 Aortic valve replacement (n)0 (-)1 (1.7) > 0.999 TAVI (n)0 (-)2 (3.4) > 0.999 Pacemaker / ICD (n)6 (15)15 (25.8)0.222 Peripheral vascular disease (n)3 (7.5)15 (25.8)0.032 eAVK (n)6 (15)22 (37.9)0.022 Prior cerebral ischaemia event (n)4 (10)12 (20.6)0.179 COPD (n)2 (5)12 (20.6)0.039 CHA_2_DS_2_-VASc-Score (points)5 ± 1.25.5 ± 1.30.065 6-min walk test, (meters)197.9 ± 130.8189.9 ± 1180.767Medication Angiotensin converting enzyme inhibitor (n)21 (52.5)26 (44)0.539 Angiotensin II receptor antagonist (n)7 (17.5)14 (24.1)0.465 Sacubitril/Valsartan (n)1 (2.5)5 (8.6)0.396 Betablocker (n)27 (67.5)41 (70.6)0.8 Aldosterone antagonist (n)13 (32.5)18 (31.0) > 0.999 Loop diuretic (n)23 (57.5)42 (72.4)0.135 Thiazide (n)9 (22.5)11 (18.9)0.799 Amiodarone (n)1 (2.5)3 (5.1)0.643 Statine (n)24 (60)38 (65.5)0.671 Aspirin (n)22 (55)34 (58.6)0.836 Vitamin K antagonist (n)6 (15)13 (22.4)0.441 NOAC (n)5 (12.5)10 (17.2)0.581Laboratory Haemoglobin (g/dl)12.5 ± 1.712.5 ± 2.010.9 NT-proBNP (ng/L)8707 ± 91099460 ± 14,2280.3 Creatinine (mg/dl)1.22 ± 0.781.49 ± 1.290.004 MDRD (ml/min/1.73 m^2^)62.5 ± 19.254.7 ± 22.10.1Baseline characteristics of the study cohort. Continuous variables are expressed as mean ± standard deviation, categorical data are represented as frequency and percentage. Differences between both groups were tested with two-sided t-test or Mann-Whitney-U testBMI body mass index, BSA body surface area, CABG coronary artery bypass graft, COPD chronic obstructive pulmonary disease, MDRD modification of diet in renal disease, ICD implantable cardioverter defibrillator, MLHFQ Minnesota living with heart failure questionnaire, NOAC non-vitamin K antagonist anticoagulant, NT-proBNP B-type natriuretic peptide, NYHA New York Heart Association, PCI percutaneous coronary intervention, TAVI transcatheter aortic valve implantationTable 2ECG characteristicsParametersHG-AS (n = 40)LG-AS (n = 56)p-valueQRS duration120 ± 35127 ± 310.3Sinusrhythm at admission31 (77.5)27 (48)0.006AF/-flutter at admission5 (12.5)23 (41)0.003RBBB3 (7.5)10 (18)0.22LBBB3 (7.5)9 (16)0.35Intraventricular (non-LBBB, non-RBBB)11 (27.5)10 (18)0.32ECG parameters of the study cohort. Continuous variables are expressed as mean ± standard deviation, categorical data are represented as frequency and percentageAF atrial fibrillation, LBBB left bundle branch block, RBBB right bundle branch block
Severity of AS and left ventricular geometry
Echocardiographic characteristics are presented in Table 3. AVA was slightly smaller in HG-patients compared to LG-patients. There was no difference in LVEF (HG: 37 ± 9.7% vs. LG: 33.9 ± 9.2%; p = 0.1), LVEDD (HG: 51 ± 8.7 mm vs. LG: 54 ± 7.9 mm, p = 0.12), relative wall thickness (HG: 0.54 ± 0.16 vs. LG: 0.48 ± 0.12, p = 0.25) or LVMI (HG: 170 ± 36.5 g/m^2^ BSA vs. LG: 166.8 ± 41.4 g/m^2^ BSA; p = 0.61). Similar results were found in CMR analyses of these patients (Table 4). These echocardiographic findings were consistent in the additionally analyzed all-comer cohort (Suppl. Table 1). Table 3. Echocardiographic characteristicsHG-AS(n = 39)LG-AS(n = 58)(p-value)BSA (m^2^)1.9 ± 0.21.9 ± 0.20.99LVEF nS (%)37 ± 1033.9 ± 90.10LVEDV (ml)119 ± 39122 ± 460.71LVESV (ml)76 ± 3383 ± 400.39SVI mD (ml/m^2^ BSA)34.4 ± 8.428.6 ± 6.90.0007LVEDD (mm)51 ± 8.754 ± 7.90.12LVESD (mm)42 ± 9.045 ± 7.90.13IVS (mm)15 ± 2.114 ± 2.70.03PWT (mm)13 ± 2.413 ± 2.40.15LVMI (g/m^2^ BSA)170 ± 36166 ± 410.61RWT0.54 ± 0.160.48 ± 0.120.25Vmax (m/s)4.4 ± 0.43.2 ± 0.4< 0.0001PGmean (mmHg)47 ± 924 ± 6< 0.0001Aortic valve area (cm^2^)0.61 ± 0.20.7 ± 0.20.0001LAVI (ml/m^2^ BSA)54.7 ± 1853 ± 170.83TAPSE (mm)20.2 ± 5.017.3 ± 3.70.0019PAP systolic (mmHg)52 ± 1647 ± 120.13AR I (n)19 (49)25 (43)0.53AR II (n)16 (41)170.28AR III (n)0 (0)0 (0)> 0.999MR I (n)21 (54)17 (29.3)0.02MR II (n)15 (38)27 (47)0.4MR III (n)3 (8)14 (24)< 0.0001TR I (n)22 (56)30 (52)0.68TR II (n)11 (28)20 (34)0.65TR III (n)2 (5)5 (9)0.69Stroke volume (ml)66 ± 14.955.6 ± 15.10.001Duration of the flow (ms)0.35 ± 0.030.33 ± 0.030.004Mitral regurgitation volume (ml)26.7 ± 11.332.1 ± 17.60.2SV/ duration of the flow (ml/ms)186 ± 44165 ± 420.027SV/ mitral regurgitation volume2.7 ± 1.12.2 ± 1.20.12SV/ mitral regurgitation volume2.7 ± 1.12.2 ± 1.20.12Cardiac output (ml/min)4.7 ± 1.24.0 ± 1.30.16Echocardiographic parameters of the study cohort. Continuous variables are expressed as mean ± standard deviation; categorical data are represented as frequency and percentageAR aortic regurgitation, BSA body surface area, LVEF left ventricular ejection fraction, IVS intraventricular septum, LAVI left atrial volume index, LVEDD left ventricular end-diastolic diameter, LVEDV left ventricular end-diastolic volume, LVESD left ventricular end-systolic diameter, LVESV left ventricular end-systolic volume, LVMI left ventricular mass index, MIR mitral regurgitation, PWT posterior wall thickness, RWT relative wall thickness, SV stroke volume, SVI stroke volume index, TAPSE tricuspid annular plane systolic excursion, TR tricuspid regurgitationTable 4CMR characteristicsParameterHG-AS(24)LG-AS(23)p-valueniLGE volume (ml/ml^2^)8.9 (5.4–14.9)7.0 (2.7–13.7)0.31iLGE volume (ml/ml^2^)0.0 (0.0–4.0)0.0 (0.0–7.2)0.84Total LGE volume (ml/ml^2^)13.2 (7.7–19.3)7.5 (4.9–21.3)0.35ECV% (%)25.8 (24.4–26.9)27.1 (26.2–29.6)0.012LV matrix volume (ml/ml^2^)21.5 (18.0–26.3)22.1 (17.7–25.8)0.88LV cellular volume (ml/ml^2^)65.2 (55.8–75.4)53.3 (46.0–68.1)0.16Total LVMV (ml/ml^2^)105.0 (90.1–117.8)90.5 (76.1–109.6)0.15LVEDVi (ml/ml^2^)101.5 (91.5–128.5)105.3 (80.9–132.9)0.8LVESVi (ml/ml^2^)58.1 (44.9–77.2)68.2 (40.7–90.1)0.87LVSVi (ml/ml^2^)50.4 (37.5–54.9)40.7 (34.7–48.7)0.03RV volume (ml/ml^2^)20.8 (16.7–29.8)22.2 (18.1–26.5)0.9RVEDVi (ml/ml^2^)72.5 (59.7–88.4)73.3 (58.5–89.4)0.98RVESVi (ml/ml^2^)35.6 (22.4–50.1)41.3 (31.7–56.5)0.31RVSVi (ml/ml^2^)36.7 (30.1–43.6)31.1 (24.7–35.8)0.045GLS (%)-15.6 (-12.6- -17.5)-13.4 (-9.7- -18.3)0.43GLS TTP (ms)373.4 (345.3–426.8)370.4 (352.5–400.0)0.83GCS (%)-26.7 (-18.0- -34.6)-20.9 (-14.8- -26.3)0.19GRS (%)40.1 (26.1–51.1)39.4 (31.4–50.4)0.87RV GLS (%)-23.3 (-15.8- -29.7)-23.0 (-15.5- -26.2)0.47LA Es (%)11.2 (7.8–16.6)8.7 (6.9–12.7)0.21LA Ee (%)4.4 (2.7–6.0)3.8 (1.3–6.6)0.67LA Ea (%)7.4 (4.5–9.4)5.4 (3.9–9.5)0.46RVEF (%)49.1 (38.1–62.4)43.7 (32.2–50.8)0.023LVEF (%)43.5 (37.3–53.1)38.0 (28.4–48.1)0.17RA Es (%)12.8 (10.1–17.4)12.7 (8.0–14.3)0.33RA Ee (%)6.1 (2.5–9.0)4.8 (2.0–5.9)0.14RA Ea (%)8.5 (5.8–11.5)7.0 (4.2–9.3)0.33CMR PCWP16.5 (14.5–21.1)19.0 (16.0–21.4)0.32CMR imaging-derived parameters. Variables are presented as median (interquartile range). Values of high-gradient (HG) and low-gradient (LG) aortic stenosis (AS) patients were compared using Mann-Whitney-U test. P-values in bold indicate a statistical significanceCMR PCWP pulmonary capillary wedge pressure (CMR-derived), ECV% extracellular volume fraction, GCS global circumferential strain, GLS global longitudinal strain, GLS TTP global longitudinal strain time to peak, GRS global radial strain, iLGE ischemic late-gadolinium-enhancement, LA Ea left atrial boosterpump strain, LA Ee left atrial conduit strain, LA Es left atrial reservoir strain, LGE late gadolinium enhancement, LVEF left ventricular ejection fraction, LVEDVi left ventricular end-diastolic volume index, LVESVi left ventricular end-systolic volume index, LVSVi left ventricular stroke volume index, niLGE non-ischemic late gadolinium enhancement, RA Ea right atrial boosterpump strain, RA Ee right atrial conduit strain, RA Es right atrial reservoir strain, RVEDVi right ventricular end-diastolic volume index, RVEF right ventricular ejection fraction, RV GLS right ventricular global longitudinal strain, RVESVi right ventricular end-systolic volume index
The lower stroke volume (HG: 66 ± 14.9 ml vs. LG: 55.6 ± 15.1 ml; p = 0.001) in LG-AS patients, however, could be explained by a shorter flow duration via the stenosed aortic valve (HG: 0.35 vs. LG: 0.33; p = 0.004). This indicates that despite comparable LVEF and LVEDD the left ventricle cannot generate the same pressure time integral. Characterization of the LV by CMR did not show a difference in left ventricular strain or volumes, while ECV% was significantly higher in LG-AS compared to HG-AS patients (27.1% [26.2–29.6] vs. 25.8 [24.4–26.9], p = 0.012) (Table 4). After splitting the two groups according to LVEF below and above 35%, there was an even distribution of valve insufficiencies and left ventricular geometry in the respective subgroups compared to the corresponding group (Table 5). Table 5. Echocardiographic characteristics classified according to LVEFHG-AS, EF > 35%(n = 28)HG-AS, EF < 35%(n = 11)LG-AS, EF > 35%(n = 29)LG-AS, EF < 35%(n = 29)p-valueBSA (m^2^)1.9 ± 0.232.0 ± 0.241.9 ± 0.231.9 ± 0.210.17LVEF nS (%)42 ± 524 ± 6 (a)42 ± 4.026 ± 5 (d) < 0.001LVEDV (ml)106 ± 36153 ± 32 (a)100 ± 27144 ± 50 (d) < 0.001LVESV (ml)61 ± 23.3116 ± 26 (a)58 ± 18107 ± 40 (d) < 0.001SVI mD (ml/m2 BSA)36.8 ± 7.129.5 ± 5.8 (a)27.4 ± 6.429.7 ± 7.1 < 0.001LVEDD (mm)48.5 ± 759.8 ± 5 (a)51.2 ± 757.1 ± 7 (d)< 0.001 LVESD (mm)38.7 ± 652.3 ± 6 (a)41.7 ± 748.6 ± 7 (d) < 0.001IVS (mm)16.1 ± 2.215.0 1.914.7 ± 3.114.5 ± 2.20.09PWT (mm)13.9 ± 2.012.4 ± 2.412.6 ± 2.212.9 ± 2.50.16LVMI (g/m^2^ BSA)165 ± 35189 ± 28154 ± 33179 ± 440.026Vmax (m/s)4.52 ± 0.334.2 ± 0.23.1 ± 0.38 (b)3.3 ± 0.46 (c) < 0.001Pmean (mmHg)49 ± 8.344 ± 3.422.6 ± 5.89 (b)26.4 ± 6.8 (c) < 0.001Aortic valve area (cm2)0.63 ± 0.170.58 ± 0.100.7 ± 0.150.77 ± 0.16 (c)0.001LAVI (ml/m2 BSA)52.3 ± 16.361.4 ± 22.551.1 ± 13.557.0 ± 19.90.34TAPSE (mm)21.1 ± 4.917.7 ± 4.317.5 ± 4.2 (c)17.0 ± 3.00.032MR III3 (10)07 (29)7 (29)0.47PAP systolic (mmHg)49 ± 14.962 ± 14.447 ± 10.648 ± 14.20.055Regurgitation volume (mitral) (ml)28.1 ± 11.922.4 ± 7.932.7 ± 15.331.7 ± 19.10.6Stroke volume (ml)67 ± 1462 ± 15.153 ± 15.858 ± 130.006Duration of the flow (ms)0.36 ± 0.030.36 ± 0.030.33 ± 0.030.33 ± 0.030.043SV/ duration of the flow (ml/ms)190 ± 43174 ± 45.1158 ± 43.6174 ± 390.053SV/ mitral regurgitation volume2.7 ± 1.12.5 ± 0.82.0 ± 1.02.4 1.10.38Cardiac output3.9 ± 1.24.9 ± 1.73.9 ± 1.24.2 ± 1.20.07a) HG > 35% vs. HG < 35%; b) HG > 35% vs. LG > 35%; c) HG < 35% vs. LG < 35%; d)LG > 35% vs. LG < 35%Echocardiographic parameter, classified according to LVEF above and below 35%. Continuous variables are expressed as mean ± standard deviation. categorical data are represented as frequency and percentageBSA body surface area, LVEF left-ventricular ejection fraction, IVS intraventricular septum, LAVI left atrial volume index, LVEDD left ventricular end-diastolic diameter, LVEDV left ventricular end-diastolic volume, LVESD left ventricular end-systolic diameter, LVESV left ventricular end-systolic volume, LVMI left ventricular mass index, MR mitral regurgitation, PWT posterior wall thickness, RWT relative wall thickness, SV stroke volume, SVI stroke volume index, TAPSE tricuspid annular plane systolic excursion
Notably, a higher prevalence of severe mitral regurgitation (HG: 8% vs. LG: 24%; p < 0.001) and an impaired right ventricular dysfunction (RVSVi: 36.7 vs. 31.1 ml/m2; p = 0.045; TAPSE: 20.2 vs. 17.3 mm, p = 0.002) were detected in the LG-group. Furthermore, impaired hemodynamics especially affecting the right heart might be additionally indicated by regional differences in LV strain. Comparing septal vs. lateral GLS within each group revealed a significantly reduced septal GLS in the LG group (septal GLS -8.2% vs. lateral GLS -12.7%, p = 0.008), which might be caused by raised loading pressures in the right ventricle hampering septal contractility (Table 6). In the HG group there was no difference between septal and lateral GLS (septal GLS -11.4% vs. lateral GLS -12.0%, p = 0.22). Table 6. Comparison of septal and lateral global longitudinal strainSeptalLateralp-valueHG-AS GLS−11.4%−12.0%0.22HG-AS GLS TTP397 ms385 ms0.03LG-AS GLS−8.2%−12.7%0.008LG-AS GLS TTP366 ms369 ms0.49HG-ASLG-ASp-valueSeptal GLS−11.4%−8.2%0.32Septal GLS TTP397 ms366 ms0.27Lateral GLS−12.0%−12.7%0.63Lateral GLS TTP385 ms369 ms0.33AS aortic stenosis, HG high-gradient, GLS global longitudinal strain, LG low-gradient, TTP time to peak
Histology or next-generation sequencing did not show a difference in fibrosis nor global gene expression profile (Fig. 4) between HG- and LG-AS patients. Furthermore, neither PITP-levels (HG: 151 ± 33% vs. LG: 144 ± 40%; p = 0.58), nor CITP (HG: 10.8 ± 9.5% vs. LG: 12.3 ± 11.9%; p = 0.65) and CIPT/MMP1-ratio differed significantly (HG: 2.6 ± 2.2% vs. LG: 3.2 ± 3.1%; p = 0.46). Furthermore, CMR-derived PCWP did not differ between both groups (16.5 [14.5–21.1] vs. 19.0 [16.0–21.4], p = 0.32) suggesting no difference in preload induced contractile activation according to the Frank-Starling-mechanism.Fig. 4. Principal component analysis (PCA) was employed to depict single LV biopsy samples obtained from individual patients. Each circle within the plot represents the projection of data from individual patient samples onto components 1 and 2, along with the percentage of total variance (x/y axis legend). Each patient's dataset is represented by two technical replicates and any outlier replicates have been excluded. (14 HG-AS and 27 LG-AS)
Discussion
This study comprehensively investigated characteristics of severe HG- and LG-AS patients with reduced LVEF and there are some major findings to be considered:
- There were no significant differences in left ventricular function and volumetric analyses.
- No differences between subgroups were detected via histological, gene expression and circulating biomarker-based assessment.
- Right ventricular function was significantly impaired in LG-AS patients compared to HG-AS.
- Prevalence of atrial fibrillation and high-grade mitral regurgitation was significantly higher in LG-AS patients.
To compensate increased afterload caused by severe AS, the myocardium hypertrophes with subsequent remodeling processes leading to increased myocardial fibrosis. As the disease progresses, compensatory capabilities of the myocardium begin to fail resulting in a decrease of myocardial function [7, 23]. Importantly, patients with severe AS and reduced LVEF have worse outcome than AS patients with preserved LVEF [24]. Nevertheless, there are two different subgroups of AS patients with reduced LVEF – one subgroup generating high transaortic pressure gradients, whereas the other group has only low pressure gradients, suggesting different left ventricular responses on pressure overload. However, there were no significant differences neither in LV function comprising strain and volumetry, nor in histological and NGS assessment between both subgroups. The only LV parameter that significantly differed was CMR-derived ECV%, which is considered as a surrogate parameter for diffuse myocardial fibrosis. Since this is in contrast to the histological and NGS findings, it remains speculative, whether these results are caused by the limitation of a local biopsy, whereas ECV% is more sensitive to detect global remodeling processes [25]. It is noteworthy, that AS is known to exhibit a characteristic diffuse myocardial fibrosis pattern [22, 26]. Therefore, when evaluating myocardial fibrosis using methods like biopsy or CMR, it's crucial to account for factors like location, sampling methods, and technical analysis aspects. Invasive biopsies are limited by size and sampling precision issues, whereas LGE and ECV measurements encompass different myocardial regions, providing complementary information, which should be considered when interpreting the (combination of) different results and parameters.
In contrast, there was a significant reduction in right ventricular function (both in echocardiography and CMR) in the LG-AS subgroup. Following considerations of the Frank-Starling mechanism, RV dysfunction typically develops as a consequence of pressure and/or volume overload. This might be caused by an impaired left heart performance, chronic lung disease or pulmonary hypertension [27]. In addition, the occurrence of LV hypertrophy/LV dysfunction was shown to influence RV function by a pathological downstream response to pressure overload. In this context, in this study documented impaired septal GLS contraction in LG-AS patients might further explain deterioration of RV function.
On the one hand, the current results do not show relevant differences in left heart (dys-)function and consequently one might speculate, whether the deterioration of RVEF is rather caused by an intrinsic RV myopathy than as a mere consequence of LV failure. In line with these considerations, the CMR-derived PCWP did not differ between both subgroups and, therefore, potentially increased LV filling pressures might not explain an impaired RVEF and rather points towards an intrinsic right heart pathology. However, especially the right ventricular and atrial strain values were not reduced in the LG-AS subgroup. Since deformation parameters like CMR-derived strain have been demonstrated to be even more sensitive parameters to detect functional deterioration than volumetric alterations and that functional changes precede myocardial geometric alterations, a fundamental RV contractile deterioration cannot be demonstrated [28, 29]. Therefore, a decreased RVEF might rather be caused by impaired (LV and RV) hemodynamics than by a functional deterioration per se.
On the other hand, further explanations for altered hemodynamics and a lower transaortic gradient might be comorbidities like AF or a higher prevalence of mitral regurgitation, which may result in an incapability of the left ventricle to generate a higher gradient across the stenotic aortic valve. Since the severity of functional MR in AS patients is often directly influenced by elevated systolic ventricular pressures, this might indicate at least slight differences in ventricular pressures/ hemodynamics that are not measurable by the applicated (non-invasive) parameters [30–32].
Importantly, despite pathomechanistical considerations for different gradients, several studies have demonstrated substantial prognostic value both of right ventricular function and comorbidities in AS patients [33, 34]. It is noteworthy that RVD has been demonstrated to be independently associated with adverse outcome after adjusting for other cardiac comorbidities [33]. However, an additional prognostic impact of cardiac comorbidities, such as AF or MR, beyond aortic stenosis and its subsequent impairment of myocardial performance has been shown in several studies [35, 36]. Furthermore, comorbidities like AF have been linked with lower transaortic gradients and with adverse outcome in LG-AS patients, underlining its crucial influence on hemodynamics and prognosis in these patient cohorts [37].
Regarding clinical implications, although guidelines and/or risk calculators include LV function or transaortic gradients for risk stratification and therapeutic decision making in AS patients, they disregard other prognostically important parameters. For example, RV function is not implemented in the EuroSCORE II and STS score despite its reported association with adverse outcome in patients undergoing TAVI [38]. Given the growing prevalence of AS and the subsequent increase in valve replacement procedures, it could be worthwhile to develop a dedicated risk score specifically for AS patients. This score could incorporate and assign weights to the mentioned parameters and comorbidities. Furthermore, such an approach might even include the various AS subtypes and their individual risk profiles.
Hence, by comprehensive analyses of myocardial performance including CMR-derived right heart function as well as coexisting comorbidities, optimized timing of valve replacement and post-procedural monitoring could improve future management of AS patients undergoing TAVI. Further studies are needed to validate these findings and to transfer them into clinical practice.
Limitations
Data were prospectively collected in our TAVI registry, without excluding comorbidities such as CAD, which makes the study population an all-comer cohort. However, the data were collected monocentrically and retrospectively queried. Furthermore, the global NGS data set showed no distinct difference when comparing the two subgroups, but we cannot exclude the possibility of significant differences within individual genes.
Conclusion
In severe AS with reduced LVEF, patients with low transaortal gradient do not differ in left ventricular function or tissue composition compared to patients with high transaortal gradients. In contrast, right ventricular function is more restricted in the low gradient subgroup and additional cardiac comorbidities like atrial fibrillation or mitral regurgitation are more frequent than in patients with high transaortic gradients. Possessing additional important prognostic information, future diagnostic algorithms and treatment recommendations might therefore incorporate comprehensive assessment of right heart function and comorbidities for optimized treatment and patient management.
Supplementary Information
Below is the link to the electronic supplementary material.Supplemental Table 1 (DOCX 15 KB)
The reference list from the paper itself. Each links out to its DOI / PubMed record.
- 1Ancona’ ’Roberta, Pinto’ ’Salvatore Comenale. Epidemiology of aortic valve stenosis (AS) and of aortic valve incompetence (AI): is the prevalence of AS/AI similar in different parts of the world?. [cited 2023 Jan 9];18. Available from: https://www.escardio.org/Journals/E-Journal-of-Cardiology-Practice/Volume-18/epidemiology-of-aortic-valve-stenosis-as-and-of-aortic-valve-incompetence-ai, https://www.escardio.org/Journals/E-Journal-of-Cardiology-Practice/Volume-18/epidemiology-of-aortic-valve-ste
- 2GENCODE - Human Release 40. [cited 2023 Jul 13]; Available from: https://www.gencodegenes.org/human/release_40.html
- 3Smid M, Coebergh van den Braak RRJ, van de Werken HJG, van Riet J, van Galen A, de Weerd V, van der Vlugt-Daane M, Bril SI, Lalmahomed ZS, Kloosterman WP, Wilting SM, Foekens JA, I Jzermans JNM, Coene PPLO, Dekker JWT, Zimmerman DDE, Tetteroo GWM, Vles WJ, Vrijland WW, Torenbeek R, Kliffen M, Carel Meijer JH, vd Wurff AA, Martens JWM, Sieuwerts AM, on behalf of the MATCH study group (2018) Gene length corrected trimmed mean of M-values (Ge TMM) processing of RNA-seq data performs similarly in inte · doi ↗ · pubmed ↗
- 4Eleid MF (2019) Right ventricular function in TAVR: the right hand knows what the left hand is doing. JACC: Cardiovasc Imaging 12:588–59010.1016/j.jcmg.2018.01.01330448144 · doi ↗ · pubmed ↗
- 5Kim J, Yum B, Palumbo MC, Sultana R, Wright N, Das M, You C, Moskowitz CS, Levine RA, Devereux RB, Weinsaft JW (2020) Left atrial strain impairment precedes geometric remodeling as a marker of post-myocardial infarction diastolic dysfunction. JACC: Cardiovasc Imaging 13:2099–211310.1016/j.jcmg.2020.05.041PMC 755416732828776 · doi ↗ · pubmed ↗
- 6Tarantini G, Mojoli M, Windecker S, Wendler O, Lefèvre T, Saia F, Walther T, Rubino P, Bartorelli AL, Napodano M, D’Onofrio A, Gerosa G, Iliceto S, Vahanian A (2016) Prevalence and impact of atrial fibrillation in patients with severe aortic stenosis undergoing transcatheter aortic valve replacement: an analysis from the SOURCE XT prospective multicenter registry. JACC: Cardiovasc Interv 9:937–94610.1016/j.jcin.2016.01.03727085579 · doi ↗ · pubmed ↗