A novel circulating miRNA panel for early differential diagnosis of pulmonary tuberculosis from lung cancer with similar radiographic presentations
Xiao Liu, Wentao Wang, Yurong Fu, Zhengjun Yi

TL;DR
This study identifies a new blood-based miRNA panel that can accurately distinguish between pulmonary tuberculosis and lung cancer, even when their X-rays look similar.
Contribution
A novel circulating miRNA panel is proposed for early differential diagnosis of pulmonary tuberculosis and lung cancer.
Findings
Three miRNAs (hsa-miR-342-3p, hsa-miR-199a-3p, hsa-miR-199b-3p) are significantly upregulated in pulmonary tuberculosis compared to lung cancer.
The miRNA panel achieved an AUC of 0.911 in training and 0.886 in validation, with high sensitivity.
The panel outperforms the Xpert MTB/RIF assay for early-stage pulmonary tuberculosis detection.
Abstract
This study aimed to establish a novel diagnostic approach based on a circulating microRNA (miRNA) panel to reliably distinguish pulmonary tuberculosis (PTB) from lung cancer (LC), particularly in patients presenting with overlapping radiographic features. A total of 592 participants were enrolled. In the discovery phase, miRNA expression profiles from 284 individuals, including PTB patients, LC patients, and healthy controls (HC), were analyzed to screen potential biomarkers. Candidate miRNAs were subsequently validated in an independent cohort of 308 plasma samples. The analysis revealed significant upregulation of hsa-miR-342-3p, hsa-miR-199a-3p, and hsa-miR-199b-3p in PTB compared with LC. A diagnostic panel incorporating these three miRNAs demonstrated robust performance, achieving an area under the receiver operating characteristic curve (AUC) of 0.911 (95% confidence interval…
Genes, proteins, chemicals, diseases, species, mutations and cell lines named across the full text — each resolved to its canonical identifier and authoritative record.
Click any figure to enlarge with its caption.
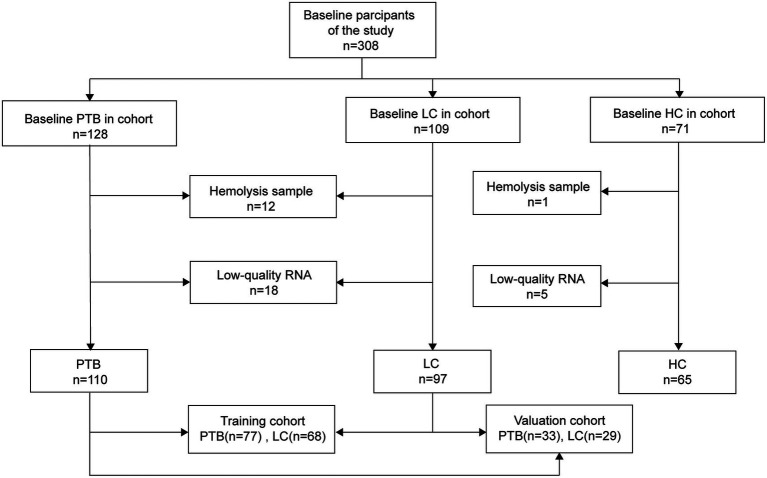 Figure 1
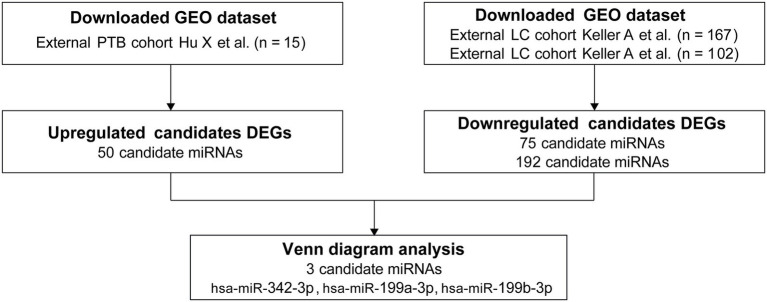 Figure 2
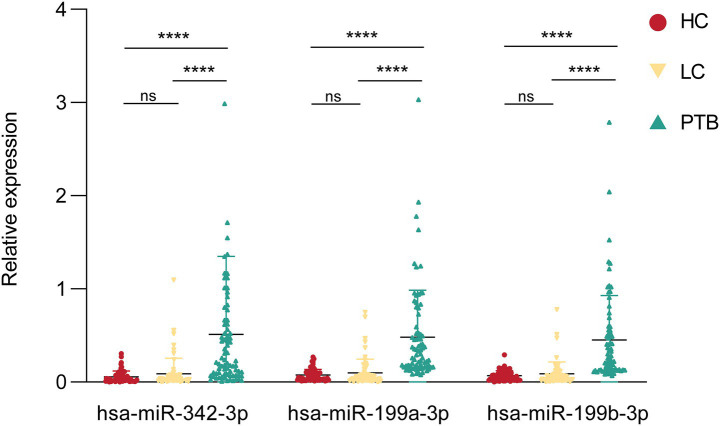 Figure 3
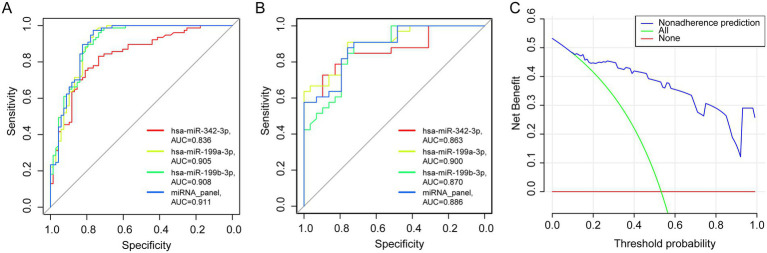 Figure 4
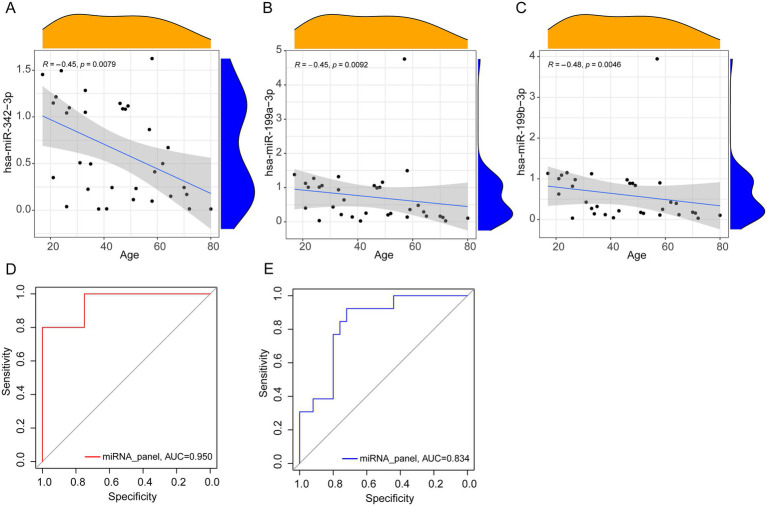 Figure 5
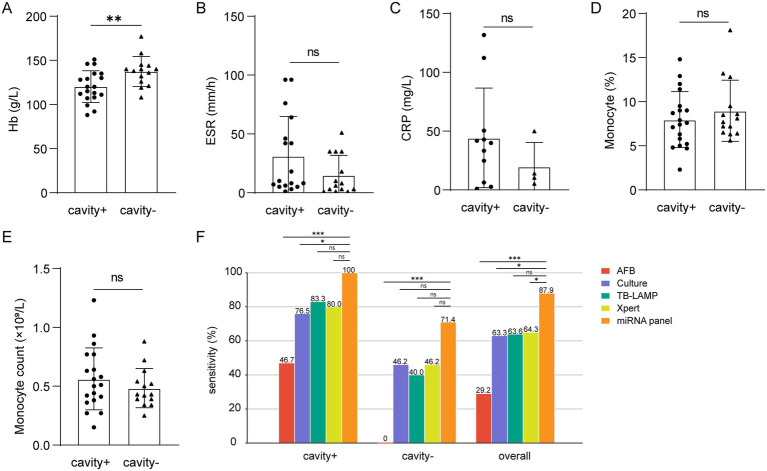 Figure 6
 Figure 7
| Characteristics | Category/Measure | Study population | ||
|---|---|---|---|---|
| PTB ( | LC ( | HC ( | ||
| Age at sampling | Mean±SEM | 44.32 ± 1.82 | 61.18 ± 0.99 | 41.23 ± 2.12 |
| Gender–counts | Male/Female | 80/30 | 54/43 | 45/20 |
| Clinical symptoms | Fever | 21 | 3 | 0 |
| Fatigue and night sweats | 4 | 1 | 0 | |
| Cough | 78 | 72 | 0 | |
| Expectoration | 67 | 66 | 0 | |
| Haemoptysis | 18 | 11 | 0 | |
| Chest pain | 10 | 13 | 0 | |
| Asymptomatic | 23 | 23 | 65 | |
| Presence of cavities | Positive | 38 | NA | NA |
| Negative | 72 | |||
| AFB smear | Positive | 25 | NA | NA |
| Negative | 60 | |||
| NA | 25 | |||
| TB-LAMP | Positive | 39 | NA | NA |
| Negative | 28 | |||
| NA | 43 | |||
| X-pert | Positive | 58 | NA | NA |
| Negative | 37 | |||
| NA | 15 | |||
| Culture | Positive | 57 | NA | NA |
| Negative | 42 | |||
| NA | 11 | |||
- —Natural Science Foundation of Shandong Province10.13039/501100007129
Peer Reviews
No public reviews on file for this paper yet. If you reviewed it on a platform where reviews are public (OpenReview, ICLR, NeurIPS, ICML), you can paste yours below so the community can read it here.
Videos
No videos yet. Explain this paper in a talk, walkthrough, or lecture? Add one.
Taxonomy
TopicsMicroRNA in disease regulation · Cancer-related molecular mechanisms research · RNA modifications and cancer
Highlights
Existing diagnostic approaches for PTB and lung cancer LC are limited by overlapping radiographic manifestations, reliance on invasive procedures, and suboptimal sensitivity.Plasma analysis revealed increased overexpression of hsa-miR-342-3p, hsa-miR-199a-3p, and hsa-miR-199b-3p in patients with PTB compared with those with LC.A diagnostic model incorporating these three miRNAs achieved high discriminatory power (training cohort AUC 0.911, validation cohort AUC 0.886), supporting its application for accurate, early, and non-invasive detection of PTB.
Introduction
Tuberculosis (TB) remains a pressing global health challenge and is still the leading cause of death from a single infectious agent. PTB, the most common clinical form, poses considerable diagnostic difficulties because its radiographic manifestations often overlap with those of LC. This similarity, combined with the limitations of existing non-invasive diagnostic techniques, usually leads to the misdiagnosis of PTB as LC (1–5). Accurate differentiation between PTB and LC, particularly in patients with comparable imaging features, is therefore crucial for timely treatment initiation and improved clinical outcomes.
Conventional non-invasive diagnostic methods, such as sputum smear microscopy and culture, are hampered by low sensitivity and long turnaround times. The Xpert MTB/RIF assay offers greater diagnostic accuracy; however, its high cost restricts its widespread use, especially in low-resource settings (6). Invasive procedures such as tissue biopsy can provide a definitive diagnosis but are not always accessible in resource-limited healthcare systems (7). These limitations underscore the urgent need for a rapid, reliable, and cost-effective non-invasive diagnostic strategy for PTB.
MicroRNAs, a class of small non-coding RNAs approximately 20–25 nucleotides in length, have emerged as highly stable biomarkers detectable in plasma and other body fluids, making them attractive candidates for non-invasive diagnostics (8, 9). Circulating miRNAs have shown diagnostic potential across multiple diseases, including malignancies and infectious conditions (10–12). Specific miRNAs are linked to the molecular pathogenesis of both LC and TB. For instance, hsa-miR-21–5p and hsa-miR-196b-5p have been implicated in the progression of LC, while hsa-miR-495 and hsa-miR-543 contribute to LC invasiveness (13–15). In TB, miRNAs such as hsa-miR-342, hsa-miR-222-3p, hsa-miR-431-3p, and hsa-miR-1303 play essential roles in regulating host innate immune responses (16, 17).
In this study, plasma miRNA profiles from 308 participants were analyzed, and a diagnostic classifier was developed using binary logistic regression to differentiate PTB from LC. The miRNA panel demonstrated higher sensitivity compared with conventional diagnostic methods, including Xpert MTB/RIF, sputum smear microscopy, and culture. These findings highlight the potential of miRNA–based assays as a precise, non-invasive strategy for improving early and accurate differentiation of PTB and LC.
Methods
Patient recruitment and sample collection
A total of 308 peripheral blood samples were collected from patients at Weifang No. 2 People’s Hospital between March 2021 and March 2024. Blood was drawn into EDTA-K_2_ anticoagulant tubes and centrifuged at 3000 rpm for 15 min at room temperature. The plasma fraction was then carefully separated and stored for subsequent RNA extraction. In addition to these clinical samples, miRNA expression profiles were obtained from publicly available datasets in the Gene Expression Omnibus (GEO) database, including GSE1165421, GSE31568, and GSE61741 (18, 19).
Reverse transcription-quantitative polymerase chain reaction
Total RNA was isolated from plasma samples using TRIzol™ LS Reagent (Thermo Fisher Scientific, Waltham, MA, United States) in accordance with the manufacturer’s instructions. Complementary DNA (cDNA) was synthesized from the extracted RNA using the PrimeScript™ II 1st Strand cDNA Synthesis Kit (Takara Bio, Shiga, Japan). Quantitative real-time PCR (qRT-PCR) was then conducted under the following thermal cycling conditions: initial denaturation at 95 °C for 30 s, followed by 40 amplification cycles consisting of denaturation at 95 °C for 5 s and annealing/extension at 60 °C for 30 s.
Primers specific for U6 small nuclear RNA (used as the endogenous control) and the three target miRNAs were synthesized by Sangon Biotech (Shanghai, China). Relative expression levels of miRNAs were calculated using the 2^−ΔCt^ method, where ΔCt = Ct (miRNA) – Ct (U6).
The target miRNA sequences, sourced from the miRDB database, were as follows:
hsa-miR-342-3p (23 bp): 5′-TCTCACACAGAAATCGCACCCGT-3′.hsa-miR-199a-3p (22 bp): 5′-ACAGTAGTCTGCACATTGGTTA-3′.hsa-miR-199b-3p (22 bp): 5′-ACAGTAGTCTGCACATTGGTTA-3′.
Verification against the GenBank database identified Mus musculus U6 small nuclear RNA-RnU6 (GeneID: 19862, 107 bp):
5′-GTGCTCGCTTCGGCAGCACATATACTAAAATTGGAACGATACAGAGAAGATTAGCATGGCCCCTGCGCAAGGATGACACGCAAATTCGTGAAGCGTTCCATATTTTT-3′.
Identification of candidate miRNA biomarkers
Differentially expressed miRNAs were identified using the GEO2R online analysis tool.2 For the LC group, the selection threshold was set at |log₂ fold change (FC)| ≥ 0, whereas for the PTB group, the threshold was |log₂FC| ≥ 1 with a significance level of p ≤ 0.05. Here, FC represents the ratio of the mean gene expression level in patients compared with HC. To maximize the inclusion of potentially informative biomarkers, no false discovery rate (FDR) adjustment or other multiple-testing corrections were applied during the initial screening, and statistical significance was defined as p ≤ 0.05. Furthermore, candidate miRNAs were required to show opposing expression patterns between the PTB and LC groups to enhance their diagnostic relevance.
Diagnostic performance and clinical net benefit analysis
A binary logistic regression model was established using SPSS software, version 27.0.1 (IBM Corp., Armonk, NY, USA). The diagnostic performance of the model was assessed by generating receiver operating characteristic (ROC) curves and calculating the AUC with MedCalc Statistical Software, version 20.022 (MedCalc Software bvba, Ostend, Belgium). Similarly, decision curve analysis (DCA) was conducted using R software, version 3.5.0 (R Development Core Team, Vienna, Austria), to evaluate the clinical net benefit of the predictive model.
Functional enrichment analysis of miRNA target mRNAs
Putative mRNA targets of the selected miRNAs were predicted using three publicly available databases: TargetScan version 7.23, miRWalk4, and miRDB.5 Functional enrichment analyzes of the predicted target genes were then performed using Gene Ontology (GO) annotations and Kyoto Encyclopedia of Genes and Genomes (KEGG) pathway analysis via the Sangerbox online platform.6
Statistical analysis
An independent t-test was applied to evaluate differences between two groups, whereas one-way analysis of variance (ANOVA) was used for comparisons involving more than two groups. Sensitivity comparisons among diagnostic methods were performed according to the following criteria: when the sample size was n ≥ 40 and all expected frequencies (T) were ≥ 5, Pearson’s chi-square test was used; when n ≥ 40 with at least one expected frequency of 1 ≤ T < 5, the continuity-corrected chi-square test was applied; and when n < 40 or any expected frequency was T < 1, Fisher’s exact test was employed. All statistical analyzes and graphical visualizations were conducted using GraphPad Prism software, version 8.0.2 (GraphPad Software, San Diego, CA, United States), and R software, version 3.5.0 (R Development Core Team, Vienna, Austria). A p-value of < 0.05 was considered statistically significant.
Results
Study participants and characteristics
A total of 308 participants were initially recruited for this study, comprising 128 patients with PTB, 109 patients with LC, and 71 HC. PTB cases were identified based on clinical symptoms and chest imaging findings consistent with tuberculosis. Among these, 86 patients were confirmed by positive results from Mycobacterium tuberculosis (MTB) culture, acid-fast bacilli (AFB) smear microscopy, the TB-LAMP assay, or the Xpert MTB/RIF test. The remaining 42 PTB cases were diagnosed based on clinical presentation, chest radiographic features, and a favorable response to anti-TB therapy, in accordance with the Chinese Clinical Guideline for Diagnosis of PTB (WS 288-2017). LC cases were confirmed primarily through histological and/or cytological examination, supplemented by clinical evaluation when necessary. The HC group included individuals without respiratory symptoms and those with normal chest imaging results obtained within 3 months before enrollment. None of the participants had a history of PTB or other malignancies, and all were free from medical treatment within the 4 weeks preceding recruitment.
To minimize potential confounding, all participants were screened to exclude co-infections such as HIV and hepatitis B virus. Plasma samples that were hemolyzed or failed to meet RNA quality control criteria were excluded, resulting in 272 eligible samples for downstream analysis. The sample selection process is outlined in Figure 1, and the demographic and clinical characteristics of the 272 included participants are summarized in Table 1.
Flow diagram illustrating the sample screening process. PTB, pulmonary tuberculosis; LC, lung cancer; HC, healthy control.
Identification of a 3-miRNA signature
The primary objective of this study was to identify a robust miRNA signature capable of distinguishing PTB from LC. In the current study, GEO datasets were analyzed, and 50 differentially expressed miRNAs were identified in a PTB dataset, along with 75 and 192 in two independent LC datasets. Comparative analysis revealed six overlapping candidates: hsa‑miR‑199a‑3p, hsa‑miR‑199b‑3p, hsa‑miR‑342‑3p, hsa‑miR‑502‑3p, hsa‑miR‑361‑5p, and hsa‑miR‑423‑5p. Because hsa-miR‑502‑3p, hsa‑miR‑361‑5p, and hsa‑miR‑423‑5p were consistently upregulated in both PTB and LC, they lacked discriminatory specificity and were excluded. Therefore, hsa‑miR‑342‑3p, hsa‑miR‑199a‑3p, and hsa‑miR‑199b‑3p were selected as the candidate biomarker panel (Figure 2).
To establish a rapid, non‑invasive diagnostic model, the plasma expression levels of these three miRNAs were quantified by RT‑qPCR. Significant differences were observed in expression levels between PTB patients (n = 77) and LC patients (n = 68), as well as between PTB patients and healthy controls (HC, n = 65) (Figure 3), supporting their potential clinical applicability.
miRNA panel selection. PTB, pulmonary tuberculosis; LC, lung cancer.
Profiling of blood miRNA expression in the clinical cohort. The clinical cohort consisted of a training group (PTB, n = 77; LC, n = 68) and an HC group (n = 65). PTB, pulmonary tuberculosis; LC, lung cancer; ns, no significance; **** p < 0.0001.
Establishment and validation of a diagnostic model of the 3-miRNA panel
The diagnostic model was trained on the cohort using binary logistic regression analysis [n = 145 (77 PTB and 68 LC)]. The diagnostic score for each case was calculated using the following equation:
The diagnostic model demonstrated excellent performance in plasma samples from patients with PTB, yielding an AUC of 0.911 (95% CI: 0.852–0.952, p < 0.001; Figure 4A), with a sensitivity of 0.974 and a specificity of 0.765. Based on these findings from the training cohort, the model was further evaluated for robustness and accuracy in an independent validation cohort (n = 62; 33 patients with PTB and 29 patients with LC). Validation testing confirmed the strong diagnostic application of the model, with an AUC of 0.886 (95% CI: 0.780–0.953, p < 0.001), a sensitivity of 0.879, and a specificity of 0.759 (Figure 4B).
Training and validation of the miRNA panel. (A,B) The area under the ROC curve of the training (PTB, n = 77, LC, n = 68) and validation cohorts (PTB, n = 33, LC, n = 29). (C) Decision curve analysis for evaluating the performance of the 3-miRNA panel.
For comparison, models constructed using only two miRNAs were also assessed; however, their AUC values were lower than those of the three-miRNA model, as summarized in Supplementary Table 1.
MiRNA panel: significant benefit in clinical practice
The clinical utility of any diagnostic tool depends on its ability to maximize accurate detection while minimizing the risks associated with misdiagnosis. In suspected LC cases, invasive procedures are often necessary, and both false-positive and false-negative results can lead to severe clinical consequences. To assess the practical applicability of the three-miRNA panel, DCA was performed (Figure 4C). In the test cohort, the DCA demonstrated that the miRNA panel consistently provided a higher net clinical benefit across all threshold probabilities compared with the default strategies of treating all patients or treating none. These results suggest that the panel may offer tangible clinical advantages by reducing the need for unnecessary invasive procedures and lowering the risk of diagnostic errors.
Age-related impact on miRNA expression and diagnostic performance
To examine the potential influence of age on miRNA expression and its implications for diagnostic accuracy, correlations between age and the expression levels of the three selected miRNAs were analyzed in patients with PTB. A negative correlation was observed, with expression levels decreasing as age increased (Figures 5A–C). The correlation coefficients were R = −0.45 (p = 0.008) for hsa-miR-342-3p, R = −0.45 (p = 0.009) for hsa-miR-199a-3p, and R = −0.48 (p = 0.005) for hsa-miR-199b-3p.
Correlation analysis and ROC curves. (A–C) Spearman correlation analysis between miRNA relative expression levels and age (PTB, n = 33). (D,E) The area under the ROC curve of the younger (PTB, n = 20, LC, n = 4) and older group (PTB, n = 13, LC, n = 25).
To further assess the effect of age on diagnostic performance, participants were stratified into two groups: younger (≤ 50 years) and older (≥ 51 years). The ROC curve analysis indicated improved diagnostic performance in the younger group, with an AUC of 0.950, compared with an AUC of 0.834 in the older group (Figures 5D,E). These results suggest that the diagnostic application of the miRNA panel may be particularly enhanced in younger individuals.
High sensitivity and early recognition in PTB compared to conventional methods
Early detection of PTB is critical for improving clinical outcomes. In the validation cohort, patients were initially stratified into early or late stages according to the presence or absence of pulmonary cavities. Recognizing that this single parameter has inherent limitations and may not adequately reflect the overall disease status, additional severity-related clinical indicators, including monocyte count, hemoglobin (Hb) levels, C-reactive protein (CRP), and erythrocyte sedimentation rate (ESR), were also evaluated to provide a more comprehensive assessment (20–24).
In PTB patients with cavitary disease, ESR, CRP, and monocyte counts were elevated compared with non-cavitary cases, whereas hemoglobin levels were significantly reduced (Figures 6A–E). These results underscore apparent clinical differences between cavitary and non-cavitary stages of PTB. The diagnostic utility of the three-miRNA panel was then compared with conventional methods. Across PTB subgroups, the panel consistently demonstrated high sensitivity. In cavitary PTB, it significantly outperformed smear microscopy and culture in detection sensitivity (p < 0.05). For non-cavitary PTB, the panel achieved sensitivity comparable to culture, although it did not surpass Xpert MTB/RIF (p < 0.05). When all PTB cases were assessed together, the miRNA panel showed higher sensitivity than Xpert MTB/RIF, smear microscopy, and culture (p < 0.05). These findings suggest that the panel may serve as a viable diagnostic alternative in clinical practice, with performance matching or, in some cases, exceeding that of Xpert (Figure 6F).
Differences in severity-related indicators and sensitivity comparison of different groups. (A–E) Hb (cavity+, n = 19, cavity−, n = 14), ESR (cavity+, n = 17, cavity-, n = 14), CRP (cavity+, n = 11, cavity−, n = 4), monocyte percentage (cavity+, n = 19, cavity−, n = 14) and count (cavity+, n = 19, cavity−, n = 14). (F) Comparison of miRNA panel, AFB smear, MTB culture, TB-LAMP, and Xpert assays among patients with or without cavity. ns, no significance. * p < 0.05. ** p < 0.01. *** p < 0.001.
Functional and pathway analysis of hsa-miR-342-3p and hsa-miR-199a/b-3p
To investigate the potential biological roles of the selected miRNAs in TB, GO enrichment analysis was conducted on their predicted target mRNAs. Target genes were identified based on the intersecting results from three prediction databases: TargetScan 7.2, miRWalk, and miRDB.
The GO analysis revealed that target genes of hsa-miR-342-3p were significantly enriched in biological processes, including positive regulation of gene expression, transcriptional regulation by RNA polymerase II, and RNA metabolic regulation (Figure 7A). Similarly, target genes of hsa-miR-199a/b-3p were associated with pathways involved in positive regulation of gene expression, macromolecule metabolic processes, and overall metabolic regulation (Figure 7B).
GO and KEGG enrichment. Bar plot shows the biological process (BP) of GO Enrichment Analysis with target mRNAs of hsa-miR-342-3p (A) and hsa-miR-199a/b-3p (B). (C) KEGG pathway enrichment of hsa-miR-342-3p. (D) KEGG enrichment of hsa-miR-199a/b-3p.
Then, KEGG pathway enrichment analysis was performed to identify signaling pathways that these miRNAs may regulate. Genes targeted by hsa-miR-342-3p were mainly enriched in the Ras, TGF-β, and Jak–STAT signaling pathways (Figure 7C). However, target genes of hsa-miR-199a/b-3p showed significant enrichment in the PI3K-Akt, thyroid hormone, and sphingolipid signaling pathways (Figure 7D).
Discussion
In clinical practice, distinguishing PTB from LC in patients with overlapping radiological presentations remains a significant challenge, as conventional non-invasive diagnostic methods are often limited by prolonged turnaround times and insufficient sensitivity. An effective diagnostic tool should ideally be rapid, affordable, and non-invasive, enabling the timely and accurate differentiation of conditions. Addressing the limitations of current strategies necessitates the development of innovative approaches that improve diagnostic precision. Although recent efforts in non-invasive rapid detection have primarily concentrated on advancements in radiological techniques (25), their diagnostic accuracy remains inadequate and requires further refinement.
In this context, molecular biomarker-based detection strategies are gaining increasing attention as a promising alternative. Extensive evidence suggests that miRNAs play a crucial role as key regulators in both infectious immune responses and tumor progression. The biological functions of the miRNA panel identified in this study are closely aligned with these pathological processes. For instance, the predicted target genes of hsa-miR-342-3p are highly enriched in pathways regulating gene expression, particularly the TGF-β and JAK–STAT signaling cascades, which is consistent with its established roles in tuberculosis and cancer biology. In PTB, hsa-miR-342-3p enhances host defense by targeting SOCS6, a negative regulator of the JAK–STAT pathway, promoting the secretion of pro-inflammatory cytokines and inducing macrophage apoptosis (16, 26). It’s observed that upregulation in PTB may therefore represent a host-protective response. By contrast, in NSCLC and other solid tumors, hsa-miR-342-3p functions as a tumor suppressor, inhibiting oncogenic drivers such as AGR2 and FOXQ1, while its association with the TGF-β pathway suggests a role in modulating the tumor microenvironment (27, 28). The frequent downregulation of hsa-miR-342-3p in cancer is likely attributable to the immunosuppressive conditions of the tumor microenvironment, which attenuate its tumor-suppressive activity.
Members of the hsa-miR-199 family (hsa-miR-199a-3p and hsa-miR-199b-3p) display enrichment in metabolic regulation and cancer-associated pathways. In models of septic acute kidney injury, these miRNAs modulate cellular homeostasis by suppressing Nrf2-mediated antioxidant gene expression (29, 30). Given the elevated oxidative stress associated with TB infection, this mechanism may contribute to the pathophysiology of PTB. The upregulation of hsa-miR-199a/b-3p in PTB serum likely reflects a compensatory host response aimed at curbing excessive inflammation while maintaining Nrf2-dependent antioxidant defenses. In NSCLC, the hsa-miR-199 family acts as a tumor suppressor primarily by inhibiting the Rheb-mTOR axis, a central pathway governing metabolic homeostasis and biosynthesis (31). Its downregulation in cancer may similarly result from the immunosuppressive tumor microenvironment, which impairs tumor-suppressive signaling.
The miRNA panel assessed in this study demonstrated robust diagnostic accuracy for distinguishing PTB from LC across both training and validation cohorts, with sensitivity and specificity comparable to, and in some instances superior to, those of several commonly used biomarkers. In comparison with cell-free DNA (cfDNA)-based detection methods, the panel showed higher sensitivity, largely because cfDNA released from tuberculous necrotic foci often overlaps with tumor-derived cfDNA, reducing the discriminative value of quantitative cfDNA analysis (32). Regarding circular RNAs (circRNAs), their application in differential diagnosis remains mainly exploratory. Currently, no reliable circRNA markers with stable and consistently opposite expression patterns between PTB and LC have been identified. Furthermore, the complexity and high cost of circRNA detection further limit their clinical applicability at the primary care level (33). Furthermore, when compared with combined tumor marker detection, miRNA expression offers distinct advantages, as it is less influenced by inflammation and demonstrates greater stability and reproducibility in clinical samples (34). These attributes underscore the superior overall performance and translational potential of the identified miRNA panel.
Beyond these comparisons, the panel’s sensitivity for early PTB detection was further evaluated against conventional diagnostic methods, including culture, Xpert assay, AFB smear microscopy, and LAMP, in clinical settings. For this purpose, patients without pulmonary cavities were classified as having early-stage PTB, while those with cavities were considered to have late-stage PTB. Across both stages, the panel demonstrated diagnostic performance comparable to, and in some cases exceeding, that of Xpert, particularly in early disease detection, where reliable differentiation is most critical.
Although Xpert remains a widely validated diagnostic platform, our results suggest that the proposed approach could serve as a valuable complementary tool, particularly in resource-constrained settings or in scenarios where rapid diagnosis is critical. Numerous studies have confirmed the remarkable stability of miRNAs under diverse storage conditions: they can remain preserved for more than 17 years at −80 °C, remain stable for up to 7 days at 4 °C, and exhibit no significant degradation for at least 24 h at room temperature. These characteristics fulfill the stringent criteria required for reliable clinical diagnostics (35, 36). In the present study, all plasma samples were either processed for immediate miRNA extraction or subjected to a single freeze–thaw cycle at −80 °C within 1 hour of collection. Further, stringent quality control procedures were implemented throughout all pre-analytical stages to minimize technical variation, ensuring both analytical precision and reproducibility.
However, several limitations of this study should be acknowledged. First, patients with concurrent PTB and LC were excluded due to the rarity of such cases; as a result, miRNA expression patterns in this subgroup were not evaluated. Second, since LC patients do not typically undergo TB-specific diagnostic testing, direct comparisons of TB detection specificity across different diagnostic methods could not be performed. Moreover, although efforts were made to minimize confounding factors during sample selection, such as excluding individuals with co-infections, other variables, including concurrent infections and age-related differences, may still influence the diagnostic accuracy of the miRNA panel in real-world clinical settings.
To address these gaps, future studies should expand cohort sizes and incorporate more diverse patient populations, while also benchmarking the panel against emerging state-of-the-art diagnostic technologies. Such investigations will be essential to further validate and refine the clinical translational potential of this miRNA-based diagnostic strategy.
Conclusion
In summary, this study established a rapid and non-invasive diagnostic strategy capable of differentiating PTB from LC in patients with overlapping radiological presentations. The identified miRNA panel demonstrated higher sensitivity compared to conventional methods, including Xpert MTB/RIF, smear microscopy, and culture, while also offering a lower cost and greater feasibility. These attributes highlight its strong potential for clinical translation, particularly in resource-limited settings, where it may serve as a practical and effective tool for diagnosing focal pulmonary lesions.
The reference list from the paper itself. Each links out to its DOI / PubMed record.
- 1Kim H Kim HY Goo JM Kim Y. Lung Cancer CT screening and lung-RADS in a tuberculosis-endemic country: the Korean lung Cancer screening project (K-LUCAS). Radiology. (2020) 296:181–8. doi: 10.1148/radiol.2020192283, PMID: 32286195 · doi ↗ · pubmed ↗
- 2Saleemi SA Alothman B Alamer M Alsayari S Almogbel A Mohammed S. Tuberculosis presenting as metastatic lung cancer. Int J Mycobacteriol. (2021) 10:327–9. doi: 10.4103/ijmy.ijmy_89_21, PMID: 34494575 · doi ↗ · pubmed ↗
- 3Niyonkuru A Chen X Bakari KH Wimalarathne DN Bouhari A Arnous MMR. Evaluation of the diagnostic efficacy of 18F-Fluorine-2-deoxy-D-glucose PET/CT for lung cancer and pulmonary tuberculosis in a tuberculosis-endemic country. Cancer Med. (2020) 9:931–42. doi: 10.1002/cam 4.2770, PMID: 31837121 PMC 6997090 · doi ↗ · pubmed ↗
- 4Lang S Sun J Wang X Xiao Y Wang J Zhang M. Asymptomatic pulmonary tuberculosis mimicking lung cancer on imaging: a retrospective study. Exp Ther Med. (2017) 14:2180–8. doi: 10.3892/etm.2017.4737, PMID: 28962139 PMC 5609136 · doi ↗ · pubmed ↗
- 5Shu CC Chang SC Lai YC Chang CY Wei YF Chen CY. Factors for the early revision of misdiagnosed tuberculosis to lung Cancer: a Multicenter study in a tuberculosis-prevalent area. J Clin Med. (2019) 8:700. doi: 10.3390/jcm 8050700, PMID: 31108871 PMC 6571679 · doi ↗ · pubmed ↗
- 6Steingart KR Schiller I Horne DJ Pai M Boehme CC Dendukuri N. Xpert® MTB/RIF assay for pulmonary tuberculosis and rifampicin resistance in adults. Cochrane Database Syst Rev. (2014) 2014:CD 009593. doi: 10.1002/14651858.CD 009593.pub 3, PMID: 24448973 PMC 4470349 · doi ↗ · pubmed ↗
- 7Prabhakar B Shende P Augustine S. Current trends and emerging diagnostic techniques for lung cancer. Biomed Pharmacother. (2018) 106:1586–99. doi: 10.1016/j.biopha.2018.07.145, PMID: 30119234 · doi ↗ · pubmed ↗
- 8Balzano F Deiana M Dei Giudici S Oggiano A Baralla A Pasella S. mi RNA stability in frozen plasma samples. Molecules. (2015) 20:19030–40. doi: 10.3390/molecules 201019030, PMID: 26492230 PMC 6331950 · doi ↗ · pubmed ↗