Multiplex long-amplicon sequencing for comprehensive molecular surveillance of Plasmodium falciparum resistance to artemisinin and partner drugs in artemisinin-based combination therapies (ACTs)
Fei Li, Jiayao Zhang, Sui Xu, Yinlong Wang, Zhiyi Mao, Guoding Zhu, Yaobao Liu, Jun Cao

TL;DR
This study develops a new sequencing method to detect drug resistance in malaria parasites, enabling comprehensive and cost-effective monitoring of resistance mutations.
Contribution
The study introduces a multiplex long-amplicon sequencing panel for full-gene surveillance of Plasmodium falciparum drug resistance.
Findings
The panel covers six genes, including four artemisinin resistance markers and two ACT partner drug resistance markers.
It achieves high sensitivity and species-specific amplification with low sequencing data requirements and minimal cost per sample.
The method enables detection of both known and emerging resistance mutations across entire genes.
Abstract
Antimalarial resistance, especially artemisinin resistance, in Plasmodium falciparum threatens global malaria control. Molecular surveillance of Plasmodium falciparum drug resistance is critical for monitoring the efficacy of artemisinin-based combination therapies (ACTs). Current molecular surveillance tools for Plasmodium falciparum artemisinin resistance are restricted to predefined polymorphism hotspots in limited loci (Pfk13 domain), failing to capture novel mutations in emerging resistance genes (Pfcoronin, Pfubp1, Pfap2μ) or cover complete coding regions. This study addresses this gap by developing an optimized long-amplicon panel for comprehensive, full-gene resistance surveillance. Six genes were selected for the multiplex PCR amplification, including four artemisinin resistance-related markers (Pfk13, Pfcoronin, Pfap2μ and Pfubp1) and two ACTs partner drugs resistance markers…
Genes, proteins, chemicals, diseases, species, mutations and cell lines named across the full text — each resolved to its canonical identifier and authoritative record.
Click any figure to enlarge with its caption.
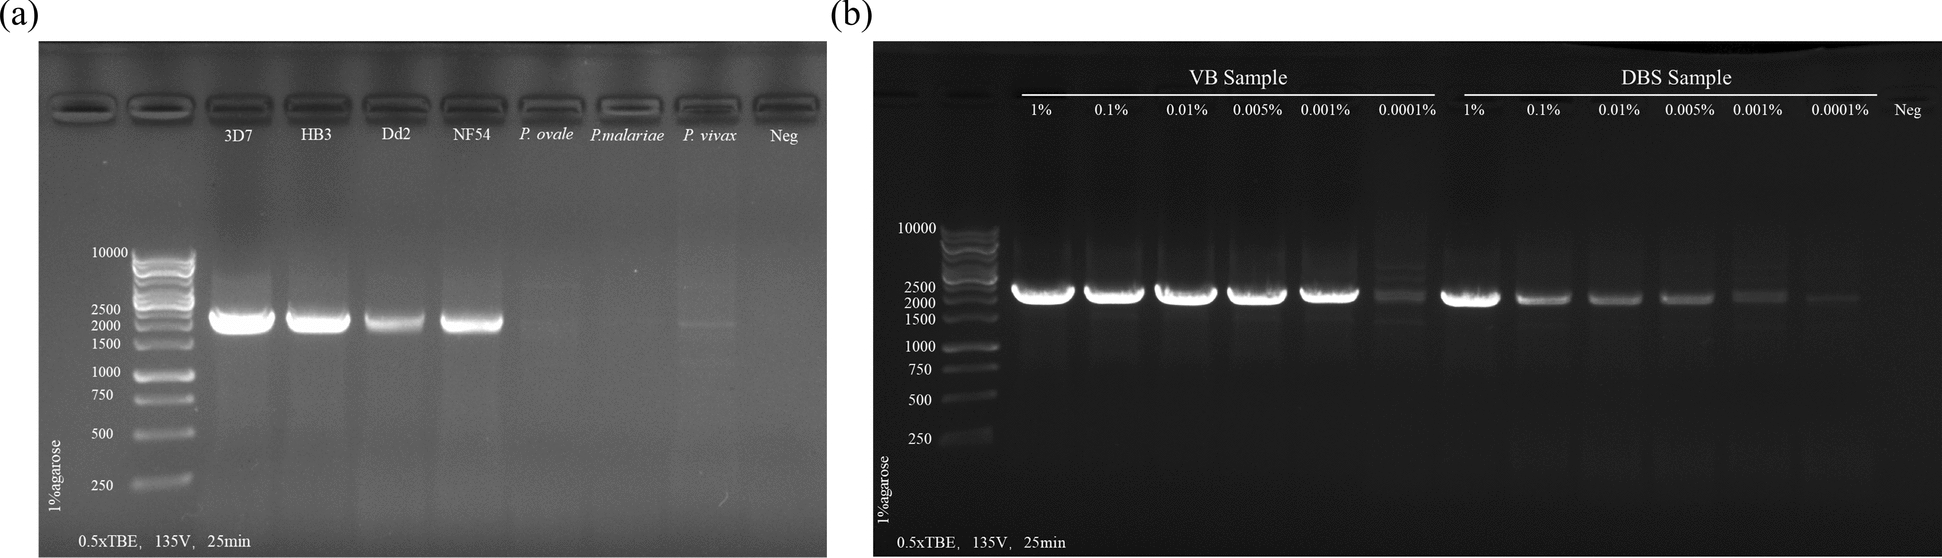 Figure 1
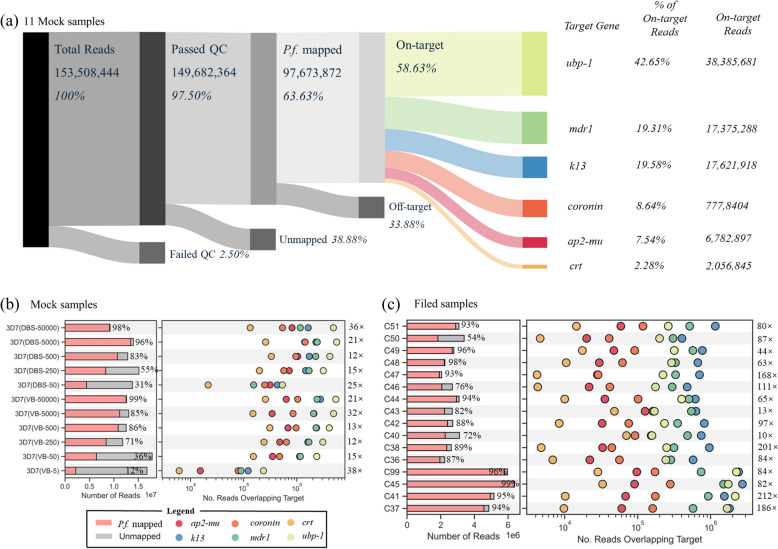 Figure 2
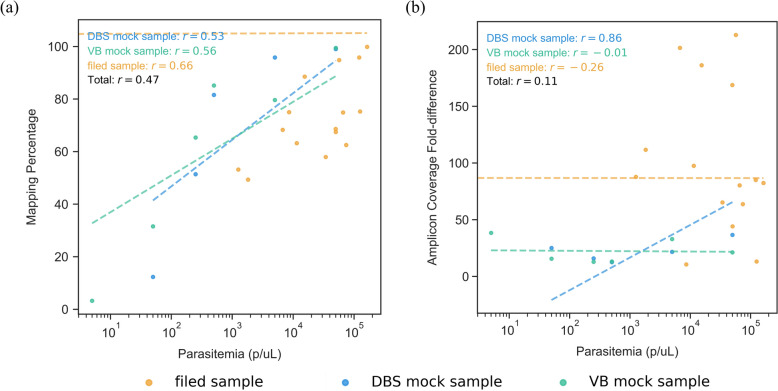 Figure 3
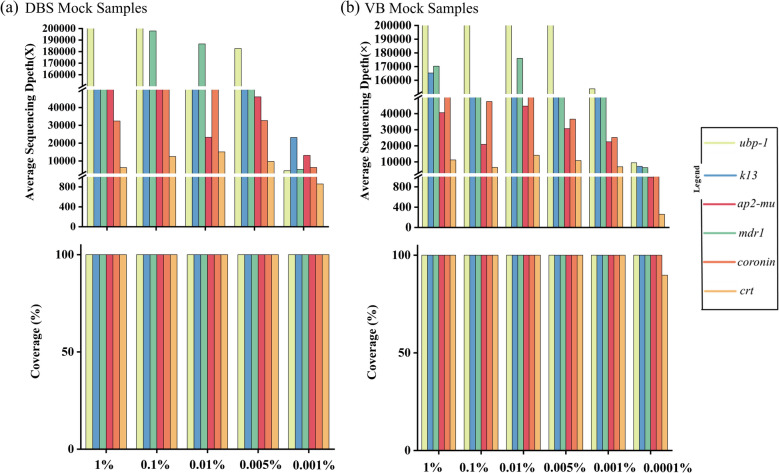 Figure 4
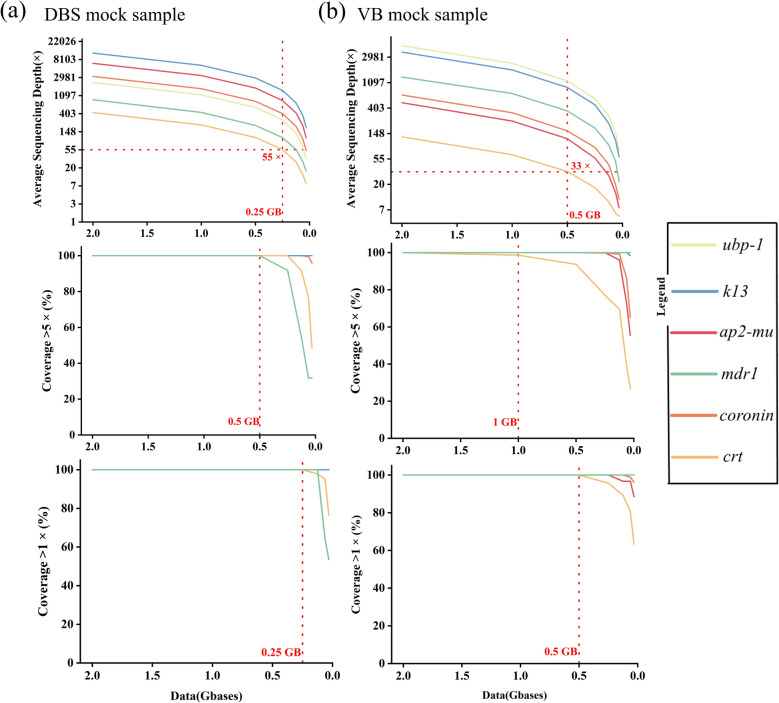 Figure 5
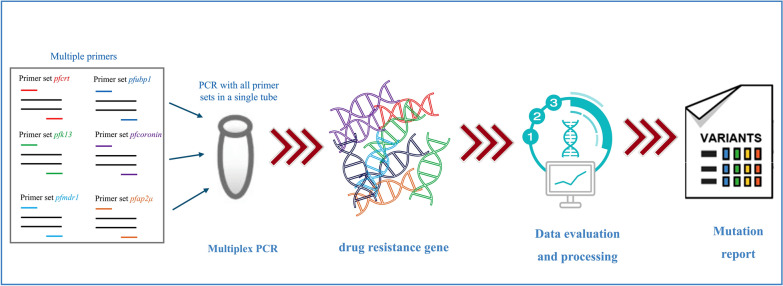 Figure 6
- —https://doi.org/10.13039/501100001809National Natural Science Foundation of China
Peer Reviews
No public reviews on file for this paper yet. If you reviewed it on a platform where reviews are public (OpenReview, ICLR, NeurIPS, ICML), you can paste yours below so the community can read it here.
Videos
No videos yet. Explain this paper in a talk, walkthrough, or lecture? Add one.
Taxonomy
TopicsMalaria Research and Control · Computational Drug Discovery Methods · Trypanosoma species research and implications
Background
Malaria remains a life-threatening infectious disease with profound implications for global health. The World Health Organization (WHO) reported approximately 263 million malaria cases and 597,000 deaths globally in 2023, with Africa region accounting for 94% of cases and 95% of deaths [1]. At present, the primary treatment for Plasmodium falciparum malaria, the most virulent form of malaria, is artemisinin-based combination therapies (ACTs). These combine a fast-acting artemisinin derivative with a longer-lasting partner drug to ensure effective parasite clearance and lower the risk of recrudescence [2]. The most widely used ACTs are artemether-lumefantrine (AL), artesunate-amodiaquine (AS-AQ), artesunate methylfluoroquine (AS-MQ) and dihydroartemisinin-piperaquine (DHA-PPQ) [3]. However, the widespread deployment of ACTs has driven the evolution of artemisinin resistance (ART-R) and partner drugs resistance in Plasmodium falciparum. Currently, artemisinin-resistant Plasmodium strains have spread across the Greater Mekong Subregion (GMS) [4, 5]. Independently originated artemisinin-resistant parasite strains have been reported in Africa, South America, and Oceania [6–9]. In addition, multiple investigations have documented the parasite strains resistant to both artemisinin and partner drugs in Southeast Asia and Africa [10, 11]. In Southeast Asia, artemisinin and piperaquine-resistant have been identified through longitudinal surveillance [12]. Concurrently, declining sensitivity to both artemisinin and lumefantrine has been observed in northern Uganda [13].
Functional genomic studies and population-level analyses have elucidated key resistance mechanisms, including genetic variants linked to artemisinin delayed parasite clearance and reduced susceptibility to ACTs partner drugs [14–16]. Mutations in the Kelch13 propeller domain (Pfk13; PF3D7_1343700) on chromosome 13 are most strongly associated with delayed parasite clearance under artemisinin pressure [14]. However, these mutations do not account for all artemisinin resistance cases [17]. For example, mutations in the P. falciparum coronin (Pfcoronin; PF3D7_1251200 )[18], P. falciparum ubiquitin carboxyl-terminal hydrolase 1 (Pfubp1; PF3D7_0104300) [19] and P. falciparum AP-2 complex subunit mu (Pfap2μ; PF3D7_1218300) [20] are also linked to ART-R and could become new ART-R markers. A study on imported African ACTs treatment recrudescence cases found no Pfk13 gene variations but mutations in the Pfubp1 and Pfap2μ genes [21]. Another in vitro study suggested that Pfcoronin and Pfk13 mutations impact ART-R independently [22]. ACTs resistance also involves many molecular markers of partner drugs resistance. P. falciparum multidrug resistance protein 1 (Pfmdr1; PF3D7_0523000) mediates lumefantrine [23] and mefloquine resistance [24]. P. falciparum chloroquine resistance transporter (Pfcrt; PF3D7_0709000) drives piperaquine[25] resistance and contributes to amodiaquine [26] and lumefantrine [27] resistance through distinct mutations. Systematic surveillance resistance-related mutations across endemic regions are critical for tracking epidemiological trends and informing targeted malaria control strategies.
Several amplicon sequencing platforms have been developed for molecular surveillance of P. falciparum antimalarial drug resistance. Molecular inversion probes (MIPs) efficiently interrogate known resistance markers [28], yet its utility is limited by specific probe design due to complex AT-rich P. falciparum genome, length of efficiently targetable sequences as well as the diminished sensitivity for detecting low-frequency variants. Recent nanopore-based multiplex PCR [29] and MADHATTER amplicon panels [30] have expanded surveillance capacity for antimalarial drugs resistance, but detection of emerging markers (Pfcoronin, Pfubp1 and Pfap2μ) still requires further optimization. These technical constraints show the urgent need for comprehensive profiling tools that can capture both known and emerging resistance mechanisms across complete gene architectures.
In this study, we designed a long amplicon panel to sequence P. falciparum drug resistance related genes. It covers current artemisinin resistance associated targets (including Pfk13 and three newly identified genes: Pfcoronin, Pfubp1 and Pfap2μ) and common ACTs partner drugs resistance targets (Pfmdr1 and Pfcrt). We also designed full-length gene constructs for Pfk13, Pfcoronin, Pfap2μ and Pfcrt to systematically investigate mutational profiles across entire coding regions and their correlations with antimalarial drug resistance. The method shows excellent detection performance and has strong practical application potential.
Methods
Designing multiplex amplicon panel
Through in silico optimization using multiply software [31], we designed specific primers for six targets with amplicon sizes standardized to approximately 2.5 ± 0.2 kb to minimize amplification bias. Full-length coverage was achieved for Pfk13, Pfcoronin, and Pfap2μ, while Pfmdr1, Pfcrt and Pfubp1 were designed with partial sequences covering all known resistance-associated loci (Table 1). The Pfmdr1 gene was strategically divided into two fragments in the experimental design. Table 1. Target genes for amplicon sequencing panelNoReference IDGene nameCDS^a^Amplicon^b^Amino acids coveredRelevance1PF3D7_1343700pfkelch13218025831–726Artemisinin2PF3D7_1251200Pfcoronin214424391–602Artemisinin3PF3D7_0104300Pfubp110,96123021123–1876Artemisinin4PF3D7_1218300Pfap2μ186524621–621Artemisinin5PF3D7_0709000Pfcrt3095248137–381Chloroquine Piperaquine Amodiaquine Lumefantrine6PF3D7_0523000Pfmdr1425948191–418, 679–1419Lumefantrine Pyronaridine Mefloquine^a^CDS refers to the length of coding sequence. ^b^Amplicon refers to the length of amplicon sequence
Construction of the mock samples
We cultured the P. falciparum 3D7 strain to reach a parasite density of 2% (50,000 parasites/μL). The infected blood was then mixed with uninfected blood in various ratios to generate samples mimicking parasitemia levels of 1%, 0.1%, 0.01%, 0.005%, 0.001%, and 0.0001%. Following this, 150 μL of each mixture was spotted onto filter paper and air-dried under ambient conditions to generate dried blood samples (DBS). Genomic DNA was extracted using a QIAamp DNA Mini Kit (QIAGEN; Düsseldorf, Germany).
Collection of field clinical samples
Venous blood samples were collected from 16 returned migrant workers originating from Democratic Republic of Congo in Jiangsu Province from January 2020 to December 2023. Plasmodium species were identified through microscopic examination, rapid diagnostic test (RDT), and real time fluorescence quantitative PCR (qPCR). All samples were confirmed for parasite density via qPCR [32]. The study was approved by the Ethics Committee of Jiangsu Institute of Parasitic Diseases (approval number JIPD-2024–017) and written informed consent was obtained from each participant and parent or legal guardian.
Laboratory protocol and sequencing
Primer concentration combinations were evaluated utilizing gel electrophoresis and sequencing. The optimization process was designed to identify robust primer sets that met two critical performance criteria: the ability to achieve detection thresholds of ≤ 5 parasites/μL in both DBS and VB samples during successful amplification, and the minimization of nonspecific banding. After multiple rounds of multiplex PCR optimization, the final reaction conditions used in this study were determined, ensuring experimental precision and reproducibility. In brief, 4 μL of gDNA from VB and DBS mock samples were used as template in a 20 μL multiplex PCR with UCP Multiplex PCR kit (#206,472) and amplicon panels pools (Table S1 and S2). Multiplex PCR products were cleaned using a 0.6 × ratio of QIAseq Beads (#333,923) and eluted in 25 μL nuclease-free water. Amplicon quality was evaluated using the 1 × dsDNA High Sensitivity Assay on a Qubit Fluorometer (Invitrogen) before library preparation. The remaining PCR products were purified for paired-end sequencing (2 × 150 bp chemistry) of the final pool was performed on the Illumina NovaSeq 6000 platform and using the VAHTS Universal Pro DNA Library Prep Kit (Illumina).
Bioinformatics analysis
Illumina raw paired-end reads were quality-controlled and filtered using fastp [33]. Following this step, reads that are mapped to the human reference genome were discarded. The remaining reads were mapped to the P. falciparum 3D7 v3 reference genome [34] using BWA-MEM 0.7.17 [35] with the -M parameter to mark shorter split hits as secondary. BAM improvement steps were applied to the read mapping outputs. Samtools fixmate v1.20 [36] and Picard v3.2.0 MarkDuplicates were applied to the BAM files of each sample. GATK Base Quality Score Recalibration [37] was applied using default parameters, using variants from the P. falciparum crosses 1.0 release [34] as known sites. Genotypes were called from each sample-level BAM using GATK HaplotypeCaller with parameters -contamination 0 -ERC GVCF to produce a separate gVCF. Each variant was assigned a quality score using GATK’s Variant Quality Score Recalibration (VQSR). VariantRecalibrator was run using the PASS variants from the P. falciparum crosses 1.0 release as a training set. ApplyRecalibration was then used to assign each variant a quality score named VQSLOD. Variants annotations were applied using snpEff version 5.2c [38], with gene annotations downloaded from GeneDB6 February 2020 release [34].
Results
Design of the amplicon panel and amplification performance evaluation
We developed a long-amplicon panel (Table 1) encompassing four artemisinin resistance-related genes (Pfk13, Pfcoronin, Pfap2μ and Pfubp1) and two partner drug resistance-related genes (Pfmdr1 and Pfcrt), all primer sequences detailed in Table S1. Through iterative optimization via gel electrophoresis and high-throughput sequencing, we determine the optimal annealing temperatures and establish a tiered primer concentration system: Pfk13 at 2.5 μM, other targets at 0.5 μM (Fig. S1a and S1b). Specificity validation involved six Plasmodium strains: four P. falciparum (3D7, Dd2, HB3 and NF54) and three non-falciparum species (P.ovale, P.vivax and P.malariae). Gel electrophoresis demonstrated distinct amplification bands (2.5 ± 0.2 kb) in all falciparum strains, with no specific amplification in nontarget species (Fig. 1a). Deep sequencing revealed 100% target gene coverage in falciparum samples versus < 3.7% nonspecific mapping in other species, confirming primer specificity across the Plasmodium falciparum genus (Fig. S2c). The impact of varying parasitemia on amplification efficiency was also evaluated (Fig. 1b). For DBS and VB samples, gel electrophoresis showed distinct amplification bands (2.5 ± 0.2 kb) range for samples with 1% to 0.001% parasitemia, but no nonspecific bands. However, samples with 0.0001% parasitemia had significantly weaker band intensity (Fig. 1b).Fig. 1. The amplification effect of the method. (a) Gel electrophoresis of amplified products of different strains of P. falciparum and Plasmodium species. (b) Gel electrophoresis of amplification products of mock samples with different parasitemia (1%-0.0001%)
Sequencing performance of mock and field samples
A total of 11 mock samples were used to validate the efficacy of multi-target amplification sequencing. The total raw sequencing data generated from 11 mock samples using the Illumina platform comprised 153,508,444 reads, equivalent to 21.43 Gb of sequence data (Fig. 2a). Of these, 97.50% were retained after processing with the fastp quality-control filter. Most reads successfully mapped to the reference sequence (97,673,872 reads; 63.63%, Fig. 2a). Among the reads successfully aligned to the P. falciparum genome, 92.14% were mapped to the intended target regions, indicating method effectively reduced off-target amplicon generation. Finally, 56.63% of all sequencing reads were mapped to on-target regions.Fig. 2. Sequencing coverage across samples and target genes for the long-amplicon panel. (a) Reads of mock samples generated from Illumina Novaseq sequencing. The upper right corner shows the total sequencing reads (153,508,444; 100%), which are subsequently filtered during the data analysis process to yield the reads of interest—specifically those mapped to target genes (90,002,000; 58.63%). (b) The left panel presents a bar plot showing the total number of reads generated for each sample, stratified by mapping outcome reads mapped to P. falciparum (P.f.) (red) and those failing to map (grey). The right panel features a scatter plot illustrating the number of reads that overlap each target gene (color-coded) after mapping for each sample. (c) Same as (b) for 16 field samples collected as VB from the Democratic Republic of Congo
We evaluated sequencing coverage evenness across amplicons by quantifying overlapping reads for each target. For DBS mock samples, VB mock samples, and field samples, the median fold-difference in coverage between the highest and lowest abundant amplicons was 21, 18, and 84, respectively (Fig. S3a and S3c). For both mock and field sample sequencing runs, the amplicon abundance rank order showed no statistical differences (Spearman’s ρ = 0.81 for mock samples; Spearman’s ρ = 0.71 for field samples; Fig. S3a and S3b). Furthermore, no significant difference was found between two groups (Spearman’s ρ = 0.771, MedianΔ = 0; Fig. S4), while Pfk13 ranked first in field samples but third in mock samples, and Pfubp1 showed the opposite. Pfcrt had the lowest abundance in both mock and field samples. However, Pfcrt still had a median coverage of 197,673-fold in mock samples and 10,081-fold in field samples (Fig. S3a and S3b).
The impact of parasitemia on sequencing performance
We investigated the impact of varying parasitemia density on sequencing performance metrics: the percentage of reads mapped to Plasmodium falciparum; and the fold difference in coverage between the most abundant and least abundant amplicons. (Fig. 3). P. falciparum mapping percentages showed a moderate positive correlation with parasitemia (Pearson’s r = 0.47; Fig. 3a). However, the amplicon coverage fold-difference had only a weak positive correlation with parasitemia (Pearson’s r = 0.11; Fig. 3b).Fig. 3. Effect of parasitemia on sequencing performance. Scatterplots display the effect that parasitemia (x-axis) has on the long-amplicon panel. (a) “Mapping percentage,” which is the percentage of all reads from a sample that mapped to P. falciparum. (b) The “amplicon coverage fold-difference” which, for a given sample, is the ratio of the number of reads overlapping the highest abundance amplicon, divided by the number of reads overlapping the lowest abundance amplicon. Each point is either a DBS mock sample (blue), or a field sample (yellow) or a VB mock sample (green)
We evaluated the sensitivity of our protocol using amplicon panels on mock samples. Figure 4 shows that as parasite density decreases, the average sequencing depth of target regions declines (Fig. 4b), yet the depth with > 100 × coverage stays at 100%. Notably, for the DBS sample with 0.001% parasitemia, the average sequencing depth of the target regions was > 858 × . For VB mock samples, the average sequencing depth showed a similar trend to that of DBS mock samples (Fig. 4b). Remarkably, even at 0.0001% parasitemia, the sample’s target regions had an average sequencing depth of > 1346 × , but the coverage of the Pfcrt gene region at > 100 × was 89.77% (Fig. 4b).Fig. 4. The sensitivity of multiple PCR amplicon sequencing. Two measures of sequencing analysis are shown (y-axis): The average sequencing depth of the target regions; The coverage of sequencing depth > 100 × . (a) Bar plot the average sequencing depth and coverage of target genes for five DBS samples (parasitemia ranging from 1% to 0.001%). (b) Same as (a) but for 6 VB mock samples (parasitemia ranging from 1% to 0.0001%) sequenced
Assessment of the minimum sequencing data volume
To meet minimal sequencing data requirements, we used fastp software to iteratively trim raw data and evaluated the sequencing efficacy post-reduction. Sensitivity analysis revealed a negative correlation between sequencing efficiency and parasitemia at a fixed data volume. Consequently, we concentrated optimization efforts on VB mock samples (0.0001% parasitemia) and DBS mock samples (0.001% parasitemia). The total cost for processing a sample from DNA extraction to the acquisition of sequencing data is as low as $15.60 (Table S3). For DBS mock samples, reducing data volume decreased the average target region sequencing depth (Fig. 5a). The percentage of target regions with sequencing depths exceeding 5 × remained 100% until the data volume fell below 0.50Gb. However, some target genes had a coverage rate of less than 100% when data volume was below 0.25GB. At 0.25GB, the minimum average sequencing depth of the target gene reached 55 × . For VB samples with 0.0001% parasitemia, the average target region sequencing depth showed a similar trend to DBS samples as data volume decreased (Fig. 5b). A threshold was observed at 1.0Gb: below this, some target regions had less than 100% of sequencing depths exceeding 5 × . Notably, when data volume was below 0.5 GB, target region coverage was less than 100%, and the minimum average sequencing depth of the target gene reached 33 × .Fig. 5. Exploration of the minimum sequencing data volume for sequencing mock samples. Three measures of sequencing performance are shown (y-axis): “average sequencing depth”, which is the average sequencing depth of target genes (top row); “coverage > 5 × (%)”, which is the percentage of sequencing depth greater than 5 × (middle row); “coverage > 1 × (%)”, which is the percentage of a sequencing depth greater than 1 × (bottom row). (a) The relationship between three measures of DBS mock sample with 0.001% parasitemia and changes in data volume. (b) Same as (a), the sample is VB mock sample with 0.0001% parasitemia
Discussion
In this study, we designed a long-amplicon panel for antimalarial resistance molecular surveillance which combines full-length sequencing of artemisinin resistance-associated genes (Pfk13, Pfcoronin, Pfap2μ) with partial sequencing of loci linked to partner drug resistance (Pfmdr1, Pfcrt) and artemisinin resistance (Pfubp1). In contrast to prior methodologies restricted to hotspot regions [28], our approach encompasses the entirety of coding sequences, enabling the identification of both known and novel mutations. Moreover, comparative analysis (Table S4) shows that our method offers measurable gains in both specificity and sensitivity over other published approaches [29–31, 39, 40], while keeping the per-sample cost to 60.87 per-sample expenditure reported in Chanon Kunasol et al.’s protocol [41] and 60% lower than the $25.00 per-sample baseline established by Mariateresa de Cesare et al. [31].
Current ART-R monitoring mainly detects the Pfk13 domain region (441–720) [42, 43] but ignores nondomain mutations [44]. While current MIPs and nanopore sequencing panels are effective for predefined resistance loci genotyping [28], they do not currently cover the entirety of emerging genes, such as Pfcoronin, Pfubp1 and Pfap2μ, which have recently been implicated in artemisinin resistance, leaving novel mutations undetected. Our long-amplicon panel covers the entire Pfk13 and three additional artemisinin resistance-related genes. The iterative optimization of primer concentrations and annealing temperatures ensured minimal amplification bias, even at ultralow parasitemia. The Gel electrophoresis and sequencing validation confirmed robust amplification specificity across P. falciparum strains, with less than 3.7% nonspecific mapping in non-falciparum species, demonstrating specificity critical for field applications.
The panel demonstrates exceptional sensitivity, with detection thresholds as low as 0.001% (DBS) and 0.0001% (VB) parasitemia for resistance markers, exceeding standard surveillance detection limits in malaria-endemic regions. Furthermore, this high level of sensitivity strongly supports the assay’s reliability in identifying minority alleles within complex polyclonal infections. Significantly, the absence of statistical differences in the rank order of amplicon abundance between mock and field samples indicates that PCR efficiency variations among targets are consistent and can be effectively controlled via standardized amplification protocols. Comparison of amplicon abundance rankings between mock and field samples revealed high concordance, demonstrating that laboratory-prepared mock samples can effectively replicate real-world sampling conditions. Differences in amplicon abundance rankings between mock and field samples likely reflect natural infection backgrounds such as variable parasite densities, polyclonal infections, and genomic sequence variation. A study also observed this phenomenon, indicating sample-set dependent effects [31]. Specifically, Pfcrt remained the lowest abundance for both mock and field samples, attributable to its hyper-AT-rich sequence (80.33%, A + T) and long homopolymers. This highlights the importance of validating surveillance tools across diverse field backgrounds to account for genetic architecture.
The long-amplicon panel demonstrates that the robust performance in low-parasitemia DBS samples is remarkable. DBS-based surveillance is logistically advantageous in resource-limited settings [45, 46], however, existing methods often struggle to yield adequate sequencing data due to low DNA extraction efficiency. Our protocol achieved > 100 × coverage for all targets in VB sample at 0.001% parasitemia, proving feasible for cost-effective, high-throughput applications. The slight decline in Pfcrt coverage at 0.0001% parasitemia in VB mock samples primarily stems from the combined effects of its hyper-AT-rich sequence (80.33%, A + T), exceptionally long amplicon length (2481 bp), long homopolymer and very low parasitemia, all of which significantly reduce amplification efficiency [31, 39]; future iterations could address this by refining primer designs or adding spike-in controls for low-abundance targets.
The inclusion of Pfcoronin, Pfubp1, and Pfap2μ genes are associated with ART-R in African [47, 48] and imported cases [21].This establishes our panel as a vital tool for monitoring resistance evolution beyond the Pfk13 locus. Detecting mutations in these genes, even without Pfk13 variants, implies that relying solely on Pfk13 may underestimate ART-R prevalence in certain settings. Furthermore, the integrating Pfmdr1 and Pfcrt enables simultaneous partner-drug-resistance surveillance, which is critical for evaluating ACT efficacy as lumefantrine and piperaquine resistance spreads [49]. By capturing haplotype diversity across full-length genes, the panel offers insights into resistance mechanisms and potential compensatory mutations, which are essential for predicting resistance trajectories.
Although the long-amplicon methodology represents a significant technical advancement, some limitations still need consideration. First, the current design focuses only on six genes and adding more resistance loci (e.g., Pfatp6 for artemisinin [50] or Pfpm2/3 for piperaquine [51]) could further enhance its utility. Second, the filed sample (n = 16) only included Democratic Republic of Congo migrant workers. Larger studies across different geographic areas are needed to assess its performance in various transmission settings. Third, as it relies on Illumina sequencing, its real-time use in the field is limited. Future integration with portable platforms like nanopore sequencing might allow decentralized, near-real-time resistance monitoring.
Conclusions
This study demonstrates that an optimized long-amplicon sequencing panel can highly sensitively, specifically and comprehensively detect antimalarial resistance markers. Our method addresses limitations in existing surveillance tools by offering a scalable solution to monitor the evolution of resistance and inform treatment policy decisions. As resistance spreads, integrating these panels into routine surveillance will be critical for sustaining global malaria control achievements.
Supplementary Information
Supplementary file 1. Table S1. Sequence of all amplicon primers. Table S2. PCR protocol. Table S3. Consumable cost based on multiplex targeted amplicon sequencing. Table S4. Comparison of performance of different panels. Fig. S1. Amplified product gel electrophoresis. Fig. S2. Sequencing quality of different plasmodium. Fig. S3. Order of amplicon abundances for the long-amplicon panel in mock and field samples. Fig. S4. Difference test between mock samples and filed samples
The reference list from the paper itself. Each links out to its DOI / PubMed record.
- 1Group WKG-PS. Association of mutations in the Plasmodium falciparum Kelch 13 gene (Pf 3D 7_1343700) with parasite clearance rates after artemisinin-based treatments-a WWARN individual patient data meta-analysis. BMC Med. 2019;17:110.1186/s 12916-018-1207-3PMC 633580530651111 · doi ↗ · pubmed ↗
- 2Malaria GEN, Abdel Hamid M, Abdelraheem M, Acheampong D, Ahouidi A, Ali M, et al. Pf 7: an open dataset of Plasmodium falciparum genome variation in 20,000 worldwide samples [version 1; peer review: 3 approved]. 2023;8 22.10.12688/wellcomeopenres.18681.1PMC 997165436864926 · doi ↗ · pubmed ↗