KMT2A alterations in acute myeloid leukemia: a proposed genetic risk model and transplantation outcomes
Li Chen, Jianfeng Li, Yongmei Zhu, Xiangqin Weng, Yuting Huang, Lingling Zhao, Guang Yang, Ting Huang, Ran An, Zhiyin Liu, Xiaoqian Xu, Yubao Chen, Qiuhua Huang, Kankan Wang, Sujiang Zhang

TL;DR
This study identifies distinct genetic subgroups in KMT2A-altered AML and proposes a new risk model to guide treatment decisions based on molecular profiles and transplantation outcomes.
Contribution
A novel three-tier genetic risk model for KMT2A-altered AML integrating fusion partner and PTD status is proposed, showing improved survival stratification.
Findings
KMT2A-r cases are enriched in RAS mutations, while KMT2A-PTD has more epigenetic alterations.
Allogeneic hematopoietic cell transplantation significantly improves survival, especially in high-risk groups.
The proposed risk model shows 3-year OS rates of 78.1%, 50.5%, and 34.9% for intermediate, high, and very high-risk groups, respectively.
Abstract
KMT2A-altered acute myeloid leukemia (AML) comprises rearrangements (KMT2A-r), partial tandem duplications (KMT2A-PTD), and dual alterations (KMT2A-r/PTD). In this study of 125 patients, these subgroups exhibited distinct molecular profiles: KMT2A-r cases were enriched in RAS pathway mutations, whereas KMT2A-PTD showed a higher burden of epigenetic alterations. Although overall survival (OS) and event-free survival (EFS) did not differ significantly between subgroups, prognosis was strongly influenced by fusion partners. MLLT3/ELL-rearranged cases showed superior outcomes, but concurrent KMT2A-PTD abrogated this survival advantage, AFDN and other fusions showed poor outcomes. We therefore propose a revised three-tier risk model integrating fusion partner and PTD status, which significantly stratified patient outcomes. The intermediate-risk group (MLLT3/ELL without PTD) had a 3-year OS…
Genes, proteins, chemicals, diseases, species, mutations and cell lines named across the full text — each resolved to its canonical identifier and authoritative record.
Click any figure to enlarge with its caption.
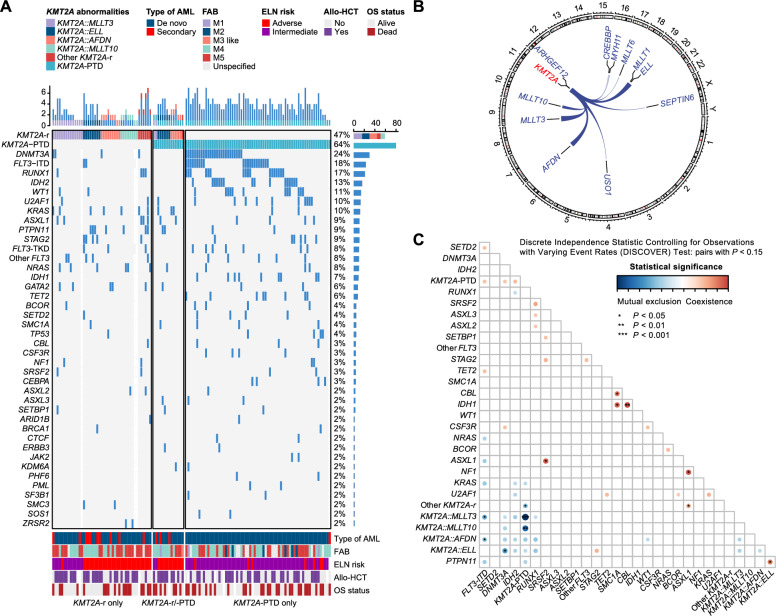 Figure 1
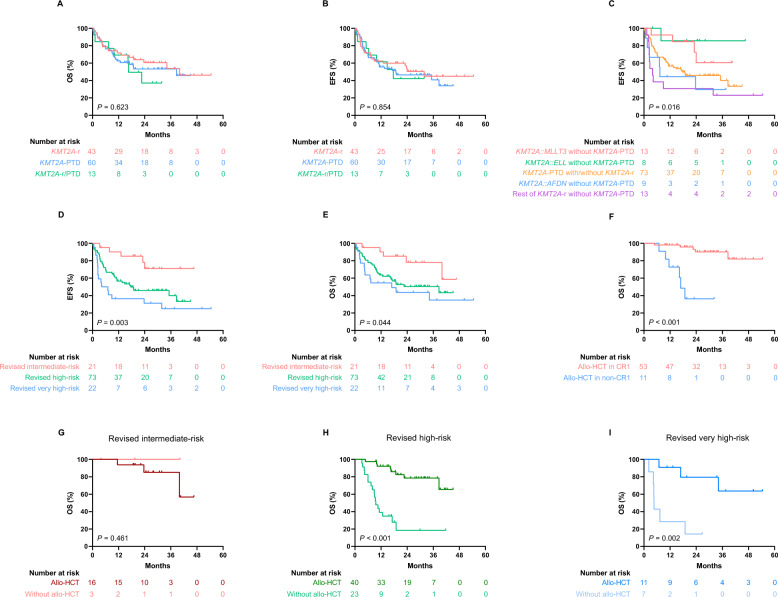 Figure 2
- —https://doi.org/10.13039/100017950Shanghai Municipal Health Commission
- —https://doi.org/10.13039/501100001809National Natural Science Foundation of China
- —Shanghai Sailing Program
Peer Reviews
No public reviews on file for this paper yet. If you reviewed it on a platform where reviews are public (OpenReview, ICLR, NeurIPS, ICML), you can paste yours below so the community can read it here.
Videos
No videos yet. Explain this paper in a talk, walkthrough, or lecture? Add one.
Taxonomy
TopicsAcute Myeloid Leukemia Research · Myeloproliferative Neoplasms: Diagnosis and Treatment · Hematopoietic Stem Cell Transplantation
To the editor:
Lysine methyltransferase 2A (KMT2A) alterations constitute a heterogeneous group in acute myeloid leukemia (AML) [1]. We characterized 125 AML patients treated at our center between February 2019 and May 2023, classifying them into KMT2A rearrangements (KMT2A-r, 36%), partial tandem duplications* (KMT2A*-PTD, 53%), or dual alterations (KMT2A-r/PTD, 11%), each exhibiting distinct clinical and molecular profiles (Fig. 1A).Fig. 1. Genomic characterization in KMT2A-related acute myeloid leukemia (AML). A Genetic landscape in KMT2A-related AML. Each column represents a patient and each row corresponds to a gene. The color of each rectangle represents the type of gene mutation. B A circos plot of all KMT2A fusions. Chromosomes are arranged in a clockwise manner, and fusion gene pairs are connected using ribbons (for recurrent events) or lines (for single events). C Heatmap of mutual exclusion and co-occurrence patterns between KMT2A alterations and sequence variants showing representative gene pairs (P < 0.15). The heatmap shows the statistically significant level of co-occurrence and mutual exclusivity analysis. Blue represents mutual exclusivity, while red represents co-occurrence. The darker the color, the more significant the statistical analysis of co-occurrence and mutual exclusivity
KMT2A-r patients were younger and had a higher incidence of secondary AML, lower platelet counts, and higher bone marrow blast percentages than KMT2A-PTD patients, while KMT2A-r/PTD showed intermediate features (Table S1).
Genomic profiling revealed MLLT3 (31%), AFDN (20%), ELL (18%), and MLLT10 (18%) as major KMT2A-r fusions, with KMT2A-r/PTD enriched in ELL (43%) and AFDN (36%) (Fig. 1B, S1; Table S2). Despite intermediate clinical features, KMT2A-r/PTD molecularly resembled KMT2A-r, suggesting KMT2A-r initiates leukemia and KMT2A-PTD accelerates progression [2–4]. Methods are detailed in Supplementary Materials. KMT2A-r cases exhibited fewer mutations but were enriched for RAS pathway alterations (KRAS/NRAS/PTPN11; cumulative 47.6%) [4–6]. In contrast, KMT2A-PTD cases showed higher mutational burden, especially in epigenetic regulators (e.g., DNMT3A 40%, FLT3-ITD 32.3%, RUNX1 26.2%, IDH2 24.6%), consistent with clonal evolution from pre-leukemic lesions [7–9]. KMT2A-r/PTD retained a RAS-dominant signature (KRAS 21.4%, PTPN11 14.3%, NRAS 7.1%), further supporting the hierarchical model (Table S3, Fig. 1A). Co-mutated patterns are visualized in Fig. 1C and S2. We found 6 mutually exclusive and 7 co-occurring gene pairs (P < 0.05). KMT2A-PTD strongly excluded both KMT2A::MLLT3 and KMT2A::MLLT10, even after statistical correction (Q < 0.05). By European LeukemiaNet (ELN) 2022 criteria, 59% and 41% of patients were intermediate- and adverse-risk, respectively (Table S1; Fig. 1A).
Among 120 treated patients, 77.5% received intensive and 22.5% less-intensive chemotherapy (Table S4). The composite complete remission rate was 54% after initial induction, increasing to 69% post-second induction, with no significant differences across subgroups or treatments (Table S1, S5).
With median follow-up of 16.9 months (range 0.2–54.5), the cohort demonstrated 3-year overall survival (OS) of 51.2% (median: 38.6 months) and event-free survival (EFS) of 42.0% (median: 23.7 months), respectively. Neither ELN 2022 stratification nor KMT2A-altered subgroups showed significant differences in survival (Fig. S3; 2A-B). However, within KMT2A-r, prognosis was fusion-dependent: MLLT3/ELL fusions showed superior EFS (median not reached), whereas AFDN or others had poorer outcomes (median: 3.9, 7.3 months). Concurrent KMT2A-PTD abrogated the survival advantage of MLLT3/ELL fusions (median: 17.6 months, P = 0.016) (Fig. 2C). This may reflect KMT2A-PTD-mediated epigenetic dysregulation of HOXA genes, overriding the favorable biology of specific fusion partners [10].Fig. 2. Survival and transplant outcomes in KMT2A-altered acute myeloid leukemia (AML). A–C Kaplan–Meier curves comparing survival across molecular subtypes. D, E Survival analysis based on the revised three-tier risk model. F Impact of allogeneic hematopoietic cell transplantation (allo-HCT) on overall survival in patients receiving transplant in first complete remission (CR1) versus non-CR1 status. G–I Outcomes of allo-HCT within each revised risk subgroup
We therefore propose a revised three-tier risk model that significantly stratified survival. The intermediate-risk group (MLLT3/ELL-rearranged without PTD) exhibited a favorable 3-year OS of 78.1% (median not reached), compared to 50.5% (median: 38.6 months) in the high-risk group (all PTD), and 34.9% (median: 16.9 months) in the very high-risk group (other KMT2A-r) (P = 0.044). For EFS, rates were 71.0% (median not reached), 40.1% (median: 17.6 months), and 24.9% (median: 4.2 months), respectively (P = 0.003) (Fig. 2D–E). Time-dependent receiver operating characteristics analysis confirmed superior predictive accuracy over ELN 2022, with higher area under the curve values for both OS (0.632 versus 0.590) and EFS (0.637 versus 0.547) (Fig. S4). Exploratory analyses linked KRAS mutations in KMT2A-r (n = 6) and FLT3-TKD in KMT2A-PTD (n = 7) to shorter EFS (P < 0.05) but not OS (Fig. S5), though validation in larger cohorts was warranted due to limited sample size.
Allogeneic hematopoietic cell transplantation (allo-HCT) significantly improved survival versus non-HCT (3-year OS: 75.2% versus 22.5%; EFS: 66.1% versus 11.5%, both P < 0.001). Patients receiving allo-HCT in first complete remission (CR1; 78% of HCT cases) had superior outcomes, with a 32-month OS of 90.2% versus 36.4% for non-CR1 patients (P < 0.001) (Fig. 2F). The benefit of allo-HCT was confined to high-risk (P < 0.001) and very high-risk patients (P = 0.002), but not intermediate-risk cases (P = 0.461) (Fig. 2G–I). Multivariate analysis identified achieving CR after two induction cycles and allo-HCT receipt as independent favorable predictors for OS and EFS (Table S6).
Study limitations include small sample sizes in subgroups (e.g., KMT2A-r/PTD) and potential biases inherent to single-center retrospective designs.
These findings advocate for risk-adapted therapy in KMT2A-altered AML, prioritizing early transplantation in high-risk patients and novel agents like menin inhibitors.
Supplementary Information
Supplementary Material 1. Supplementary Material 2.
The reference list from the paper itself. Each links out to its DOI / PubMed record.