Depression and its Association With Cataract Status and Self-Perceived Burden of Elderly Patients With Cataract
Shanbo Zhou

TL;DR
This study finds that elderly cataract patients often experience depression, which is linked to their vision, self-perceived burden, and other factors like age and diabetes.
Contribution
The study identifies specific risk factors for depression in elderly cataract patients, including visual acuity, caregiver health, and diabetes.
Findings
Depression in elderly cataract patients is negatively correlated with visual acuity.
Age, caregiver health status, and diabetes are independent risk factors for depression.
Self-perceived burden is significantly positively correlated with depression scores.
Abstract
This study aimed to explore the status of depressive mood in elderly patients with cataract and its association with visual acuity and self-perceived burden (SPB). A total of 210 senile patients with cataract attending the Affiliated People’s Hospital of Ningbo University between January 2025 and May 2025 were assessed with the scale, and 197 valid samples were finally obtained. Data on general demographics, underlying disease and best corrected visual acuity in both eyes were collected. The SPB scale (SPBS) and the self-rating depression scale (SDS) were used to assess the psychological state of the patients. Comparisons between groups were conducted using one-way analysis of variance and the relationship among visual acuity level, SPBS and SDS was analysed. Multiple logistic regression was performed for variables with p < 0.1 in univariate analysis to identify independent risk…
Genes, proteins, chemicals, diseases, species, mutations and cell lines named across the full text — each resolved to its canonical identifier and authoritative record.
Click any figure to enlarge with its caption.
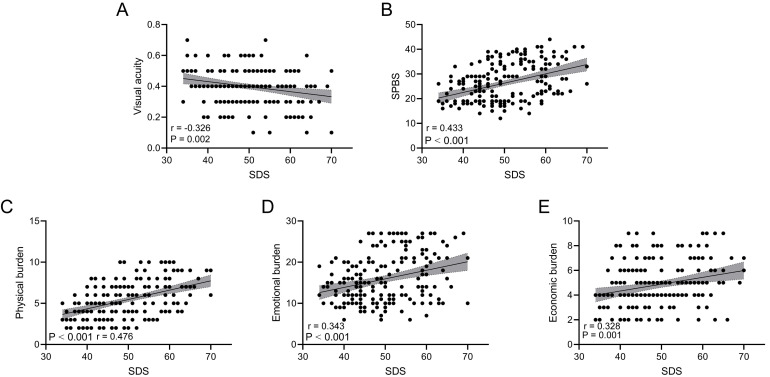 Fig. 1
| Variables | % | ||
| Sex | |||
| Male | 84 | 42.64 | |
| Female | 113 | 57.36 | |
| Age (years) | |||
| 80 | 40.61 | ||
| 117 | 59.39 | ||
| Visual acuity | |||
| 128 | 64.97 | ||
| 69 | 35.03 | ||
| Educational level | |||
| Primary school or below | 122 | 61.93 | |
| Junior high school | 62 | 31.47 | |
| Senior high school or above | 13 | 6.60 | |
| Marital status | |||
| Married | 126 | 63.96 | |
| Widowed | 65 | 32.99 | |
| Unmarried (never married, divorced or separated) | 6 | 3.05 | |
| Residence | |||
| Rural | 71 | 36.04 | |
| Urban | 126 | 63.96 | |
| Per capita household income (RMB, 1 RMB = 0.1392 USD) | |||
| 44 | 22.34 | ||
| 3000–5000 | 105 | 53.30 | |
| 48 | 24.37 | ||
| Family caregiver | |||
| Spouse | 53 | 26.90 | |
| Children | 108 | 54.82 | |
| Other | 36 | 18.27 | |
| Health status of the caregiver | |||
| Healthy | 133 | 67.51 | |
| Unhealthy | 64 | 32.49 | |
| Type of reimbursement method | |||
| Resident insurance | 75 | 38.07 | |
| Employee insurance | 122 | 61.93 | |
| Smoking | |||
| No | 98 | 49.75 | |
| Yes | 99 | 50.25 | |
| Alcohol consumption | |||
| No | 114 | 57.87 | |
| Yes | 83 | 42.13 | |
| Diabetes | |||
| No | 87 | 44.16 | |
| Yes | 110 | 55.84 | |
| Hypertension | |||
| No | 68 | 34.52 | |
| Yes | 129 | 65.48 | |
| Dyslipidaemia | |||
| No | 108 | 54.82 | |
| Yes | 89 | 45.18 | |
| History of stroke | |||
| No | 161 | 81.73 | |
| Yes | 36 | 18.27 | |
| Number of underlying diseases | |||
| 0 | 15 | 7.61 | |
| 1 | 56 | 28.43 | |
| 2 | 75 | 38.07 | |
| 3 | 46 | 23.35 | |
| 5 | 2.54 | ||
| Variables | Range (min–max) | mean | |
| SDS | 34–70 | 49.60 | |
| SPBS | 12–44 | 26.15 | |
| Physical burden | 2–10 | 5.42 | |
| Emotional burden | 6–27 | 15.86 | |
| Economic burden | 2–9 | 4.86 | |
| Variables | % | mean | ||
| SDS | ||||
| Normal | 109 | 55.33 | 43.32 | |
| Mild depression | 59 | 29.95 | 54.58 | |
| Moderate depression | 27 | 13.71 | 62.59 | |
| Severe depression | 2 | 1.02 | 70.00 | |
| SPBS | ||||
| No burden | 66 | 33.50 | 17.91 | |
| Mild burden | 71 | 36.04 | 25.45 | |
| Moderate burden | 53 | 26.90 | 35.36 | |
| Severe burden | 7 | 3.55 | 41.14 | |
| Variables | Non-depression group ( | Depression group ( | t/ | ||
| Sex, | 0.52 | 0.473 | |||
| Male | 44 (40.37) | 40 (45.45) | |||
| Female | 65 (59.63) | 48 (54.55) | |||
| Age, mean | 68.45 | 71.06 | –2.34 | 0.020 | |
| Visual acuity, mean | 0.42 | 0.38 | 2.14 | 0.033 | |
| Educational level, | 0.03 | 0.987 | |||
| Primary school or below | 68 (62.39) | 54 (61.36) | |||
| Junior high school | 34 (31.19) | 28 (31.82) | |||
| Senior high school or above | 7 (6.42) | 6 (6.82) | |||
| Marital status, | - | 0.254 | |||
| Married | 75 (68.81) | 51 (57.95) | |||
| Widowed | 31 (28.44) | 34 (38.64) | |||
| Unmarried (never married, divorced or separated) | 3 (2.75) | 3 (3.41) | |||
| Residence, | 0.96 | 0.327 | |||
| Rural | 36 (33.03) | 35 (39.77) | |||
| Urban | 73 (66.97) | 53 (60.23) | |||
| Per capita household income (RMB, 1 RMB = 0.1392 USD), | 2.20 | 0.333 | |||
| 23 (21.10) | 21 (23.86) | ||||
| 3000–5000 | 55 (50.46) | 50 (56.82) | |||
| 31 (28.44) | 17 (19.32) | ||||
| Family caregiver, | 0.28 | 0.869 | |||
| Spouse | 30 (27.52) | 23 (26.14) | |||
| Children | 58 (53.21) | 50 (56.82) | |||
| Other | 21 (19.27) | 15 (17.05) | |||
| Health status of the caregiver, | 3.85 | 0.050 | |||
| Healthy | 80 (73.39) | 53 (60.23) | |||
| Unhealthy | 29 (26.61) | 35 (39.77) | |||
| Type of reimbursement method, | 2.64 | 0.104 | |||
| Resident insurance | 47 (43.12) | 28 (31.82) | |||
| Employee insurance | 62 (56.88) | 60 (68.18) | |||
| Smoking, | 1.87 | 0.171 | |||
| No | 59 (54.13) | 39 (44.32) | |||
| Yes | 50 (45.87) | 49 (55.68) | |||
| Alcohol consumption, | 0.10 | 0.755 | |||
| No | 62 (56.88) | 52 (59.09) | |||
| Yes | 47 (43.12) | 36 (40.91) | |||
| Diabetes, | 2.86 | 0.091 | |||
| No | 54 (49.54) | 33 (37.50) | |||
| Yes | 55 (50.46) | 55 (62.50) | |||
| Hypertension, | 0.17 | 0.678 | |||
| No | 39 (35.78) | 29 (32.95) | |||
| Yes | 70 (64.22) | 59 (67.05) | |||
| Dyslipidaemia, | 0.05 | 0.828 | |||
| No | 59 (54.13) | 49 (55.68) | |||
| Yes | 50 (45.87) | 39 (44.32) | |||
| History of stroke, | 3.33 | 0.068 | |||
| No | 94 (86.24) | 67 (76.14) | |||
| Yes | 15 (13.76) | 21 (23.86) | |||
| Number of underlying diseases, | 7.26 | 0.123 | |||
| 0 | 13 (11.93) | 2 (2.27) | |||
| 1 | 29 (26.61) | 27 (30.68) | |||
| 2 | 42 (38.53) | 33 (37.50) | |||
| 3 | 23 (21.10) | 23 (26.14) | |||
| 2 (1.83) | 3 (3.41) | ||||
| SPBS | 23.84 | 29.00 | –4.95 | ||
| Variables | Non-burden group | Burden group | t/ | ||
| Sex, | 0.43 | 0.513 | |||
| Male | 26 (39.39) | 58 (44.27) | |||
| Female | 40 (60.61) | 73 (55.73) | |||
| Age, mean | 68.08 | 70.39 | –2.16 | 0.032 | |
| Visual acuity, mean | 0.41 | 0.39 | 1.06 | 0.289 | |
| Educational level, | 1.45 | 0.484 | |||
| Primary school or below | 37 (56.06) | 85 (64.89) | |||
| Junior high school | 24 (36.36) | 38 (29.01) | |||
| Senior high school or above | 5 (7.58) | 8 (6.11) | |||
| Marital status, | - | 0.680 | |||
| Married | 42 (63.64) | 84 (64.12) | |||
| Widowed | 21 (31.82) | 44 (33.59) | |||
| Unmarried (never married, divorced or separated) | 3 (4.55) | 3 (2.29) | |||
| Residence, | 0.48 | 0.487 | |||
| Rural | 26 (39.39) | 45 (34.35) | |||
| Urban | 40 (60.61) | 86 (65.65) | |||
| Per capita household income (RMB, 1 RMB = 0.1392 USD), | 0.14 | 0.934 | |||
| 14 (21.21) | 30 (22.90) | ||||
| 3000–5000 | 35 (53.03) | 70 (53.44) | |||
| 17 (25.76) | 31 (23.66) | ||||
| Family caregiver, | 2.39 | 0.302 | |||
| Spouse | 16 (24.24) | 37 (28.24) | |||
| Children | 34 (51.52) | 74 (56.49) | |||
| Other | 16 (24.24) | 20 (15.27) | |||
| Health status of the caregiver, | 2.05 | 0.152 | |||
| Healthy | 49 (74.24) | 84 (64.12) | |||
| Unhealthy | 17 (25.76) | 47 (35.88) | |||
| Type of reimbursement method, | 2.54 | 0.111 | |||
| Resident insurance | 20 (30.30) | 55 (41.98) | |||
| Employee insurance | 46 (69.70) | 76 (58.02) | |||
| Smoking, | 0.31 | 0.580 | |||
| No | 31 (46.97) | 67 (51.15) | |||
| Yes | 35 (53.03) | 64 (48.85) | |||
| Alcohol consumption, | 0.06 | 0.805 | |||
| No | 39 (59.09) | 75 (57.25) | |||
| Yes | 27 (40.91) | 56 (42.75) | |||
| Diabetes, | 5.70 | 0.017 | |||
| No | 37 (56.06) | 50 (38.17) | |||
| Yes | 29 (43.94) | 81 (61.83) | |||
| Hypertension, | 0.06 | 0.804 | |||
| No | 22 (33.33) | 46 (35.11) | |||
| Yes | 44 (66.67) | 85 (64.89) | |||
| Dyslipidaemia, | 4.75 | 0.029 | |||
| No | 29 (43.94) | 79 (60.31) | |||
| Yes | 37 (56.06) | 52 (39.69) | |||
| History of stroke, | 1.43 | 0.232 | |||
| No | 57 (86.36) | 104 (79.39) | |||
| Yes | 9 (13.64) | 27 (20.61) | |||
| Number of underlying diseases, | 2.93 | 0.569 | |||
| 0 | 7 (10.61) | 8 (6.11) | |||
| 1 | 16 (24.24) | 40 (30.53) | |||
| 2 | 28 (42.42) | 47 (35.88) | |||
| 3 | 13 (19.70) | 33 (25.19) | |||
| 2 (3.03) | 3 (2.29) | ||||
| SDS | 45.56 | 51.64 | –5.14 | ||
| Variables |
| S.E | Wald | Odds ratio (95% CI) | ||
| Age | 0.049 | 0.021 | 5.432 | 0.020 | 1.051 (1.008–1.095) | |
| Health status of the caregiver | ||||||
| Healthy | Reference | |||||
| Unhealthy | 0.677 | 0.340 | 3.964 | 0.046 | 1.968 (1.011–3.833) | |
| Diabetes | ||||||
| No | Reference | |||||
| Yes | 0.874 | 0.420 | 4.326 | 0.038 | 2.396 (1.052–5.459) | |
Peer Reviews
No public reviews on file for this paper yet. If you reviewed it on a platform where reviews are public (OpenReview, ICLR, NeurIPS, ICML), you can paste yours below so the community can read it here.
Videos
No videos yet. Explain this paper in a talk, walkthrough, or lecture? Add one.
Taxonomy
TopicsHealth and Wellbeing Research
Introduction
The prevalence of various chronic degenerative diseases in the elderly population continues to increase as the world’s population ages, and cataract has become one of the most important blinding and vision-impairing diseases [1]. Recent global estimates suggest that cataract accounts for more than 39% of the causes of blindness worldwide [2]. Cataract usually presents as a progressive clouding of the lens, and early symptoms may be as simple as blurred vision or reduced night vision, which can eventually lead to severe visual impairment or even blindness if not treated in time. The prevalence of cataract in people aged 60 years and older increases considerably with age and is often comorbid with chronic diseases such as diabetes and hypertension, which increase the burden on public health and social care systems [2, 3]. Therefore, medical interventions and support for cataract urgently need to consider the needs of patients and society to achieve comprehensive health management.
The prevalence of depression and other adverse psychological conditions is significantly higher in elderly patients with cataract than in people without visual impairment due to reduced self-care, reduced social activities and weakened role functioning [4]. Patients with cataract who have low visual acuity have severe depressive mood and psychological distress, and this association is more pronounced in groups with advanced age and comorbid conditions and those without social support [4, 5]. Delayed surgical treatment, pessimistic expectations of postoperative outcomes and fear of decreased quality of life may be risk factors for depressive symptoms in patients with cataract [5, 6, 7]. Much research has focused on describing the association between cataract and depression, but the specific mechanisms of this association have been less explored. In particular, how vision loss may trigger depression by affecting patients’ psychological state and social support remains unclear.
The concept of self-perceived burden (SPB) has received increasing attention in recent years in many studies of elderly patients, especially in oncology research [8, 9]. It refers to negative emotions, such as guilt and shame, experienced by patients because of concerns that their illness or functional deficits will place an additional burden on their caregivers, family or society. Several surveys of elderly patients with chronic diseases and functional impairments have shown that SPB is positively correlated with depression level; increasing SPB not only adversely affects patients’ adherence to treatment but also weakens their social adjustment and sense of self-worth [10, 11]. Dry eye syndrome is associated with severe SPB and a high burden of psychological stress [12]. For elderly patients with cataract who require long-term care, gradually increasing visual impairment leads to further increase in their need for external help, which may lead to varying degrees of SPB; however, the relationship among cataract disease, SPB and depression has not been studied yet.
This study focused on elderly patients with cataract and examined the associations between visual acuity level and SPB and between depression and SPB. We quantified visual acuity to objectively assess the severity of cataract and combined it with SPB to determine their roles in depression in elderly patients with cataract. Results may provide a scientific basis for clinical staff to identify high-risk groups and develop multidimensional interventions. This work reveals new ideas for elucidating the causes of depression in the elderly and for establishing comprehensive prevention and treatment strategies.
Methods
Patients
This study included 210 elderly patients diagnosed with cataract at the Affiliated People’s Hospital of Ningbo University between January 2025 and May 2025. During cataract screening, the examiner used a direct ophthalmoscope to assess the red reflex from approximately 30 cm away from the patient’s pupil. Lens opacities were identified as localised dark areas against the uniform red reflex, indicating the presence of subtle lens changes. Large or dense opacities could lead to a diminished or absent red reflex. A slit-lamp biomicroscope was employed for detailed evaluation of the lens to determine the type (e.g., cortical, nuclear or posterior subcapsular), location and severity of opacification [13]. The inclusion criteria were as follows: diagnosis of cataract, age 60 years, basic communication skills, ability to cooperate in completing the questionnaire and voluntary participation. The exclusion criteria were combination of other serious eye diseases, presence of serious mental illness or cognitive impairment, malignant tumour and other serious organ damage. The study was approved by the Ethics Committee of the Affiliated People’s Hospital of Ningbo University (approval number: 2025-038), and all participants signed an informed consent form. The study was conducted in accordance with the principles of the Declaration of Helsinki.
Data Collection
The following data were collected: demographic characteristics such as sex, age, education level, marital status, place of residence (urban and rural) and per capita household income; lifestyle habits such as smoking and drinking; number of chronic diseases such as dyslipidaemia, hypertension, diabetes and underlying diseases; and patient’s primary caregiver and their health status and type of health insurance billing. This study defined the condition of patients with cataract using best corrected visual acuity, which was measured by uniformly trained examiners with an international standard visual acuity chart under standard lighting conditions and recorded as a decimal visual acuity (0.1–1.0).
Scales
Prior to the start of the study, investigators received uniform training to familiarise them with the content of the scale and the interview process. During the conduct of the study, patients were assessed using the scale in an outpatient or inpatient setting. For respondents with limited vision or literacy, investigators read aloud and recorded patient’s responses item by item to ensure concise language and accurate explanations when reading the questions to minimise information bias.
The SPB Scale (SPBS, Cronbach’s alpha = 0.91) was used to assess negative emotions, such as guilt and remorse, felt by patients when they may be burdened by the disease to their caregivers and families. The scale consists of 10 items (two items in the physical burden dimension, six items in the emotional burden dimension and two items in the economic burden dimension) and is scored on a 5-point Likert scale. The total score is 50, and higher scores indicate greater SPB. A total score of 20 indicates no burden, a score of 20–29 indicates mild burden, a score of 30–39 indicates moderate burden and a score of 40 indicates severe burden [14, 15].
We assessed patients’ depression by using the Self-Rating Depression Scale (SDS, Cronbach’s alpha = 0.78), which consists of 20 items, each rated on a scale of 1–4. The total score is 80, and a standardised score was obtained by multiplying the scale score by 1.25. A score of 50–59 (standardised) is usually considered mild depression, 60–69 indicates moderate depression and 70 indicates severe depression [16, 17].
Statistical Analysis
Data were cross-checked by two researchers using Excel software (version 2021, Microsoft, Redmond, WA, USA) and analysed using Statistical Product and Service Solutions 26.0 (IBM, Armonk, NY, USA). All measurement data were tested for normality by using the Shapiro–Wilk test. The data had normal distribution and were therefore expressed as mean standard deviation (SD). Categorical data were presented as number of cases (n) and percentage (%). For continuous variables, independent samples t-tests were used for two-group comparisons. For categorical variables, Chi-squared tests or Fisher’s exact tests were used as appropriate. Pearson correlation analysis was used to evaluate the relationship among visual acuity level, SPB and depression by determining their correlation coefficients. Multiple logistic regression was used to analyse risk factors for the development of depression in patients with cataract. No significant multicollinearity was detected among the independent variables, as all variance inflation factors were below 3.0. p 0.05 indicates a statistically significant difference.
Results
Patient Characteristics
A total of 197 white elderly patients with cataract had complete information and successfully completed the scale. As shown in Table 1, 42.64% of the patients were male, 59.39% were in the age group of 65 years and 64.97% had visual acuity 0.5. Most of the patients had a low level of education, lived in urban areas and had a per capita household income of 3000–5000 RMB (1 RMB = 0.1392 USD). In terms of chronic diseases, 55.84% of the patients had diabetes mellitus, 65.48% had hypertension and 45.18% had dyslipidaemia. Moreover, 38.07% had 2 chronic diseases and 2.54% had 4 or more chronic diseases.
SDS and SPBS Scores
Table 2 shows that the range of SDS scores was 34–70, with a mean value of 49.60 8.33, and that of the total SPBS scores was 12–44, with a mean value of 26.15 7.69. The scores for the three dimensions of SPBS were as follows: emotional burden, 15.86 5.93 (range 6–27); physical burden, 5.42 2.12 (range 2–10); and economic burden, 4.86 1.92 (range 2–9).
Table 2.: Self-perceived burden scale and self-rating depression scale scores of the patients.
SDS and SPBS Classification of Patients
Based on the classification criteria of SDS and SPBS (Table 3), 55.33% of the patients had SDS within the normal range, 29.95% were mildly depressed, 13.71% were moderately depressed and 1.02% were severely depressed. In terms of SPBS, 33.50% of the patients had no significant burden, 36.04% had mild burden, 26.90% had moderate burden and 3.55% had severe burden.
Table 3.: Distribution and mean scores of self-rating depression scale and self-perceived burden scale by severity levels.
Univariate Analysis of Depressed and Non-Depressed Groups
The depressed and non-depressed groups were defined according to the criteria with SDS scores 50 as the cutoff (Table 4). Age (p = 0.020), visual acuity level (p = 0.033) and caregiver health status (p = 0.050) were significantly different between the two groups. Factors such as diabetes mellitus (p = 0.091) and history of stroke (p = 0.068) had slightly larger p-values but remained less than 0.1. In this regard, their potential effects on depression need to be considered in subsequent multivariate analyses.
Table 4.: Univariate analysis between depression and non-depression groups.
Univariate Analysis Between Burden and Non-Burden Groups
As shown in Table 5, a total SPBS score 20 was defined as the burden group (mild and above). Age (p = 0.032), diabetes (p = 0.017) and dyslipidaemia (p = 0.029) were significantly different between the burden and non-burden groups. The other indicators had no significant difference between the two groups.
Correlation Analysis of SDS With Visual Acuity and SPBS
Fig. 1 shows the scatter distribution and regression trends between SDS scores and visual acuity, total SPBS score and its three dimensions. The results showed that SDS was negatively correlated with visual acuity (Fig. 1A, p = 0.002, r = –0.326) and significantly positively correlated with the total SPBS score (Fig. 1B, p 0.001, r = 0.433) as well as the physical burden (Fig. 1C, p 0.001, r = 0.476), emotional burden (Fig. 1D, p 0.001, r = 0.343) and economic burden (Fig. 1E, p = 0.001, r = 0.328) of SPBS. This finding indicates that patients with higher levels of depression tended to have lower levels of visual acuity and higher SPB (including all dimensions). All reported p values and correlation coefficients were obtained from analyses adjusted for potential confounders, including age and educational level.
Correlation analysis of self-rating depression scale (SDS) with visual acuity and self-perceived burden scale (SPBS). (A) Scatterplot of correlation between visual acuity and SDS. (B) Scatterplot of correlation between SPBS score and SDS. (C) Scatterplot of correlation between physical burden score and SDS. (D) Scatterplot of correlation between emotional burden score and SDS. (E) Scatterplot of correlation between economic burden score and SDS.
Multiple Logistic Regression Analysis of Depression
Variables with p 0.1 in Table 4 (age, visual acuity, caregiver health status, diabetes mellitus and history of stroke) were included in multiple logistic regression. These variables were coded as follows: caregiver health status (0 = healthy, 1 = unhealthy), diabetes mellitus (0 = no, 1 = yes) and history of stroke (0 = no, 1 = yes). Age and visual acuity were treated as continuous variables. As shown in Table 6, the factors with independent effects on depression included age (OR = 1.051, p = 0.020), caregiver health status (OR = 1.968, p = 0.046) and diabetes (OR = 2.396, p = 0.038). These results suggest that older patients with cataract and poor caregiver health and comorbid diabetes are more likely to be depressed.
Table 6.: Multiple logistic regression analysis of depression in patients with cataract.
Discussion
This study focused on elderly patients with cataract and analysed three aspects of visual acuity level, depressive status and SPB. The results revealed a high percentage of comorbid depression and a prevalence of SPB. Moreover, SPB was significantly and positively correlated with depression. Multifactorial analysis further identified age, caregiver health status and diabetes as independent risk factors for depression.
The SDS scores of more than 40% of the patients reached the threshold for depression, which is consistent with previous findings that elderly patients with cataract are vulnerable to psychological problems [2, 4, 5]. As lens clouding progresses, patients often experience a decline in visual acuity and a limitation of daily activities. The patients are also susceptible to anxiety, loneliness and reduced self-efficacy. Moreover, persistent visual impairment can exacerbate depression if patients do not undergo surgery or effective intervention in a timely manner [7, 18]. Thus far, the relationship between visual acuity levels and depression in patients with cataract remains a subject of debate. Early studies indicated that patients with poor preoperative visual acuity exhibited a nearly 60% elevated risk of depression compared with patients with better visual acuity [5, 19]. However, another study found no significant association between the severity of visual impairment and the risk of depression in patients with cataract [20]. The present study reported a significant negative correlation between visual acuity level and depression and that patients in the depressed group had significantly lower visual acuity than patients in the non-depressed group, suggesting a strong correlation between visual acuity status and mood disorders. The inconsistent findings regarding the association between visual acuity and depression may stem from multiple underlying mechanisms. First, visual impairment can directly limit daily activities and social participation, leading to social isolation and reduced self-efficacy, which are known risk factors for depression [21]. Second, the neural pathway hypothesis suggests that cataract and depression may share common neurobiological substrates, such as dysregulation of the hypothalamic–pituitary–adrenal axis or chronic inflammation [22]. Third, the psychological impact likely follows a threshold effect, where depression risk increases significantly only when visual acuity deteriorates beyond a certain functional level (e.g., difficulty in recognising faces). This phenomenon could explain why some studies with predominantly mild impairment cases failed to detect significant associations [20].
In this study, the SPBS was utilised to evaluate the psychological burden of guilt, guilt and worry that patients may experience due to their condition. Approximately two-thirds of the patients exhibited varying degrees of SPB ( 20 points), and that the total SPBS scores and the dimensions (physical, emotional, and, economic) were significantly associated with depression. The concept of SPB was initially proposed in studies of cancer and other major or life-threatening diseases and has gradually expanded to the field of chronic diseases and dysfunction [8, 23, 24]. Patients with ocular diseases who frequently require assistance from family or society during the course of their illnesses are more likely to have negative self-perceptions regarding finances, caregiving and emotions. These adverse emotions have been identified as significant triggers for depression [12, 25]. The present findings are consistent with these perspectives, suggesting that SPB can be a significant dimension in the psychological assessment of elderly patients with cataract.
Multiple logistic regression showed that older patients with advanced age had a significantly higher risk of depression, which may be related to factors such as chronic diseases that increase with age and diminished social roles. Previous studies also found a significantly higher risk of anxiety and depression in older patients with cataract [6, 26, 27]. Poor caregiver health also emerged as an independent risk factor for depression. When family or primary caregivers are in poor health themselves, patients may have more difficulty accessing external support and may worry about their caregiver’s health, thereby increasing psychological distress and negative emotions [28]. Interestingly, the present study did not find a significant effect of vision level on the final multiple regression model possibly because the sample size was not sufficiently large to highlight its independent contribution. Diabetes mellitus was also included as an independent risk factor possibly because it is a disease that predisposes patients to depressive symptoms; moreover, poor long-term glycaemic control and complications such as retinopathy resulting from this disease may further reduce ocular conditions and quality of life in older adults, making them more susceptible to or have exacerbating depressive moods [29, 30, 31].
Routine ocular assessment and surgical planning for elderly patients with cataract should be accompanied by evaluation of psychosocial status and social support needs. Based on our findings, we propose strategies to mitigate SPB in elderly patients with cataract. Firstly, psychosocial support interventions should focus on reducing patients’ perceived burden through caregiver training. Educating family members on effective communication and caregiving skills can alleviate patients’ guilt about relying on others. For example, structured programs that emphasise shared decision-making in treatment plans may enhance patients’ sense of autonomy. Secondly, vision rehabilitation services could address the root cause of SPB by improving functional vision. Early referral to low-vision clinics for assistive devices (e.g., magnifiers, electronic aids) may reduce dependence on caregivers, thereby decreasing physical and emotional burden [3]. Surgical intervention for cataract should also be prioritised to restore vision and mitigate long-term SPB. Thirdly, multidisciplinary mental health support is warranted, particularly for patients with comorbid diabetes or older age. Psychologists should be integrated into ophthalmology care teams to provide cognitive–behavioural therapy to help reframe negative self-perception.
This study has some limitations. Firstly, it is a single-centre study, so multi-centre studies or interventional randomised controlled trials are necessary to verify causal inference. Some of the scale (e.g., SDS, SPBS) are self-assessment tools. Future studies should consider the introduction of clinical diagnostic scales or objective examination indicators. They should also expand the sample size and conduct follow up to further explore the dynamic evolution of the depression status of elderly patients with cataract. Furthermore, given the substantial impact of caregivers’ health status on patients’ psychology, caregivers’ psychological characteristics should be assessed to investigate the interplay between family environment, social support, accessibility of medical resources and other factors. This endeavour will provide a comprehensive foundation for management of the elderly population with cataract. Finally, the present study used only ‘best-corrected visual acuity’ for visual acuity assessment and did not distinguish between monocular and binocular visual impairment. This method of assessment may simplify the impact of vision loss to some extent because unilateral and bilateral visual impairments may have different effects on patients’ daily functioning and psychological distress. Future studies should differentiate between monocular and binocular visual impairment to fully assess the impact of vision loss on patients’ psychological status.
Conclusion
Elderly patients with cataract have a high prevalence of depression, and a significant association exists between SPB and depression. Visual acuity level, age, health status of caregivers and comorbid diabetes have a significant impact on the risk of depression.
Availability of Data and Materials
All experimental data included in this study can be obtained by contacting the first author if needed.
The reference list from the paper itself. Each links out to its DOI / PubMed record.
- 1Hashemi H Pakzad R Yekta A Aghamirsalim M Pakbin M Ramin S et al Global and regional prevalence of age-related cataract: a comprehensive systematic review and meta-analysis Eye (London, England) 2020341357137010.1038/s 41433-020-0806-332055021 PMC 7376226 · doi ↗ · pubmed ↗
- 2Vision Loss Expert Group of the Global Burden of Disease Study, GBD 2019 Blindness and Vision Impairment Collaborators Global estimates on the number of people blind or visually impaired by cataract: a meta-analysis from 2000 to 2020 Eye (London, England) 2024382156217210.1038/s 41433-024-02961-138461217 PMC 11269584 · doi ↗ · pubmed ↗
- 3Ang MJ Afshari NA Cataract and systemic disease: A review Clinical & Experimental Ophthalmology 20214911812710.1111/ceo.1389233426783 · doi ↗ · pubmed ↗
- 4Chen PW Liu PPS Lin SM Wang JH Huang HK Loh CH Cataract and the increased risk of depression in general population: a 16-year nationwide population-based longitudinal study Scientific Reports 2020101342110.1038/s 41598-020-70285-732770101 PMC 7414888 · doi ↗ · pubmed ↗
- 5Freeman EE Gresset J Djafari F Aubin MJ Couture S Bruen R et al Cataract-related vision loss and depression in a cohort of patients awaiting cataract surgery Canadian Journal of Ophthalmology. Journal Canadien D’ophtalmologie 20094417117610.3129/i 09-00119491951 · doi ↗ · pubmed ↗
- 6Wang T Li H Cao Q Age-related cataract without surgery is related to exacerbated depression symptoms: a cross-sectional study of Chinese adults from Anhui, China Frontiers in Medicine 202411148370910.3389/fmed.2024.148370939544383 PMC 11560422 · doi ↗ · pubmed ↗
- 7Wang S Du Z Lai C Seth I Wang Y Huang Y et al The association between cataract surgery and mental health in older adults: a review International Journal of Surgery (London, England) 20241102300231210.1097/JS 9.000000000000110538668662 PMC 11020056 · doi ↗ · pubmed ↗
- 8Saji A Oishi A Harding R Self-perceived Burden for People With Life-threatening Illness: A Qualitative Systematic Review Journal of Pain and Symptom Management 202365 e 207e 21710.1016/j.jpainsymman.2022.10.01636368570 · doi ↗ · pubmed ↗