Irradiance dataset in the south of Colombia from 2013 to 2023 in 5-minutes intervals
John Barco-Jiménez, Daniel Rosero, Andrés Zambrano, Francisco Eraso-Checa, Miller Ruales, José Camilo Eraso

TL;DR
This paper introduces a detailed 11-year irradiance dataset from southern Colombia, useful for solar energy forecasting and system design.
Contribution
The paper provides a rigorously preprocessed, high-resolution irradiance dataset spanning 2013 to 2023 for San Juan de Pasto, Colombia.
Findings
The dataset contains 603,495 irradiance records with 5-minute intervals, cleaned through preprocessing to ensure accuracy.
The dataset supports AI models for irradiance forecasting and photovoltaic system optimization using indicators like HPS and seasonal trends.
It can be used for educational purposes and to study solar energy variability and climate patterns in the region.
Abstract
This article presents an extensive irradiance dataset collected in San Juan de Pasto, located in southern Colombia, using a Davis Vantage PRO 2 meteorological station. The dataset spans 11 years, covering the period from 2013 to 2023, with measurements taken at 5-minute intervals, resulting in approximately 603,495 irradiance records, each accompanied by a corresponding timestamp. The construction of the dataset required a rigorous preprocessing stage. This stage included the removal of erroneous values (NaN) and outliers, the identification of missing entries, and the correction of inconsistencies in the date records. Missing values were addressed through gap-filling procedures based on averaged data, complemented by visual inspections using graphical representations. The cleaned dataset was exported after ensuring data integrity, accuracy, and consistency, which are essential for…
Genes, proteins, chemicals, diseases, species, mutations and cell lines named across the full text — each resolved to its canonical identifier and authoritative record.
Click any figure to enlarge with its caption.
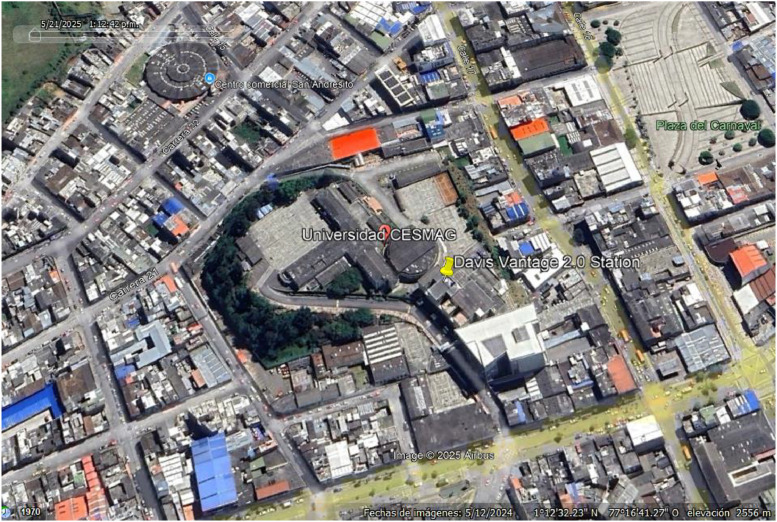 Figure 1
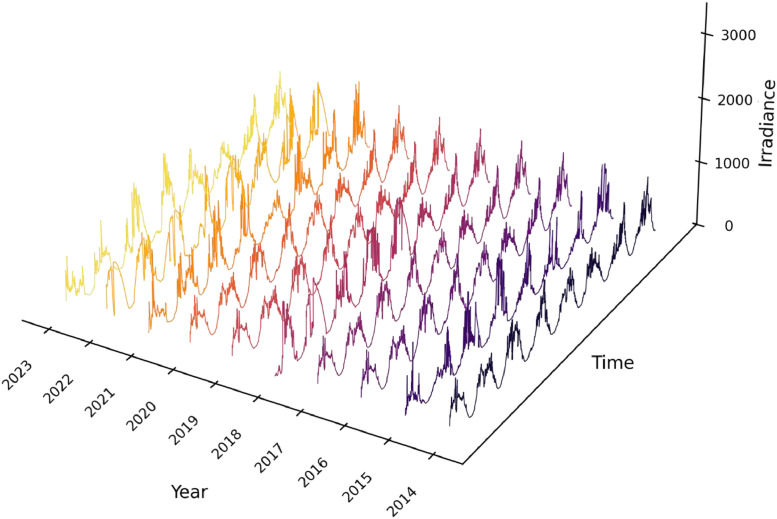 Figure 2
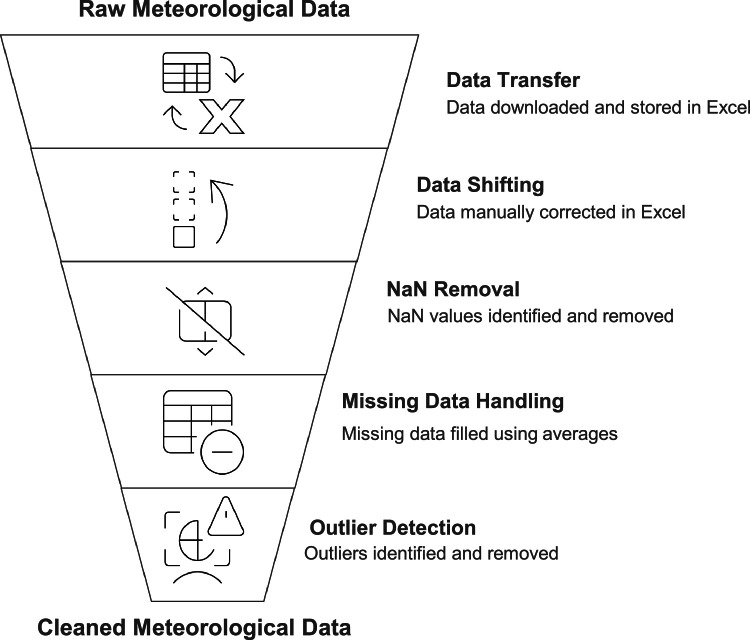 Figure 3
Peer Reviews
No public reviews on file for this paper yet. If you reviewed it on a platform where reviews are public (OpenReview, ICLR, NeurIPS, ICML), you can paste yours below so the community can read it here.
Videos
No videos yet. Explain this paper in a talk, walkthrough, or lecture? Add one.
Taxonomy
TopicsSolar Radiation and Photovoltaics · Impact of Light on Environment and Health · Air Quality Monitoring and Forecasting
Specifications TableSubjectEngineering & Materials scienceSpecific subject areaRenewable energy and global horizontal irradianceType of dataTable, ProcessedData collectionThe data were collected in San Juan de Pasto, Colombia using a Davis Vantage PRO 2 meteorological station. The station is equipped with a silicon pyranometer for global solar radiation (SKU6450), along with sensors for air temperature (accuracy ±0.5 °C) and relative humidity (accuracy ±3 %). Solar irradiance measurements were taken at 5-minute intervals and logged continuously from January 2013 to December 2023. This produced approximately 603,495 records. Data were stored digitally on the station's console and periodically downloaded using WeatherLink software to ensure long-term preservation and prevent losses. According to the manufacturer's recommendations, preventive maintenance includes sensor cleaning and calibration checks every year.Preprocessing involved removing NaN values, physically implausible irradiance readings, and inconsistent timestamps. The identification of outliers was conducted in accordance with established statistical thresholds and through a meticulous visual inspection process. Missing values were addressed by applying average-based interpolation between neighboring observations, a procedure that preserved both short-term variability and seasonal trends. The final dataset was exported in a standardized format for further analysis and modeling.Data source locationInstitution: Universidad CESMAGCity: San Juan de Pasto, Nariño, ColombiaCountry: ColombiaLatitude and longitude for collected samples/data: 1°12′33″ N, 77°16′52″ WData accessibilityRepository name: Irradiance dataset in the south of Colombia from 2013 to 2023 in 5-minutes intervalsData identification number: 10.17632/hr8jgbhm5j.1Direct URL to data: https://data.mendeley.com/datasets/hr8jgbhm5j/1Available in [1] as “Irradiance dataset in the south of Colombia from 2013 to 2023 in 5-minutes intervals”, Mendeley Data, V1, doi:10.17632/hr8jgbhm5j.1Related research articleA sample of the data was used in [2]:J. Barco-Jiménez, F. Eraso Checa, A. Pantoja, and E. Caicedo Bravo, “Estimation of Global Solar Radiation Using NNARX Neural Networks Based on the UV Index,” Tecnura, vol. 25, no. 70, pp. 90–107, 2021. [Online]. Available: https://doi.org/10.14483/22487638.18638
Value of the Data
1
- •This dataset provides 11 years of irradiance measurements collected at 5-minute intervals in San Juan de Pasto City, Colombia, yielding a comprehensive time series with over 1.1 million data points. Such a rich dataset can support valuable research and applications in renewable energy, climate studies, and beyond.
- •The comprehensive dataset spanning 11 years provides valuable insights into long-term trends, seasonal patterns, and the influence of atmospheric conditions on solar energy availability. This information is essential for sizing and design of photovoltaic systems.
- •The dataset has undergone thorough preprocessing to ensure data integrity, accuracy, and consistency, making it a reliable resource for scientific analysis and modeling. This preprocessing involved removing erroneous values, identifying missing data, and filling gaps with averaged data.
- •The dataset can serve as a valuable input for training and validating artificial intelligence models used for short-, medium-, and long-term irradiance forecasting. These predictive models have widespread applications in energy management, grid optimization, and solar energy production planning.
Background
2
The motivation behind compiling this comprehensive irradiance dataset was to provide a resource that could support a wide range of research and applications related to solar energy, climate studies, and renewable energy integration [[3], [4], [5]]. The region of southern Colombia, where the data was collected, has significant potential for solar energy development, but the lack of high-quality, long-term irradiance data has hindered the optimization of photovoltaic systems and the planning of solar energy projects [6].
To address this gap, a meteorological station was installed in San Juan de Pasto City to continuously monitor solar irradiance at 5-minute intervals over an 11-year period, from 2013 to 2023. The resulting dataset captures the variability and trends in solar irradiance, which are crucial for understanding the feasibility and performance of solar energy systems in the region.
Data Description
3
The dataset is organized in a single Excel file named “Daily irradiance data 2013 – 2023.xls”. This file contains high-resolution daily records of global horizontal solar irradiance (GHI) measured in Watts per square meter (w/m2). Data was collected at 5-minute intervals, allowing for detailed temporal analysis. Fig. 1 shows the location of Universidad CESMAG in San Juan de Pasto, Nariño, Colombia (1°12′33″ N, 77°16′52″ W), where the weather station used for data collection is installed.Fig. 1. Location of the weather station (Universidad CESMAG, Pasto, Colombia).Fig 1
The Excel workbook comprises twelve distinct worksheet tabs, each corresponding to a specific calendar month. The data distribution across these tabs is as follows:
- •Tabs “January” to “July”: These sheets contain daily irradiance data from January to July, for the years 2014 to 2023.
- •Tabs “August” to “December”: These sheets contain daily irradiance data from August to December, for the years 2013 to 2023.
Each monthly tab follows a consistent structure, including the following columns:
- •“Hour”: Represents the specific hour to which the irradiance data corresponds (e.g., HH:MM AM/PM).
- •“Day”: Indicates the numerical day of the month (e.g., 1 to 31).
- •“Year Columns (2013 - 2023)”: These columns, labeled by year, contain the irradiance data in W/m2 recorded every five minutes. Each cell in these columns corresponds to a 5-minute interval for a specific date and year.
File structure
3.1
Table 1 provides a summary of the data available in each monthly tab of the “Daily irradiance data 2013 – 2023.xls” file, including the range of years covered and the total number of 5-minute irradiance records per tab.Table 1. Daily irradiance data 2013 – 2023.Table 1. Tabs/FileYearsDataJanuary2014 - 202353,537February2014 – 202345,530March2014 – 202348,670April2014 – 202347,100May2014 - 202348,670June2014 - 202347,099July2014 - 202348,668August2013 to 202353,537September2013 to 202351,800October2013 to 202353,537November2013 to 202351,810December2013 to 202353,537Total603,495
Fig. 2 illustrates typical daily patterns of solar irradiance from a sample of the dataset, showcasing its behavior over an eight-day period.Fig. 2. Sample irradiance behaviour over 8 days.Fig 2
Experimental Design, Materials and Methods
4
This section provides a comprehensive description of the experimental design, instrumentation, and methodologies employed for the acquisition and initial processing of the solar irradiance data.
Data acquisition and measurement system
4.1
This subsection details the specific instrumentation and setup used to measure solar irradiance.
- •Measurement location: Data were acquired at the San Francisco Laboratory located at Holanda Building at the Univesity CESMAG, in San Juan de Pasto, Nariño, Colombia with coordinates 1°12′33″ N, 77°16′52″ W; altitude 2556 m a.s.l.). The site is located in a tropical high-altitude valley with frequent cloud cover, a factor that significantly affects irradiance variability.
- •Instrumentation: A Davis Vantage Pro 2 weather station equipped with a SKU6450 silicon pyranometer (spectral response: 400–1100 nm; sensitivity: 0.125 mV/W·m⁻²; accuracy: ±5 %) was used for global solar radiation measurements. The station also included sensors for air temperature (accuracy ±0.5 °C) and relative humidity (accuracy ±3 %).
- •Data logger and storage: The weather station was connected to a WeatherLink data logger, which automatically recorded irradiance values at 5-minute intervals. Data were continuously logged to the internal console memory and exported monthly to a computer hard disk using WeatherLink software. Backup copies were maintained on an external hard drive to prevent data loss.
- •Calibration: The pyranometer was by factory-calibrated against a secondary standard which is calibrated periodically against an Eppley Precision Spectral Pyranometer in natural daylight.
Experimental esign
4.2
- •Sensor Placement and Orientation: The pyranometer was installed horizontally on a level platform, free from obstructions, ensuring an unobstructed 180-degree field of view.
- •Environmental Controls/Conditions: The data was collected under ambient outdoor conditions typical of a tropical high-altitude climate at an altitude of 2556 m above sea level. This region experiences strong variability due to cloudiness and seasonal rainfall patterns, factors reflected in the dataset.
Data processing and quality control
4.3
All quality control steps described in Fig. 3 were systematically applied to the entire dataset covering the period 2013–2023, ensuring consistency and reproducibility of the cleaned data.
- •Initial data transfer/download: Raw files were downloaded monthly in CSV and Microsoft Excel formats. Timestamps followed local time (GMT-5) without daylight saving adjustments.
- •Data shifting: Occasional timestamp misalignments detected through visual inspection were manually corrected to maintain chronological consistency, with midday aligned to the maximum irradiance value.
- •NaN: Not-a-Number mark was identified by software and erased from the table generating a missing data.
- •Missing data handling: Gaps in the dataset, mostly due to power outages or maintenance, were identified visually and by comparing record counts with expected totals. Missing values were imputed using average-based interpolation between the same time interval of the previous and following years.
- •Outlier detection/removal: Data underwent an initial quality control check to identify and remove outliers, including nighttime irradiance values (negative or significantly above zero) and values exceeding the maximums for the location (above 1500 W/m^2^).
- •Software for processing: Data processing and quality control were performed using Microsoft Excel 2016, Python 3.10 with Pandas library v1.5.0, and MATLAB R2022a. The code for visualization and data pre-processing is available in [7] with link: https://github.com/johnbarco/Irradiance_dataset_2013_2023. Python libraries utilized include Pandas for data manipulation and handling, NumPy for numerical operations, Matplotlib for data visualization, and Seaborn for enhanced plots and color palettes. [visualizing_irradiance_3d.py] was used to generate Fig. 1, and [correct_missing_data.py] to complete missing data.
- •Final dataset: The cleaned dataset was exported in CSV format, with standardized columns: Timestamp (YYYY-MM-DD hh:mm:ss, GMT-5) and Global Irradiance (W/m²). Fig. 3. Data quality control.Fig 3
Limitations
This dataset has two main limitations. First, sensor downtimes and power outages led to data gaps that were filled using averaged values from adjacent periods. While this maintains continuity, it may smooth out short-term irradiance fluctuations, underrepresenting extreme events. Second, the data were collected at a single high-altitude urban site, limiting spatial generalizability. Irradiance conditions in nearby rural or lower-altitude areas may differ significantly, so caution is advised when extending findings to broader regions.
Ethics Statement
The presented data involved none of the following: human subjects, animal experiments, or data collected from social media platforms
CRediT authorship contribution statement
John Barco-Jiménez: Conceptualization, Methodology, Data curation, Writing – review & editing. Daniel Rosero: Data curation, Visualization, Software. Andrés Zambrano: Data curation, Visualization, Software. Francisco Eraso-Checa: Conceptualization, Methodology, Data curation, Writing – review & editing. Miller Ruales: Validation, Supervision. José Camilo Eraso: Validation, Supervision.
The reference list from the paper itself. Each links out to its DOI / PubMed record.
- 1Barco-Jiménez J.Irradiance dataset in the south of Colombia from 2013 to 2023 in 5-minutes intervals Mendeley Data.1202510.17632/hr 8jgbhm 5j.1[Online]. Available: · doi ↗
- 2Barco-Jiménez J.Checa F.Eraso Pantoja A.Bravo E.Caicedo Estimation of global solar radiation using NNARX Neural networks based on the UV index Tecnura 257020219010710.14483/22487638.18638[Online]. Available: · doi ↗
- 3Y. Yu, J. Mao, R. Nguyen, A. Tohmeh, and H. Yeh, “Feature construction and selection for PV solar power modeling,” p. 90, Aug. 2022, doi: 10.1109/adconip 55568.2022.9894235.
- 4Silwal S.Mullican C.Chen Y.Ghosh A.Dilliott J.Kleissl J.Open-source multi-year power generation, consumption, and storage data in a microgrid J. Renew. Sustain. Energy 132Mar. 202110.1063/5.0038650 · doi ↗
- 5Barco-Jiménez J.Obando G.Chamorro H.R.Pantoja A.Bravo E.C.Aguado J.A.In-line distributed dispatch of active and reactive power based on ADMM and consensus considering battery degradation in microgrids IEEE Access.112023314793149510.1109/ACCESS.2023.3248958 · doi ↗
- 6Li D.H.W.Lam J.C.Lau C.C.S.A study of solar radiation daylight illuminance and sky luminance data measurements for Hong Kong Archit. Sci. Rev.451Mar. 20022110.1080/00038628.2002.9696932 · doi ↗
- 7Barco-Jiménez J.Irradiance dataset 2013–2023 Git Hub Reposit.2025 https://github.com/johnbarco/Irradiance_dataset_2013_2023 Accessed: Jun. 30