The impact of socioeconomic status on the prevalence of antimicrobial resistance in high-income nations: a systematic review
Ethan Levitch, Levi Matthews, Eugene Choi, Sagaana Thushiyenthan, Lisa Hall, Jake Tickner, Amalie Dyda

TL;DR
This paper reviews how socioeconomic factors influence antimicrobial resistance in high-income countries, finding that lower income and education are linked to higher resistance rates.
Contribution
This study is the first systematic review to explore the relationship between socioeconomic status and AMR prevalence specifically in high-income nations.
Findings
Lower socioeconomic status correlates with higher AMR prevalence, particularly for MRSA infections.
Indices like income and household density are consistently linked to increased AMR rates.
Variability in SES metrics limits generalizability, and some AMR strains show exceptions to the trend.
Abstract
Antimicrobial resistance (AMR) poses an escalating global threat, transforming once-treatable infections into major health challenges. Although antibiotic misuse is a well-known driver of AMR, particularly in low- and middle-income settings, the silent epidemic may be fueled by socioeconomic disparities even in high-income countries. This systematic review investigates the relationship between socioeconomic status (SES) and AMR prevalence across high-income nations based on the World Bank classification. The studies included in this review span multiple observational designs (cross-sectional, cohort, and case-control) across various high-income nations, assessing the association between SES indicators (eg, income, education, and household crowding) and AMR strains, primarily methicillin-resistant Staphylococcus aureus (MRSA) and multidrug-resistant Escherichia coli. Findings…
Genes, proteins, chemicals, diseases, species, mutations and cell lines named across the full text — each resolved to its canonical identifier and authoritative record.
Click any figure to enlarge with its caption.
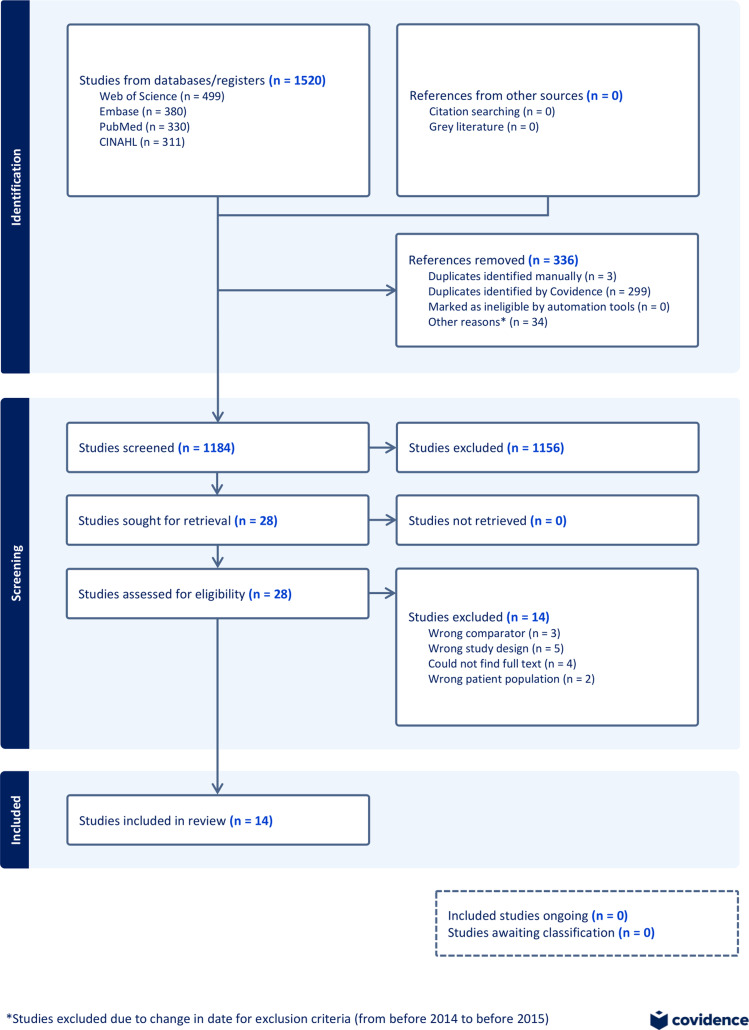 Figure 1
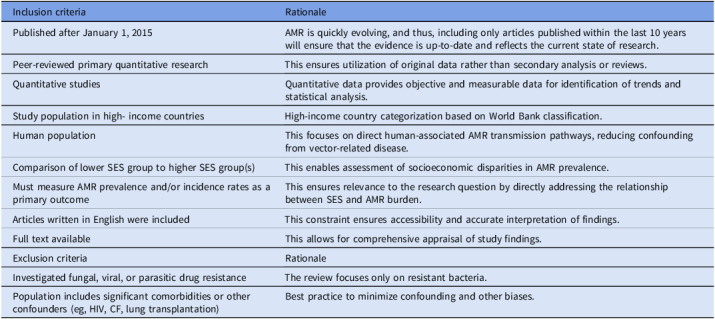 Figure 2
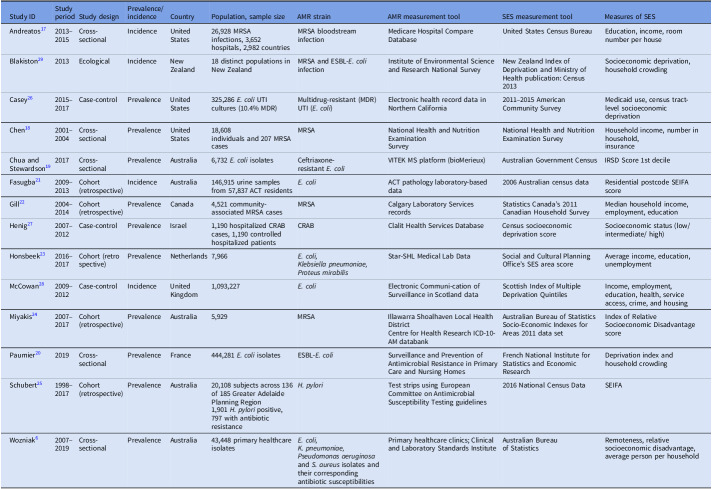 Figure 3
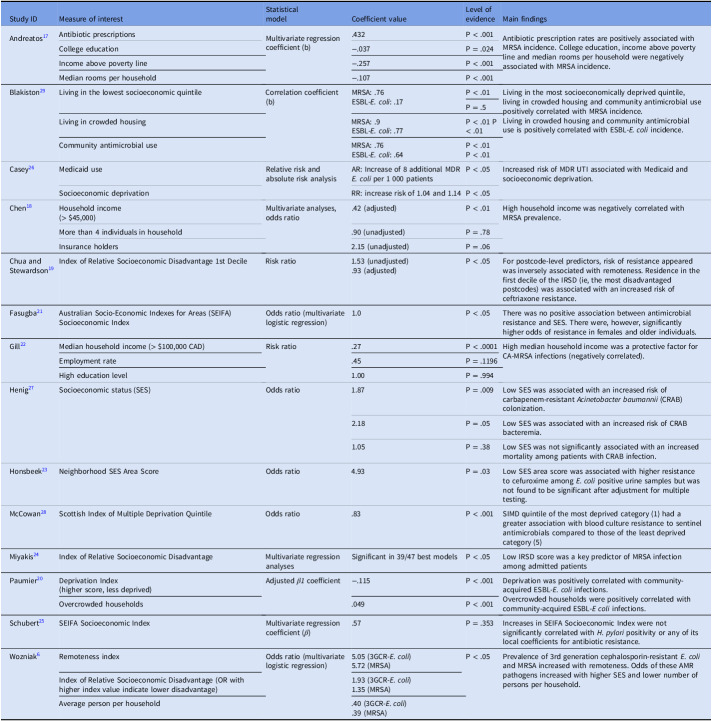 Figure 4
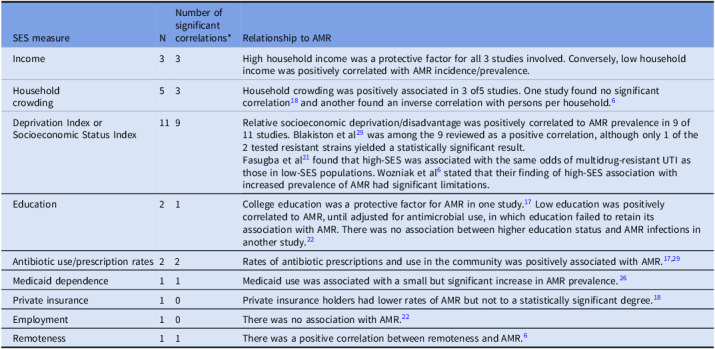 Figure 5
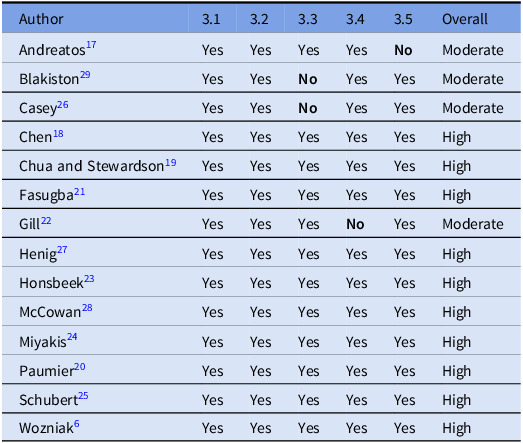 Figure 6
Peer Reviews
No public reviews on file for this paper yet. If you reviewed it on a platform where reviews are public (OpenReview, ICLR, NeurIPS, ICML), you can paste yours below so the community can read it here.
Videos
No videos yet. Explain this paper in a talk, walkthrough, or lecture? Add one.
Taxonomy
TopicsAntibiotic Use and Resistance · Antibiotic Resistance in Bacteria · Antimicrobial Resistance in Staphylococcus
Background
Antimicrobial resistance (AMR) arises when microorganisms adapt to survive antimicrobial drugs through spontaneous genetic mutations,^ 1,2 ^ a process exacerbated by human activities such as the misuse of antimicrobials and poor infection control practices.^ 3,4 ^ In 2019, approximately 4.95 million deaths occurred globally in direct association with AMR.^ 5 ^ In Australia, AMR-associated deaths have risen to over 1,000 annually, and the 5 most common AMR pathogens were attributed to the loss of 27,705 quality-adjusted life years in 2020.^ 6 ^ The most prominent of these were methicillin-resistant Staphylococcus aureus (MRSA) infections in the respiratory tract, bloodstream, and skin, accounting for $3.5 billion of Australian healthcare expenditure.^ 7 ^ Globally, AMR threatens the efficacy of life-saving antibiotics, fueling community-wide colonization with resistant pathogens that were once confined to hospital settings.^ 8 ^
At this time, there is sparse literature that evaluates low socioeconomic status (SES) as a key driver of AMR, limiting its recognition as a potential target for policy and intervention. Numerous primary studies have examined the prevalence of resistant strains of specific pathogens in clinical settings, although current literature lacks consensus on SES as an independent contributor to AMR in high-income countries. SES is a composite of contributing determinants, and the term SES represents the factors collectively (household crowding, education level, etc) unless otherwise specified.
At the community level, low-SES neighborhoods may be disproportionately vulnerable to AMR due to reduced gut microbiome diversity linked to food insecurity.^ 9 ^ Determinants of SES such as household crowding (per Canadian National Occupancy Standard) increase exposure to microorganisms and facilitate resistance development. Education level directly correlates with health literacy, influencing antimicrobial use and treatment adherence.^ 10 ^ Furthermore, lower SES communities have a greater reliance on Medicare and its international counterparts, which stresses stewardship and delays treatment in the community.^ 11 ^
In rural and remote areas, lack of stringent antimicrobial stewardship (AMS) contributes significantly to inappropriate prescription and antibiotic use,^ 12 ^ directly increasing AMR. Additionally, crowded housing, inadequate hygiene practices, limited healthcare access, and literacy add to increased AMR in rural communities.^ 6 ^ Less studied, however, are populations of low SES in urban and suburban communities with similar AMR prevalence and related disease burdens. Local studies show direct correlations between low SES and the prevalence of specific strains of AMR pathogens, suggesting that similar social determinants drive these disparities in both rural and urban areas.^ 12,13 ^
Examining SES in specifically high-income countries is a crucial distinction when identifying global patterns in AMR. Low- and middle-income countries (LMICs) have severe limitations to antimicrobial supply and stewardship and therefore have significant challenges gathering truly representative data on resistance prevalence.^ 14 ^ These nations also exhibit economic conditions not comparable to SES distributions elsewhere. Because much of their population earns less than $1 USD/day,^ 15 ^ socioeconomic measures from LMICs would have limited applicability to those of high-income countries.
Research question
This review investigates the association between SES and AMR rates across high-income countries based on the World Bank classification, testing the hypothesis that SES is negatively correlated with AMR prevalence. Addressing these disparities will inform policies to mitigate AMR and protect global health.
Methods
A search from 2015 to 2024 explored databases Embase, PubMed, Web of Science, and CINAHL. Relevant keyword synonyms were compiled. For words such as “antimicrobial” or “resistance,” antimicrobials and drug-resistant bacterial strains were also included specifically, such as “penicillin” or “MRSA.” Complete search terms are in Appendix 1.
Yau et al^ 12 ^ conducted a review of AMR between rural and urban communities. Because of its similarity to this research question, the key terms informed synonyms commonly used in titles and abstracts of studies on this topic. The Boolean search structure was organized into 4 components: antibiotic, resistance, incidence/prevalence, and income/SES. Search terms were separated by these 4 sets of synonyms and divided by an AND Boolean, mandating that at least 1 word from each set was present. This ensured a broad range of results while preventing an unmanageable surplus of irrelevant articles. Studies evaluated SES by parameters related to income, occupation, and education. The selection of high-income nations was defined by countries listed as “high-income” according to the World Bank classifications (Table 1). Prevalence of infection or colonization by any AMR bacterial strain was included for all ages of the human population, excluding agricultural and industrial AMR studies. Additional exclusion criteria include non-bacterial infections and populations with significant comorbidities (Table 1). Following extraction, quality assessment was conducted with the Mixed Methods Appraisal Tool Version 2018.^ 16 ^
Table 1.Inclusion and exclusion criteriaInclusion criteriaRationalePublished after January 1, 2015AMR is quickly evolving, and thus, including only articles published within the last 10 years will ensure that the evidence is up-to-date and reflects the current state of research.Peer-reviewed primary quantitative researchThis ensures utilization of original data rather than secondary analysis or reviews.Quantitative studiesQuantitative data provides objective and measurable data for identification of trends and statistical analysis.Study population in high- income countriesHigh-income country categorization based on World Bank classification.Human populationThis focuses on direct human-associated AMR transmission pathways, reducing confounding from vector-related disease.Comparison of lower SES group to higher SES group(s)This enables assessment of socioeconomic disparities in AMR prevalence.Must measure AMR prevalence and/or incidence rates as a primary outcomeThis ensures relevance to the research question by directly addressing the relationship between SES and AMR burden.Articles written in English were includedThis constraint ensures accessibility and accurate interpretation of findings.Full text availableThis allows for comprehensive appraisal of study findings.Exclusion criteriaRationaleInvestigated fungal, viral, or parasitic drug resistanceThe review focuses only on resistant bacteria.Population includes significant comorbidities or other confounders (eg, HIV, CF, lung transplantation)Best practice to minimize confounding and other biases.Note. AMR, antimicrobial resistance; SES, socioeconomic status; HIV, human immunodeficiency virus; CF, cystic fibrosis.
Results
The database search conducted on May 28, 2024, yielded 1,520 articles, of which 336 duplicates were removed. This left 1,184 articles that underwent the first phase of screening, whereby 26 articles were included and 1,104 were excluded by all 4 reviewers—from May 28, 2024, to June 25, 2024—with 54 conflicts left for resolution. After review, 2 of the 54 articles in contention were included.
In total, 1,156 records were excluded during screening of abstracts and titles, leaving 28 articles for full-text screening (Figure 1). During full-text screening from June 25 to July 13, 2024, 14 studies were included and 14 were excluded by all reviewers without conflicts. Of the 14 included studies,^ 6,17–29 ^ 5 were cross-sectional,^ 6,17–20 ^ 5 were retrospective cohort,^ 21–25 ^ 3 were case-control,^ 26–28 ^ and 1 was ecological in study design.^ 29 ^ Eight high-income nations were represented: Australia (n = 5),^ 6,19,21,24,25 ^ the United States (n = 3),^ 17,18,26 ^ France (n = 1),^ 20 ^ Canada (n = 1),^ 22 ^ Netherlands (n = 1),^ 23 ^ Israel (n = 1),^ 27 ^ the United Kingdom (n = 1),^ 28 ^ and New Zealand (n = 1).^ 29 ^
The studies examined a range of infections and resistant organisms (Table 2). The most commonly studied infections were urinary tract infections (UTIs) caused by extended-spectrum β-lactamase (ESBL)-producing or multidrug-resistant (MDR) E. coli (n = 6),^ 19–21,23,26,28 ^ and MRSA (n = 5).^ 17,18,22,24,29 ^ Other pathogens included carbapenem-resistant Acinetobacter baumannii (CRAB) (n = 1)^ 27 ^ and antibiotic-resistant H. pylori (n = 1).^ 25 ^ Most studies focused on community-associated infections, though some used hospital-based data or both.
Table 2.Study characteristics. Study characteristics and demographics of the included studies (n=14)Study IDStudy periodStudy designPrevalence/ incidenceCountryPopulation, sample sizeAMR strainAMR measurement toolSES measurement toolMeasures of SESAndreatos^ 17 ^ 2013– 2015Cross-sectionalIncidenceUnited States26,928 MRSAinfections, 3,652hospitals, 2,982 countriesMRSA bloodstream infectionMedicare Hospital Compare DatabaseUnited States Census BureauEducation, income, room number per houseBlakiston^ 29 ^ 2013EcologicalIncidenceNew Zealand18 distinct populations in New ZealandMRSA and ESBL-E. coli infectionInstitute of Environmental Science and Research National SurveyNew Zealand Index of Deprivation and Ministry of Health publication: Census 2013Socioeconomic deprivation, household crowdingCasey^ 26 ^ 2015– 2017Case-controlPrevalenceUnited States325,286 E. coli UTI cultures (10.4% MDR)Multidrug-resistant (MDR) UTI (E. coli)Electronic health record data in Northern California2011–2015 American Community SurveyMedicaid use, census tract-level socioeconomic deprivationChen^ 18 ^ 2001– 2004Cross-sectionalPrevalenceUnited States18,608individuals and 207 MRSAcasesMRSANational Health and Nutrition ExaminationSurveyNational Health and Nutrition Examination SurveyHousehold income, number in household,insuranceChua and Stewardson^ 19 ^ 2017Cross-sectionalPrevalenceAustralia6,732 E. coli isolatesCeftriaxone-resistant E. coli VITEK MS platform (bioMerieux)Australian Government CensusIRSD Score 1st decileFasugba^ 21 ^ 2009– 2013Cohort (retrospective)IncidenceAustralia146,915 urine samples from 57,837 ACT residents E. coli ACT pathology laboratory-based data2006 Australian census dataResidential postcode SEIFA scoreGill^ 22 ^ 2004– 2014Cohort (retrospective)PrevalenceCanada4,521 community-associated MRSA casesMRSACalgary Laboratory Services recordsStatistics Canada’s 2011 Canadian Household SurveyMedian household income, employment, educationHenig^ 27 ^ 2007– 2012Case-controlPrevalenceIsrael1,190 hospitalized CRAB cases, 1,190 controlled hospitalized patientsCRABClalit Health Services DatabaseCensus socioeconomic deprivation scoreSocioeconomic status (low/ intermediate/ high)Honsbeek^ 23 ^ 2016– 2017Cohort (retrospective)PrevalenceNetherlands7,966 E. coli,
Klebsiella pneumoniae, Proteus mirabilis Star-SHL Medical Lab DataSocial and Cultural Planning Office’s SES area scoreAverage income, education, unemploymentMcCowan^ 28 ^ 2009– 2012Case-controlIncidenceUnited Kingdom1,093,227 E. coli Electronic Communi-cation of Surveillance in Scotland dataScottish Index of Multiple Deprivation QuintilesIncome, employment, education, health, service access, crime, and housingMiyakis^ 24 ^ 2007– 2017Cohort (retrospective)PrevalenceAustralia5,929MRSAIllawarra Shoalhaven Local Health DistrictCentre for Health Research ICD-10-AM databankAustralian Bureau of Statistics Socio-Economic Indexes for Areas 2011 data setIndex of Relative Socioeconomic Disadvantage scorePaumier^ 20 ^ 2019Cross-sectionalPrevalenceFrance444,281 E. coli isolatesESBL-E. coli Surveillance and Prevention of Antimicrobial Resistance in Primary Care and Nursing HomesFrench National Institute for Statistics and Economic ResearchDeprivation index and household crowdingSchubert^ 25 ^ 1998– 2017Cohort (retrospective)PrevalenceAustralia20,108 subjects across 136 of 185 Greater Adelaide Planning Region1,901 H. pylori positive, 797 with antibiotic resistance H. pylori Test strips using European Committee on Antimicrobial Susceptibility Testing guidelines2016 National Census DataSEIFAWozniak^ 6 ^ 2007– 2019Cross-sectionalPrevalenceAustralia43,448 primary healthcare isolates E. coli,
K. pneumoniae,
Pseudomonas aeruginosa and S. aureus isolates and their corresponding antibiotic susceptibilitiesPrimary healthcare clinics; Clinical and Laboratory Standards InstituteAustralian Bureauof StatisticsRemoteness, relative socioeconomic disadvantage, average person per householdNote. AMR, antimicrobial resistance; SES, socioeconomic status; MRSA, methicillin-resistant Staphylococcus aureus; ESBL-E. coli, extended-spectrum β-lactamase–producing Escherichia coli; IRSD, Index of Relative Socioeconomic Disadvantage; VITEK MS, automated mass spectrometer system; ACT, Australian Capital Territory; SEIFA, Socio-Economic Indexes for Areas; CRAB, carbapenem-resistant Acinetobacter baumannii.
Figure 1.PRISMA diagram of screening process.
All included studies explored associations between SES and AMR-related outcomes using various proxy measures for SES, including but not limited to income, education, employment, remoteness, insurance status, and census deprivation indices. The indices, when utilized, were often country-specific and locally tailored (Table 3). Regardless, many of these shared common parameters as displayed in Table 4. Among the 14 studies, 12 found at least 1 significant positive association between lower SES and increased AMR risk (Table 3). For example, Casey et al^ 26 ^ found that Medicaid usage and neighborhood deprivation were linked to MDR E. coli UTIs in a large Californian cohort. Similarly, Henig et al^ 27 ^ reported that lower SES was significantly associated with increased risk of CRAB colonization and infection in Israel. Schubert et al^ 25 ^ examined antibiotic resistance patterns to H. pylori in the Greater Adelaide Region of Australia. 20,108 gastric biopsies identified a 9.45% positivity rate for H. pylori, with resistance to metronidazole, clarithromycin, or amoxicillin observed in 41.9% of infections. Multivariate linear regression revealed migration status as a key predictor of H. pylori positivity and antibiotic resistance. However, geographically weighted regression found that many independent local regression variables, such as the census socioeconomic index, were not significant for H. pylori positivity or associated AMR.^ 25 ^
Table 3.Summary of findings. Summary of included studies and relevant findings. Measure of interest includes both that of SES and secondary outcomes (AMS). Level of evidence was colored according to significance for ease of interpretation (green, statistically significant; red, not statistically significant). A P value < .05 was considered significantStudy IDMeasure of interestStatisticalmodelCoefficient valueLevel of evidenceMain findingsAndreatos^ 17 ^ Antibiotic prescriptionsMultivariate regression coefficient (b).432P < .001Antibiotic prescription rates are positively associated with MRSA incidence. College education, income above poverty line and median rooms per household were negatively associated with MRSA incidence.College education−.037P = .024Income above poverty line−.257P < .001Median rooms per household−.107P < .001Blakiston^ 29 ^ Living in the lowest socioeconomic quintileCorrelation coefficient (b)MRSA: .76ESBL-E. coli: .17P < .01Living in the most socioeconomically deprived quintile, living in crowded housing and community antimicrobial use positively correlated with MRSA incidence.Living in crowded housing and community antimicrobial use is positively correlated with ESBL-E. coli incidence.P = .5Living in crowded housingMRSA: .9ESBL-E. coli: .77P < .01 P < .01Community antimicrobial useMRSA: .76ESBL-E. coli: .64P < .01P < .01Casey^ 26 ^ Medicaid useRelative risk and absolute risk analysisAR: Increase of 8 additional MDR E. coli per 1 000 patientsP < .05Increased risk of MDR UTI associated with Medicaid and socioeconomic deprivation.Socioeconomic deprivationRR: increase risk of 1.04 and 1.14P < .05Chen^ 18 ^ Household income(> 45,000)Multivariate analyses, odds ratio.42 (adjusted)P < .01High household income was negatively correlated with MRSA prevalence.More than 4 individuals in household.90 (unadjusted)P = .78Insurance holders2.15 (unadjusted)P = .06Chua and Stewardson^ [19](#ref19) ^ Index of Relative Socioeconomic Disadvantage 1st DecileRisk ratio1.53 (unadjusted).93 (adjusted)P < .05For postcode-level predictors, risk of resistance appeared was inversely associated with remoteness. Residence in the first decile of the IRSD (ie, the most disadvantaged postcodes) was associated with an increased risk of ceftriaxone resistance.Fasugba^ [21](#ref21) ^ Australian Socio-Economic Indexes for Areas (SEIFA) Socioeconomic IndexOdds ratio (multivariate logistic regression)1.0P < .05There was no positive association between antimicrobial resistance and SES. There were, however, significantly higher odds of resistance in females and older individuals.Gill^ [22](#ref22) ^ Median household income (> 100,000 CAD)Risk ratio.27P < .0001High median household income was a protective factor for CA-MRSA infections (negatively correlated).Employment rate.45P = .1196High education level1.00P = .994Henig^ 27 ^ Socioeconomic status (SES)Odds ratio1.87P = .009Low SES was associated with an increased risk of carbapenem-resistant Acinetobacter baumannii (CRAB) colonization.2.18P = .05Low SES was associated with an increased risk of CRAB bacteremia.1.05P = .38Low SES was not significantly associated with an increased mortality among patients with CRAB infection.Honsbeek^ 23 ^ Neighborhood SES Area ScoreOdds ratio4.93P = .03Low SES area score was associated with higher resistance to cefuroxime among E. coli positive urine samples but was not found to be significant after adjustment for multiple testing.McCowan^ 28 ^ Scottish Index of Multiple Deprivation QuintileOdds ratio.83P < .001SIMD quintile of the most deprived category (1) had a greater association with blood culture resistance to sentinel antimicrobials compared to those of the least deprived category (5)Miyakis^ 24 ^ Index of Relative Socioeconomic DisadvantageMultivariate regression analysesSignificant in 39/47 best modelsP < .05Low IRSD score was a key predictor of MRSA infection among admitted patientsPaumier^ 20 ^ Deprivation Index(higher score, less deprived)Adjusted β1 coefficient−.115P < .001Deprivation was positively correlated with community-acquired ESBL-E. coli infections.Overcrowded households were positively correlated with community-acquired ESBL-E coli infections.Overcrowded households.049P < .001Schubert^ 25 ^ SEIFA Socioeconomic IndexMultivariate regression coefficient (β).57P = .353Increases in SEIFA Socioeconomic Index were not significantly correlated with H. pylori positivity or any of its local coefficients for antibiotic resistance.Wozniak^ 6 ^ Remoteness indexOdds ratio (multivariate logistic regression)5.05 (3GCR-E. coli)5.72 (MRSA)P < .05Prevalence of 3rd generation cephalosporin-resistant E. coli and MRSA increased with remoteness. Odds of these AMR pathogens increased with higher SES and lower number of persons per household.Index of Relative Socioeconomic Disadvantage (OR with higher index value indicate lower disadvantage)1.93 (3GCR-E. coli)1.35 (MRSA)Average person per household.40 (3GCR-E. coli).39 (MRSA)Note. MRSA, methicillin-resistant Staphylococcus aureus; ESBL-E. coli, extended-spectrum β-lactamase–producing Escherichia coli; MDR, multidrug resistant; UTI, urinary tract infection; AR, absolute risk; RR, relative risk; IRSD, Index of Relative Socioeconomic Disadvantage; SEIFA, Socio-Economic Indexes for Areas; SES, socioeconomic status; AMR, antimicrobial resistance.
Table 4.Determinants of SES and correlation to AMR. Compiled list of SES measures extracted from included studies. N refers to the number of studies measuring the given SES factorSES measureNNumber of significantcorrelations*Relationship to AMRIncome33High household income was a protective factor for all 3 studies involved. Conversely, low household income was positively correlated with AMR incidence/prevalence.Householdcrowding53Household crowding was positively associated in 3 of5 studies. One study found no significant correlation^ 18 ^ and another found an inverse correlation with persons per household.^ 6 ^ Deprivation Index or Socioeconomic Status Index119Relative socioeconomic deprivation/disadvantage was positively correlated to AMR prevalence in 9 of 11 studies. Blakiston et al^ 29 ^ was among the 9 reviewed as a positive correlation, although only 1 of the 2 tested resistant strains yielded a statistically significant result.Fasugba et al^ 21 ^ found that high-SES was associated with the same odds of multidrug-resistant UTI as those in low-SES populations. Wozniak et al^ 6 ^ stated that their finding of high-SES association with increased prevalence of AMR had significant limitations.Education21College education was a protective factor for AMR in one study.^ 17 ^ Low education was positively correlated to AMR, until adjusted for antimicrobial use, in which education failed to retain its association with AMR. There was no association between higher education status and AMR infections in another study.^ 22 ^ Antibiotic use/prescription rates22Rates of antibiotic prescriptions and use in the community was positively associated with AMR.^ 17,29 ^ Medicaid dependence11Medicaid use was associated with a small but significant increase in AMR prevalence.^ 26 ^ Private insurance10Private insurance holders had lower rates of AMR but not to a statistically significant degree.^ 18 ^ Employment10There was no association with AMR.^ 22 ^ Remoteness11There was a positive correlation between remoteness and AMR.^ 6 ^ Note. AMR, antimicrobial resistance; UTI, urinary tract infection; SES, socioeconomic status.*This column indicates results in supportive affirmation of the hypothesis, not the number of statistically significant findings indicated by red and green in Table 3. For example, a negative correlation between income and AMR prevalence would be a supportive finding, whereas a positive correlation between household crowding and AMR would be affirmative.
Several studies included additional SES-related variables such as household crowding, remoteness, and proportion of residents born outside the country, which were positively associated with AMR.^ 6,19,21,25–29 ^ Furthermore, Blakiston et al^ 29 ^ and Chua and Stewardson^ 19 ^ identified both community antimicrobial use and household density as significant contributors to MRSA and ESBL-E. coli incidence. Age and sex were also explored, with older women found to have an increased risk of MDR UTIs in an Australian cohort.^ 21 ^
Most studies were observational in nature and geographically concentrated in Australia^ 6,19,21,24,25 ^ and North America.^ 17,18,22,26 ^ Ecological and cross-sectional designs were common, limiting causal inference. Nevertheless, consistent associations across multiple regions and methodologies suggest a robust relationship between SES and AMR prevalence.
Determinants of socioeconomic status
Included studies investigated a plethora of SES determinants: income, household crowding, education, Medicaid use, insurance, employment, and census-derived deprivation scores (Table 4). Although these determinants are collectively a comprehensive measure of SES, direct comparison between studies is made difficult by their heterogeneity. Overall, 12 of 14 studies reported at least 1 significant association between a determinant of SES deprivation and increased AMR prevalence (Table 3). Of the 2 studiesthat did not find any significant positive correlations,^ 6,25 ^ Wozniak et al^ 6 ^ found that AMR prevalence increased with remoteness, independent of socioeconomic indices or income. Although remoteness may relate to SES, it was not considered as an independent determinant. Schubert et al^ 25 ^ reported no significant increase in H. pylori positivity or any local coefficients for antibiotic resistance with increasing SEIFA Socioeconomic Index. Across the 14 included studies, 9 unique measures including and related to SES were investigated in 27 iterations (N, Table 4). Overall, 20 instances of the 27 were statistically significant correlations in support of the hypothesis (Table 4). Hence, most studies report positive correlations between SES and AMR in a majority of the various SES determinants, but further analysis is required to ascertain which determinants are the largest contributors and develop understanding of a potential dose-response relationship.
Mechanisms of association between SES determinants and AMR
Household crowding was a key determinant of SES with a demonstrated causal mechanism of low SES and increased AMR prevalence.^ 17,20,26,29 ^ Blakiston et al^ 29 ^ identified increased prevalence of ESBL-E. Coli and MRSA with crowded housing, organisms that are known to readily spread within households. However, Wozniak et al^ 6 ^ challenged simplistic crowding metrics of “persons per household,” emphasizing the need to assess housing quality rather than simply the number of occupants. Community antibiotic use also played a role, with Andreatos et al^ 17 ^ and Blakiston et al^ 29 ^ reporting higher prescription rates in lower SES areas, driving MRSA and ESBL-E. coli resistance. In contrast, Wozniak et al^ 6 ^ rejected antibiotic use as a sole driver, citing increased AMR prevalence despite longstanding stewardship programs in remote Australia.
Higher income appeared protective, with Chen et al^ 18 ^ and Gill et al^ 22 ^ showing inverse relationships between affluence and MRSA infections. Similarly, McCowan et al^ 28 ^ found more antimicrobial-resistant E. coli in Scotland’s most deprived areas but did not propose specific mechanisms. Henig et al^ 27 ^ and Wozniak et al,^ 6 ^ however, framed AMR disparities as a function of healthcare access rather than income alone. Remoteness was a more complex variable. Univariable analysis for remoteness showed a significant association with AMR for Chua and Stewardson,^ 19 ^ but findings were not significant in multivariate regression. Wozniak et al^ 6 ^ argued that remoteness itself directly contributed to AMR spread in resource-limited settings, underscoring the need for context-specific, targeted approaches to AMR mitigation rather than one-size-fits-all interventions.
Overall, these studies suggest that no single mechanism fully explains SES-related AMR disparities. Instead, determinants such as household density, antibiotic exposure, income, and healthcare accessibility interact in complex ways, necessitating tailored interventions that consider both local socioeconomic determinants and healthcare policies.
Discussion
This systematic review provides evidence for a more complex correlation between low SES and AMR prevalence in high-income nations. Across the included studies, multiple SES determinants such as income, household crowding, and community antibiotic use were associated with increased AMR burden. Community antibiotic prescribing patterns were also linked to AMR prevalence, particularly in lower-income communities, though causality remains uncertain.
This review also highlights the need for targeted public health interventions that address a multitude of factors, from social and behavioral determinants that could increase risk of infection to access to safe and appropriate healthcare at a population level. This goes beyond the scope of traditional AMS programs, which have primarily focused on reducing the quantum of inappropriate prescribing in hospital settings.^ 8,30 ^ Remoteness and rurality as a driver of AMR have also been the primary focus of targeted AMS programs in the past.^ 30 ^ Such programs, however, could potentially overlook socioeconomically disadvantaged urban communities and the significant burden of resistance they pose. Examples could include investing in affordable housing construction, maintenance, and subsidizations for ventilation and sanitation hardware.^ 31 ^ Public education on hygiene and antibiotic use from junior to senior schools also shows promise as evidenced by the e-Bug program in Europe which significantly improved knowledge and awareness in young people.^ 32 ^
Strengths and limitations
We observed a heterogeneity of study types and settings among included studies, from hospitalized patients to community screening participants. The included studies were well-conducted, with large sample sizes and broad geographic coverage, enhancing the external validity of the findings (Table 5). However, several limitations are present. No formal publication bias assessment was conducted, and therefore, publication bias remains a potential limitation of this review. One study used an ecological design, which is vulnerable to ecological fallacy. Although this does not invalidate the findings, it constrains their applicability to policies targeting AMR at the individual level.
Table 5.Quality assessment of included studies. The Mixed Methods Appraisal Tool Version 2018^ 16 ^ was used to evaluate the quality of each studyAuthor3.13.23.33.43.5OverallAndreatos^ 17 ^ YesYesYesYes No ModerateBlakiston^ 29 ^ YesYes No YesYesModerateCasey^ 26 ^ YesYes No YesYesModerateChen^ 18 ^ YesYesYesYesYesHighChua and Stewardson^ 19 ^ YesYesYesYesYesHighFasugba^ 21 ^ YesYesYesYesYesHighGill^ 22 ^ YesYesYes No YesModerateHenig^ 27 ^ YesYesYesYesYesHighHonsbeek^ 23 ^ YesYesYesYesYesHighMcCowan^ 28 ^ YesYesYesYesYesHighMiyakis^ 24 ^ YesYesYesYesYesHighPaumier^ 20 ^ YesYesYesYesYesHighSchubert^ 25 ^ YesYesYesYesYesHighWozniak^ 6 ^ YesYesYesYesYesHigh
The wide variation in measurement of variables among studies included is the primary limitation in this review. The definition of AMR as the outcome variable varied considerably, not only in the studied strain but also in the outcome classification. Some studies defined AMR through the presence of a resistant microbial in a community screening test, while other studies were based on positive diagnostic findings of hospitalized cases of UTI or bacteremia. A standardization of SES measurements within a nation, from individual to population levels, would also facilitate research and benchmarking across health boards and between different states. We recognize that this would allow robust meta-analyses, which could not be conducted due to the heterogeneity of SES and AMR measures in the current literature.
Conclusion
This systematic review identifies socioeconomic determinants as a potentially significant driver of AMR. Investigating the spread of resistance in low-SES populations of both urban and rural communities presents a new paradigm for AMS programs, which have previously focused primarily on inappropriate prescription and remote communities.^ 30 ^ We recommend public health initiatives prioritize infection control and AMS in populations of lower SES, both urban and rural, where risks of AMR may be heightened.
AMR is a multifaceted issue influenced by SES disparities, healthcare accessibility, and antibiotic exposure. Addressing these disparities will require collaborative, multi-sectoral approaches that integrate public health, healthcare policy, and socioeconomic interventions. Future AMR research will benefit from adopting a standardized demographic index for SES to enable more cross-study comparisons and meta-analysis for policy relevance. Concurrently, prospective studies that clarify causal pathways should be conducted to tailor more effective strategies to mitigate AMR in socioeconomically disadvantaged communities. These recommendations, when implemented, would ultimately promote health equity, prevent AMR spread, and strengthen global efforts to reduce AMR.
Supporting information
10.1017/ash.2025.10177.sm001Levitch et al. supplementary materialLevitch et al. supplementary material
The reference list from the paper itself. Each links out to its DOI / PubMed record.
- 1Friedman ND , Temkin E , Carmeli Y. The negative impact of antibiotic resistance. Clin Microbiol Infect 2016;22:416–422. doi:10.1016/j.cmi.2015.08.029.26706614 · doi ↗ · pubmed ↗
- 2Jindal AK , Pandya K , Khan ID. Antimicrobial resistance: a public health challenge. Med J Armed Forces India. 2015;71 178–181. doi:10.1016/j.mjafi.2015.02.004.25859082 PMC 4388962 · doi ↗ · pubmed ↗
- 3Knight GM , Costelloe C , Deeny SR , et al. Quantifying where human acquisition of antibiotic resistance occurs: a mathematical modelling study. BMC Med. 2018;16:1. doi:10.1186/s 12916-018-1232-0.PMC 610694030134939 · doi ↗ · pubmed ↗
- 4Klein EY , Milkowska-Shibata M , Tseng KK , et al. Assessment of WHO antibiotic consumption and access targets in 76 countries, 2000–15: an analysis of pharmaceutical sales data. Lancet Infect Dis. 2021;21:107–115. doi:10.1016/S 1473-3099(20)30332-7.32717205 · doi ↗ · pubmed ↗
- 5Laxminarayan R. The overlooked pandemic of antimicrobial resistance. Lancet. 2022;399:606. doi:10.1016/S 0140-6736(22)00158-5.35065701 PMC 8769677 · doi ↗ · pubmed ↗
- 6Wozniak TM , Cuningham W , Ledingham K , Mc Culloch K. Contribution of socio-economic factors in the spread of antimicrobial resistant infections in Australian primary healthcare clinics. J Glob Antimicrob Resist. 2022;30:294–301. doi:10.1016/j.jgar.2022.07.015.35700913 · doi ↗ · pubmed ↗
- 7Cameron JK , Paterson DL , Britton PN , et al. CO-MRSA infections in Australia cost $3.5 billion per annum. Presented at: Australasian Society for Infectious Diseases Annual Scientific Meeting; March 29, 2017. Queensland University of Technology. Sydney, Australia. 2017; https://eprints.qut.edu.au/106782/1/106782.pdf.
- 8De Leo FR , Otto M , Kreiswirth BN , Chambers HF. Community-associated methicillin-resistant Staphylococcus aureus . Lancet. 2010;375:1557–1568. doi:10.1016/S 0140-6736(10)60357-3.20206987 PMC 3511788 · doi ↗ · pubmed ↗