Agreement between intraocular pressure measurement using Goldmann applanation tonometry with and without fluorescein in consecutive Ghanaian patients
Charles Darko-Takyi, Youfegan B Mathurin, Emmanuel Essien, Sandra Owusu, Osei A Yaw, Kwame O Osei, Selina Holdbrook, Andrew Owusu-Ansah

TL;DR
This study compares intraocular pressure measurements using Goldmann tonometry with and without fluorescein in Ghanaian patients.
Contribution
The study provides evidence on the lack of agreement between intraocular pressure measurements with and without fluorescein in an African population.
Findings
There was no agreement between intraocular pressure measurements with and without fluorescein (p < 0.0001).
Unadjusted IOP without fluorescein was approximately 3 mmHg lower than with fluorescein.
Abstract
The interchangeability of Goldmann Applanation Tonometry (GAT) with or without fluorescein requires clarification among African populations. The present study aimed to determine the agreement between IOP measurement using GAT with and without fluorescein in consecutive patients in Ghana. A prospective cross-sectional clinic-based study design. The study was conducted at the Ophthalmology and Optometry units of the UCC Eye Clinic, Cape Coast, Ghana. A convenient sample of 104 consecutive patients who visited the clinic. The participants were randomised into two groups, where those in the first had their IOPs first measured without fluorescein and later with fluorescein on GAT; participants in the second group had their IOPs first measured with fluorescein and later without fluorescein after a 10-minute washout period. The central corneal thickness was measured using the Anterior…
Genes, proteins, chemicals, diseases, species, mutations and cell lines named across the full text — each resolved to its canonical identifier and authoritative record.
Click any figure to enlarge with its caption.
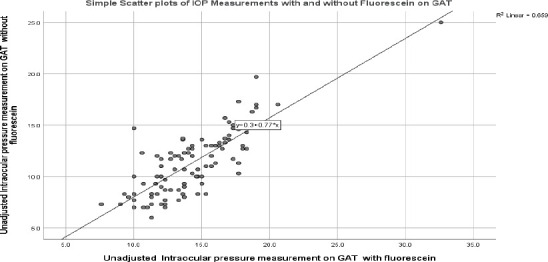 Figure 1
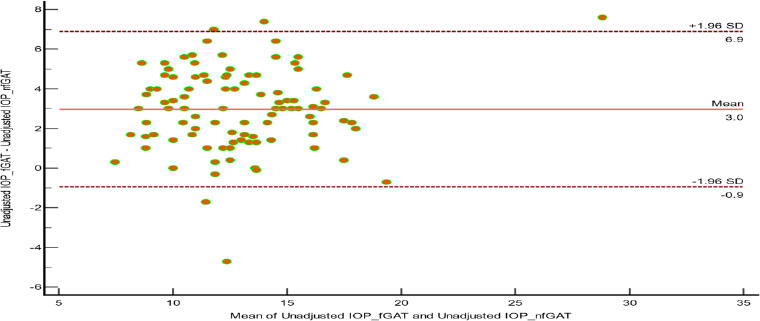 Figure 2
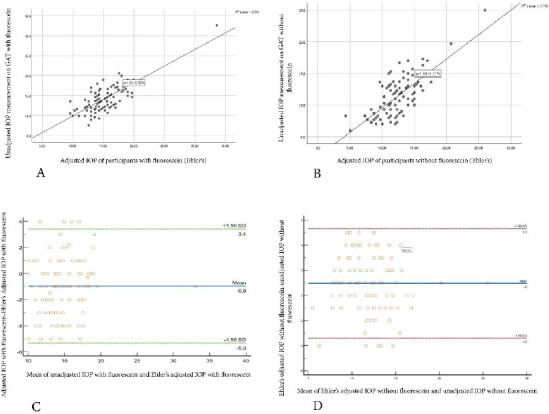 Figure 3
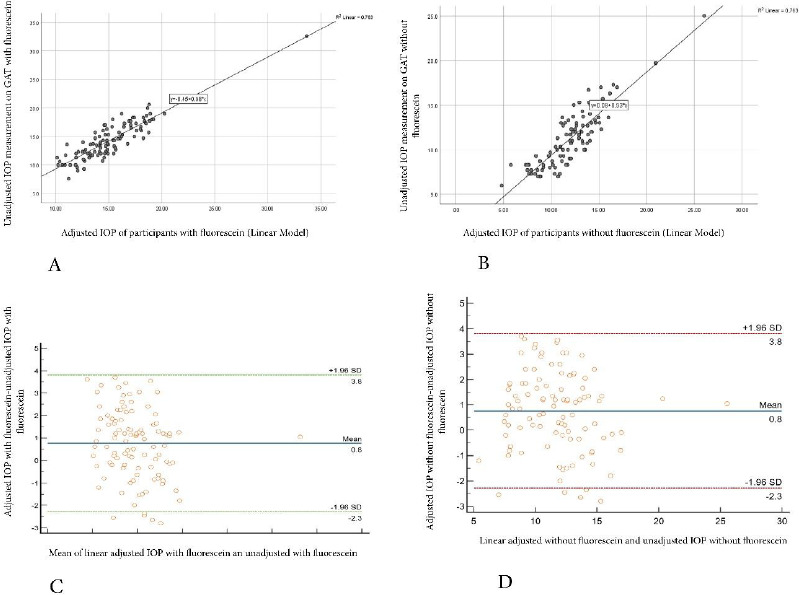 Figure 4
| IOP measurements with fluorescein | IOP measurements without fluorescein | CCT | |||||
|---|---|---|---|---|---|---|---|
|
| |||||||
| Unadjusted | Adjusted | Adjusted | Unadjusted | Adjusted | Adjusted | Um | |
| (f GAT) | (Ehlers) | (Linear) | (nf GAT) | (Ehlers) | (Linear) | ||
|
| 14.34 | 15.29 | 15.10 | 11.36 | 12.34 | 12.12 | 529.80 |
|
| 3.33 | 3.03 | 3.01 | 3.17 | 3.05 | 2.97 | 31.07 |
|
| 32.60 | 33.60 | 33.65 | 25.00 | 26.00 | 26.05 | 601.00 |
|
| 7.60 | 9.60 | 10.10 | 6.00 | 4.30 | 4.80 | 471.00 |
|
| 25.00 | 24.00 | 23.55 | 19.00 | 21.70 | 21.25 | 130.00 |
|
| 10.00 | 10.78 | 10.86 | 7.08 | 7.40 | 7.54 | 478.50 |
|
| 12.00 | 13.63 | 13.21 | 8.70 | 10.70 | 10.41 | 508.25 |
|
| 13.85 | 15.00 | 14.75 | 11.30 | 12.30 | 12.10 | 524.50 |
|
| 4.60 | 3.38 | 3.65 | 4.30 | 3.30 | 3.47 | 42.00 |
|
| 16.65 | 17.00 | 16.86 | 13.00 | 14.00 | 13.89 | 549.75 |
|
| 19.00 | 19.00 | 18.89 | 16.93 | 16.60 | 16.13 | 590.25 |
|
| 0.0001 | 0.0001 | 0.0001 | 0.0001 | 0.0001 | 0.0001 | 0.185 |
|
| |||||||
Peer Reviews
No public reviews on file for this paper yet. If you reviewed it on a platform where reviews are public (OpenReview, ICLR, NeurIPS, ICML), you can paste yours below so the community can read it here.
Videos
No videos yet. Explain this paper in a talk, walkthrough, or lecture? Add one.
Taxonomy
TopicsCorneal surgery and disorders · Glaucoma and retinal disorders · Retinopathy of Prematurity Studies
Introduction
Glaucoma is a bracket of progressive optic neuropathies identifiable by a degeneration of retinal ganglion cells and retinal nerve layers that contributes to the alteration of the optic nerve head1,2 and where intraocular pressure (IOP) is a major essential modifiable risk factor3,4. Glaucoma is reported as the second principal cause of blindness globally.5 Some over 80 million people globally were estimated to have glaucoma by the year 2020 6 and this number is projected to increase to 111.8 million by 2040.7 Apart from increased IOP, other leading risk factors include age, gender, refractive status, family history, use of steroids, systemic hypotension, and hypertension.8 Management and control of IOP are the most effective interventions covering the various classes of glaucoma. IOP elevation is highly associated with glaucoma onset and development to the detriment of the nerve fibre layer and consequent visual field loss.9 Therefore, accurate and precise measurement of IOP coupled with other diagnostic tools such as Optical coherence tomography and perimetry will culminate in proper diagnosis and management of glaucoma salvaging its repercussions.10,11
Goldmann applanation tonometry (GAT) with fluorescein is the gold standard in measuring IOP 12,13,14; however, some authors12,13,15,16,17,18,19 have experimented with the use of GAT without the use of fluorescein to determine if it gives comparable results to the gold standard. Many practitioners establish the use of fluorescein to improve visualisation of mires when measuring the IOP level 15,20; other practitioners also emphasise the use of fluorescein in GAT as an opportunistic tool to assess the integrity of the cornea before checking the IOP.16 That notwithstanding, many other practitioners check IOP without the use of fluorescein, bringing into perspective its clinical drawbacks, which include no clear-cut clinical standardisation of fluorescein, which may erroneously influence IOP measurements in addition to a burning sensation, allergic reactions, pruritus, susceptibility to infection, high cost, and less availability of fluorescein dye.12,15,16 This has led to a well-established debate on the outcome of results revealed in this area of study, as the literature gives conflicting ideas among different populations. According to studies,13,15,17,18,19, some stipulations imply significantly lower results of IOP measurement using the GAT technique without fluorescein than with fluorescein. That notwithstanding, other studies12,16 also reported an antagonistic view, which posits that there is no clinically significant difference in the measurement of IOP with GAT with and without the use of fluorescein. No study, however, has investigated the relationship between GAT measurement of IOP with and without fluorescein in the West African population.
Therefore, this study sought to investigate the agreement between measuring IOP with and without fluorescein with GAT in a Ghanaian population, thereby guiding practitioners in the proper diagnosis and management of glaucoma. It also aimed to compare the adjusted (correction factor) and unadjusted IOPs with and without fluorescein using GAT in a Ghanaian population.
Methods
Ethical consideration
The study was approved by the Institutional Review Board (IRB) of the University of Cape Coast, Ghana (Reference: UCCIRB/CHAS/2023/35) and followed the tenets of the Declaration of Helsinki on the use of human subjects for research. Written informed consent was obtained from participants before the commencement of the study.
Study Design, population, and sampling
A clinic-based cross-sectional study design utilising a convenience sampling technique was used. All clients aged 18 years and above who consecutively visited the University of Cape Coast Eye Clinic, Ghana, within the study period (October 2023 to December 2023), who met the study's requirements and gave consent, were enrolled as participants.
Data collection procedure
Preliminary examination
Participants underwent distance visual acuity examination using the Snellen chart at 6m. A slit lamp assessment of the anterior segment was then performed. Dry eyes assessment was performed using the tear break-up time technique.
Exclusion criteria
Participants with corneal abnormalities, acute eye inflammation or infections, bilateral blindness, eye surgery, ocular trauma, and dry eye were excluded from the study.
Measuring central corneal thickness
The central corneal thickness (CCT) of each participant who satisfied the inclusion criteria was taken using the Anterior Segment module of the Optical Coherence Tomography (Zeiss Cirrus 500 HD-OCT Model, Carl Zeiss Meditec, Dublin, CA, USA).
IOP measurement with and without fluorescein
Participants who satisfied the inclusion criteria were randomised into groups A and B; the randomisation was done such that participants were made to pick folded papers with inscriptions A or B indicated in them from an opaque container. Participants in group A had their IOP first measured with GAT without fluorescein and subsequently with fluorescein after a rest phase of about 10 minutes. Participants in group B had their intraocular pressure measured first with fluorescein and, following a washout phase of 10 minutes, without fluorescein. The IOPs were each measured after a topical anaesthetic (proparacaine hydrochloride 0.5%) had been instilled. Participants' IOP using GAT with fluorescein was measured using 1 drop of fluorescein sodium dye 2% v/w on the eye and observing for mires under the cobalt blue filter of the slit lamp biomicroscope. Participants' IOP using GAT without fluorescein was measured using the white light illumination of the slit lamp. The IOPs with and without fluorescein were measured in one eye only for each participant. The selection of right and left eyes for IOP measurement was randomised; half of the participants who picked folded papers labelled right eye and left eye had their IOPs measured with and without fluorescein for their right and left eyes, respectively. To prevent inter-examiner variability in the results, IOP measurements were taken by one examiner only. Unadjusted IOP measures with and without fluorescein for each participant were noted and adjusted for CCT using the Ehlers correction factor [Ehlers Adjusted IOP = Measured IOP + [0.071 × (545 − CCT] nomogram21 and the Linear model's formula22 [Adjusted IOP = Measured IOP − (CCT-545) / 50 × 2.5mmHg]. CCT of 545 µm was used in the Linear model's formula for easy comparison, as it is the standard used in the Ehlers correction factor; 545 µm is also within the range (of CCT) determined for the study population (Table 1).
Data analysis
Data was analysed using the IBM SPSS version 22.0. The Wilcoxon signed-rank test was used to determine the difference between the two techniques. Spearman correlation was used to determine the correlation between the two techniques and other continuous variables. The agreement between measuring intraocular pressure with and without fluorescein with GAT was investigated using Bland-Altman analysis. Statistical significance was set at a p-value of ≤ 0.05.
The total number of participants enrolled in the study was 153 of which 49 were excluded with corneal abnormalities (8), acute eye inflammation or infections (13), eye surgery (2), ocular trauma (1), and dry eye (23). Two (2) participants were uncooperative with the GAT assessment and 104 completed all assessments. Of the 104 participants (104 eyes), fifty-two, 52 (50%) were males and fifty-two, 52 (50%) were females. Their age ranged from 19 to 29 years old with a mean (SD) age of 22.66 (2.184). Table 1 gives the descriptive statistics for unadjusted and adjusted (Ehlers and Linear Models) IOP with and without fluorescein and for CCT for the participants. Apart from CCT, none of the parameters measured were normally distributed (Table 1).
Results
There was a significant positive correlation between CCT, and unadjusted IOP (r_s_ = 0.497, p < 0.0001) and adjusted IOP (r_s_ = 0.408, p < 0.0001). There was a statistically significant positive correlation between unadjusted IOP measurements with and without fluorescein with GAT (r_s_ = 0.76, p = 0.001) as indicated in Figure 1.
Scatterplot showing the correlation between IOP measurements with and without fluorescein on GAT
Similarly, the Intraclass Correlation Coefficient showed strong positive reliability between the IOP measurements with and without fluorescein with GAT, with an average measure of 0.728 (95% CI: -0.185 to 0.909). There was a significant median difference of 2.55mmHg between unadjusted IOP measurement with and without fluorescein with GAT, a mean difference of 2.97 (95% CI = 2.58 − 3.36) mmHg. Unadjusted IOP without fluorescein (MD 11.300) was significantly lower than unadjusted IOP with fluorescein (MD = 13.850) (Wilcoxon signed rank test, p < 0.001). There was no agreement between unadjusted IOP measurements with and without fluorescein with GAT using the Bland-Altman analysis [P < 0.0001, Lower limit: -0.9433, Upper limit: 6.8914; CI 95% = −1.6097 to -0.2769] (Figure 2).
Bland Altman Scatter plot showing no agreement between unadjusted IOP measurements with fluorescein and without fluorescein
There was no significant effect of gender on unadjusted IOP measurement with (Mann-Whitney U test, p = 0.110) and without (Mann-Whitney U test, p = 0.083) fluorescein; however, IOP measurement was relatively higher in males than in females. The Mean Rank for unadjusted IOP measurement with fluorescein was 57.23 and 47.77 in males and females, respectively. The Mean Rank for unadjusted IOP measurement without fluorescein was 57.63 and 47.38, respectively, for males and females.
Relationship between Ehlers Adjusted IOP measurements and unadjusted IOP measurements, with and without Fluorescein on GAT
There was a statistically significant positive correlation between the Ehlers Adjusted IOP model and unadjusted IOP measurements with (r_s_ = 0.653, p < 0.0001) and without (r_s_ = 0.653, p < 0.0001) fluorescein. Ehlers' adjusted model with fluorescein showed relatively higher IOP measurements (MD = 15.00) in comparison to unadjusted IOP measurements (MD =13.85) with fluorescein (Wilcoxon signed rank test, p < 0.001). Similarly, Ehlers adjusted model without fluorescein showed comparatively high IOP measurements (MD = 12.30) in contrast to the unadjusted IOP without fluorescein (MD = 11.30) (Wilcoxon signed rank test, p < 0.001). There was no agreement between Ehlers adjusted IOP measurement and unadjusted IOP measurements with and without fluorescein on the Bland Altman analysis (p > 0.05) as indicated in Figure 3.
A- Scatterplot showing the correlation between unadjusted IOP measurements with fluorescein and Ehlers adjusted Model with fluorescein on GAT. B- Scatterplot showing the correlation between unadjusted IOP measurements without fluorescein and Ehlers adjusted Model without fluorescein on GAT. C- Bland Altman plot showing no agreement between Ehlers adjusted IOP and unadjusted IOP with fluorescein on GAT. D- Bland Altman plot showing no agreement between Ehlers adjusted IOP and unadjusted IOP without fluorescein on GAT
Relationship between Linear Adjusted IOP measurements and unadjusted IOP measurements with and without fluorescein with GAT
There was a statistically significant positive correlation between the Linear Adjusted IOP model and unadjusted IOP measurements with (r_s_ = 0.837, p < 0.0001) and without (r_s_ = 0.839, p < 0.0001) fluorescein, respectively. Linear adjusted model with fluorescein showed relatively higher IOP measurements (MD = 14.75) in comparison to unadjusted IOP measurements with fluorescein (MD = 11.85) (Wilcoxon signed rank test, p < 0.001). Similarly, the linear adjusted model without fluorescein showed comparatively high IOP measurements (MD = 12.00) in contrast to the unadjusted IOP without fluorescein (MD = 11.30) (Wilcoxon signed rank test, p < 0.001). There was no agreement between Linear adjusted IOP measurement and unadjusted IOP measurements with and without fluorescein using the Bland Altman analysis (p > 0.05) as summarised in Figure 4
A- Scatterplot showing the correlation between unadjusted IOP measurements with fluorescein and Linear adjusted Model with fluorescein on GAT. B- Scatterplot showing the correlation between unadjusted IOP measurements without fluorescein and Linear adjusted Model without fluorescein on GAT. C- Bland Altman plot showing no agreement between Linear adjusted IOP and unadjusted IOP with fluorescein on GAT. D- Bland Altman plot showing no agreement between Linear adjusted IOP and unadjusted IOP without fluorescein on GAT
Discussion
The significantly lower unadjusted IOP without fluorescein compared to with fluorescein of 3.00 mmHg as found in this present study is clinically meaningful and may be a major contributing factor in influencing a practitioner's choice of diagnosis and management of glaucoma in Ghanaian populations, especially in borderline cases. This disagreement between the two techniques indicates that they cannot be used interchangeably in clinical diagnosis and monitoring treatment for glaucoma. It also signifies that measuring IOP using GAT without fluorescein underestimates the IOP in this Ghanaian population, as GAT with fluorescein is the gold standard.12,13 The specific danger with measuring IOP without fluorescein for this population is that eyes with higher IOPs will be at a greater risk of developing glaucomatous optic atrophy and visual field loss since IOPs will always be underestimated. This lower IOP for GAT without fluorescein compared to with fluorescein in this study is comparable with similar studies.13,15,18, Among the Sudanese population,18 GAT with fluorescein was 2.08 mmHg higher than that without fluorescein among participants; a higher difference of 3.41 mmHg was found comparing glaucomatous and non-glaucomatous populations.18 Another study13 found a clinically significant difference of approximately 7 mmHg, indicating that GAT without fluorescein is purely speculative. The difference, according to these authors17,18, may be attributed to the decreased predetermined applanation area of less than 3.06mm diameter when IOP is measured without fluorescein in GAT. This decreased pre-determined applanation area of less than 3.06mm, coupled with less distinct tonometer mires without fluorescein with GAT, may make it difficult for the examiner to visualise the edges of the flattened applanation area of the cornea and target, thus making it difficult to determine the correct application endpoint. Practitioners may stop too soon before reaching the standardised 3.06mm diameter, resulting in lower IOP measures. Also, considering the Imbert-Fick formula of Pressure = Force / Area, the reduced applanation area of less than 3.06mm may require the application of less force, ultimately resulting in lower IOP measurements.
Other studies, 12, 16,19, however, found contrasting results among some populations. A study12 on glaucomatous and non-glaucomatous Malawian populations found no significant difference between GAT with and without fluorescein; the study12 indicated that the evidence of GAT measurement with and without fluorescein is not hypothetical and emphasised that the two techniques can be used interchangeably in diagnosis and management of glaucoma among their population. Another study16 on healthy subjects from Turkey found no significant difference between IOP using GAT with and without fluorescein, emphasising that GAT without fluorescein was suitable for routine clinical practice. One study19 indicates that GAT without fluorescein can substitute GAT with fluorescein in the Indian population, helping to prevent the complications that come with fluorescein, and at the same time not compromising the gold standard. Based on the above population differences in results, the findings in the present study are limited to only Ghanaian populations within the age range of nineteen to twenty-nine years old.
The positive correlation between CCT and IOP is consistent with previous studies among juveniles in China23 and Indigenous Africans in Nigeria.24 The thin CCT (mean, 529.8µm) among the population studied is comparable to that reported in other African populations.24,25 Also, the correlation between unadjusted IOP measured with and without fluorescein was consistent with previous studies.17,18,20
Several tonometry correction factors have evolved in clinical practice to adjust IOP measurements in patients, considering factors that can erroneously influence the measurement. Widely used correction models include the Ehlers correction nomogram and Linear model, which predict the influence of CCT on IOP by generating a biomechanically adjusted estimate of the pressure26. These practices, currently used in many clinical settings, are not without limitations. The present study presented novel knowledge on the association between IOP readings on GAT with and without fluorescein using the Linear and Ehlers-adjusted models and the unadjusted IOP measurements with and without fluorescein.
Results from the study show that the IOPs with and without fluorescein using the Linear and the Ehlers models were significantly higher than their corresponding unadjusted IOP measurements. A study27 comparable to the present one recounts that correction models, such as the Ehlers models, overestimate the predicted effect of CCT on IOP measurements using GAT.
Clinicians should therefore take cautionary measures when using these correction factors in measuring patients' IOPs. A major practical limitation that influenced the minimal sample size was the limited availability of participants during the study period.
Conclusion
We determined the agreement between IOP measurements with and without fluorescein on GAT. IOP measurements without fluorescein were significantly lower compared to IOP measurements with fluorescein with GAT; this difference was also clinically meaningful. This suggests that IOP measurement without fluorescein is not a better substitute for IOP measurement with fluorescein, especially in the Ghanaian population. Furthermore, IOP correction factor models, Ehlers and Linear, resulted in overestimated values compared to their corresponding unadjusted findings with and without fluorescein on GAT.
The reference list from the paper itself. Each links out to its DOI / PubMed record.
- 1Parsadaniantz SM Goazigo AR Sapienza A Habas C Baudouin C Glaucoma: a degenerative 295 optic neuropathy related to neuroinflammation?Cells 2020935353210663010.3390/cells 9030535 PMC 7140467 · doi ↗ · pubmed ↗
- 2Harasymowycz P Birt C Gooi P Heckler L Hutnik C Jinapriya D Medical management of glaucoma in the 21st century from a Canadian perspective J Ophthalmol 201620166509809 doi:10.1155/2016/65098092789593710.1155/2016/6509809 PMC 5118538 · doi ↗ · pubmed ↗
- 3Sihota R Angmo D Ramaswamy D Dada T Simplifying target intraocular pressure for different stages of primary open-angle glaucoma and primary angle-closure glaucoma Indian J Ophthalmol 2018664495505 doi: 10.4103/ijo.IJO_1130_172958280810.4103/ijo.IJO_1130_17PMC 5892050 · doi ↗ · pubmed ↗
- 4Miglior S Bertuzzi F Relationship between intraocular pressure and glaucoma onset and progression Curr Opin Pharmacol 201313132352312202610.1016/j.coph.2012.09.014 · doi ↗ · pubmed ↗
- 5Kingman S Glaucoma is second leading cause of blindness globally Bull World Health Organ 2004 Dec 14821188788815640929 PMC 2623060 · pubmed ↗
- 6Quigley HA Broman AT The number of people with glaucoma worldwide in 2010 and 2020 Br. J. Ophthalmol 20069026226721648894010.1136/bjo.2005.081224 PMC 1856963 · doi ↗ · pubmed ↗
- 7Tham Y Li X Wong TY Quigley HA Aung T Cheng C Global prevalence of glaucoma and projections of glaucoma burden through 2040: a systematic review and meta-analysis Ophthalmology 20141211120812090 doi: 10.1016/j.ophtha.2014.05.0132497481510.1016/j.ophtha.2014.05.013 · doi ↗ · pubmed ↗
- 8Coleman AL Kodjebacheva G Risk factors for Glaucoma Needing More Attention Open J. Ophthalmol 20083384210.2174/1874364100903010038 PMC 275910419816585 · doi ↗ · pubmed ↗