Cervical Elastography as a Predictive Tool for Preterm Birth: A Systematic Review and Meta-analysis
Evgenia Angelopoulou, Kleanthi Gourounti, Angeliki Bolou, Maria Manesi, Athina Diamanti

TL;DR
Cervical elastography shows promise as a tool to predict preterm birth, with different techniques performing better at different stages of pregnancy.
Contribution
This study provides a meta-analysis of cervical elastography's diagnostic accuracy for predicting preterm birth and compares the performance of SE and SWE.
Findings
Cervical elastography has a pooled sensitivity of 77.1% and specificity of 73.3% for predicting spontaneous preterm birth.
SWE tends to perform better in later gestation, while SE is more effective in early to mid-trimester assessments.
The pooled AUC of 0.82 indicates moderate to good diagnostic accuracy for cervical elastography.
Abstract
Cervical elastography, including strain elastography (SE) and shear wave elastography (SWE), is an emerging ultrasound technique for assessing cervical stiffness, potentially enabling earlier prediction of spontaneous preterm birth than conventional sonographic measurements. However, its diagnostic performance and optimal application timing remain unclear. A systematic review and meta-analysis was conducted to evaluate the diagnostic accuracy of cervical elastography for predicting spontaneous preterm birth. Databases were searched for studies published between January 2014 and March 2025. Eligible studies assessed SE or SWE in pregnant women and reported sensitivity, specificity, and/or area under the receiver operating characteristic curve (AUC) for spontaneous preterm birth prediction. Data were extracted, and pooled estimates of sensitivity, specificity, diagnostic odds ratio (DOR),…
Genes, proteins, chemicals, diseases, species, mutations and cell lines named across the full text — each resolved to its canonical identifier and authoritative record.
Click any figure to enlarge with its caption.
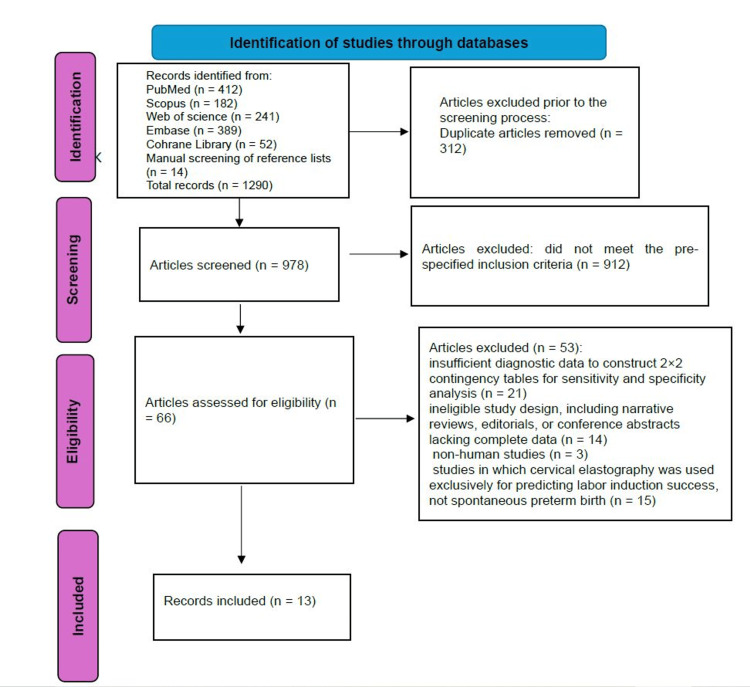 Figure 1
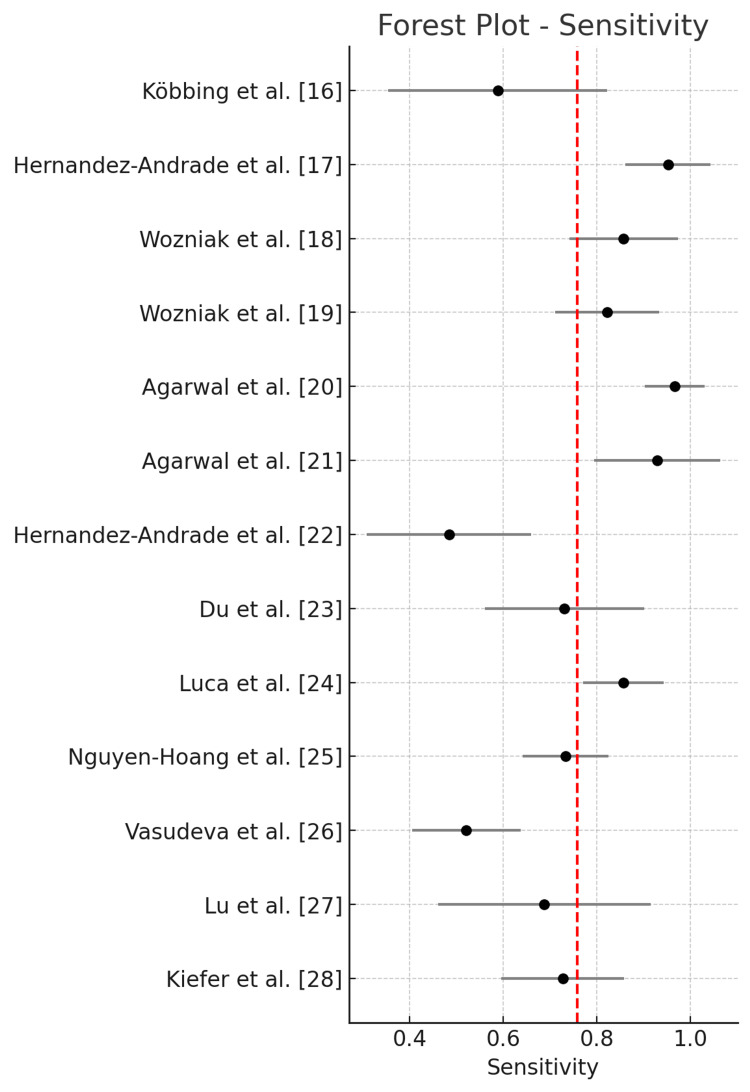 Figure 2
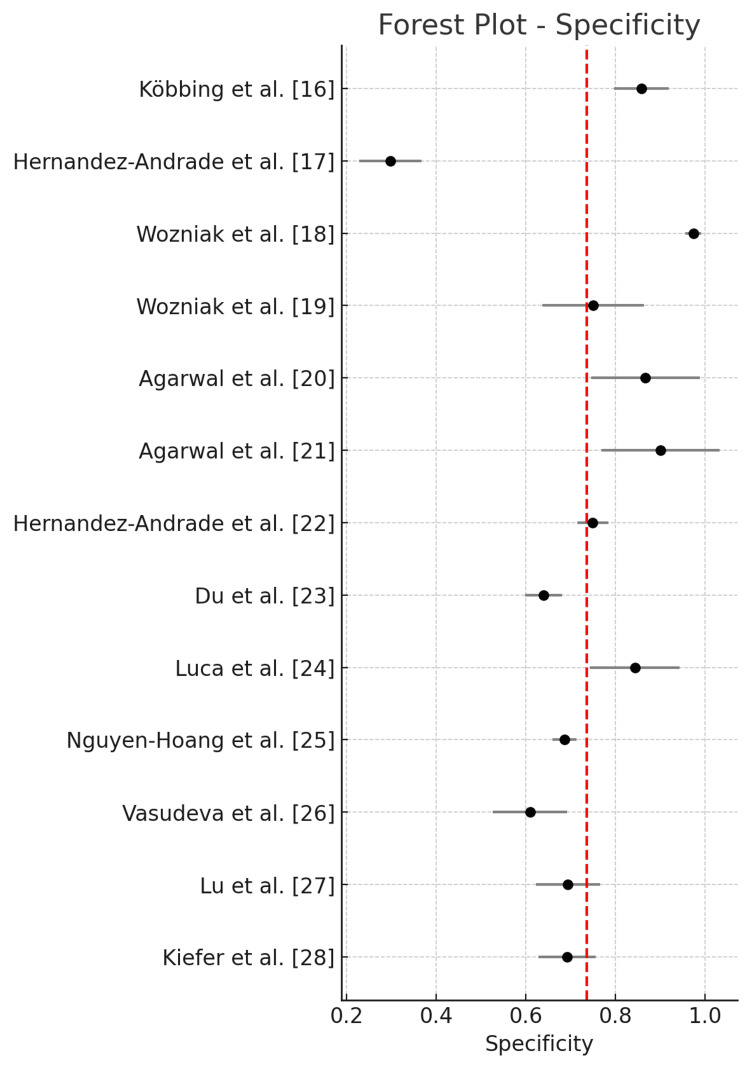 Figure 3
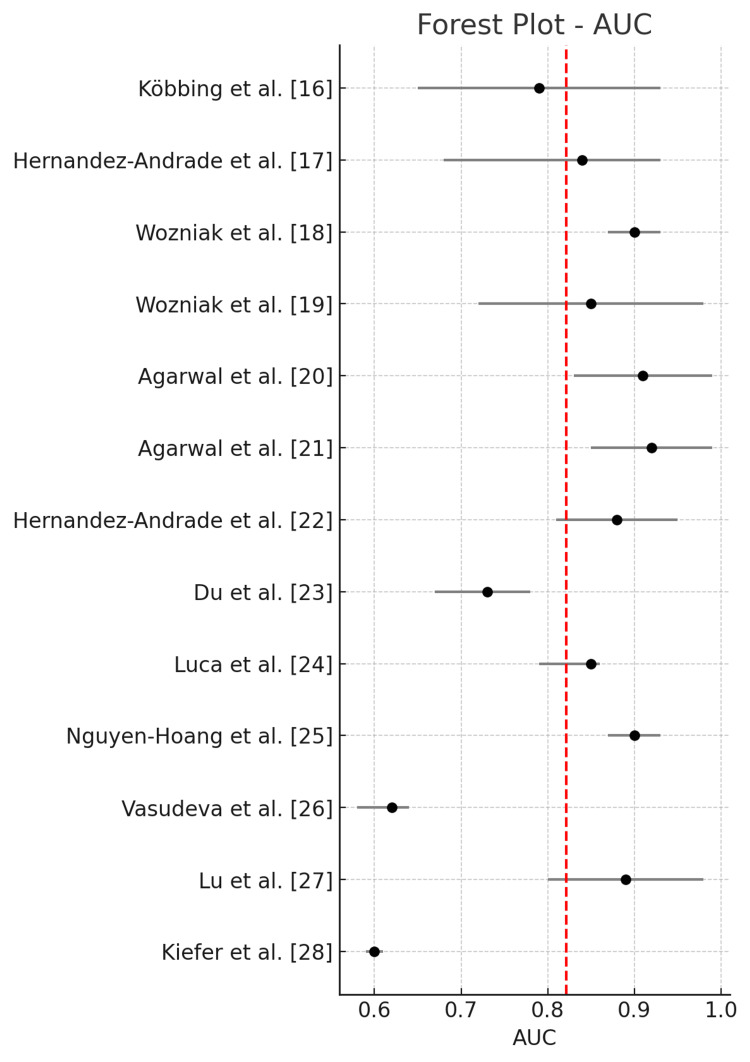 Figure 4
| Citation/country | Study design | Population | Sample size (analyzed) | Ultrasound system | Elastography type | ROI/reference tissue | Outcome definition | Primary outcome prevalence | Diagnostic accuracy (all sPTD) | Conclusion | |
| Köbbing et al. (2014) [ | Prospective observational | Pregnant women at ~26 weeks' gestation, evaluated by transvaginal ultrasound elastography | 182 | Not specified | Strain elastography | Four regions of interest on the anterior cervical lip | Spontaneous preterm delivery before 37 weeks | 11.9% | Sens 59%, spec 86%, OR 1.474 per 0.1 increase in Rselective (p = 0.002) | Cervical strain measurement with ultrasound elastography shows correlation with sPTD risk, with high specificity | |
| Hernandez-Andrade et al. (2014) [ | Cross-sectional observational | Singleton pregnancies, asymptomatic women at 16–24 weeks’ gestation | 189 | Hitachi HI Vision 900, 8–4 MHz transvaginal | Strain elastography (Hitachi HI Vision 900, 8–4 MHz transvaginal probe) | Six ROIs: endocervix and entire cervix in sagittal, internal os, and external os views | Spontaneous preterm delivery < 37 weeks | 11% | OR 0.17 (95% CI 0.03–0.9) and OR 0.20 (95% CI 0.04–0.9), respectively, after adjustment | Low strain (stiffer tissue) in internal os independently associated with markedly reduced sPTD risk | |
| Wozniak et al. (2014) [ | Prospective observational | Singleton pregnancies, asymptomatic women at 18–24 weeks’ gestation | 337 | Hitachi EUB-7500 | Strain elastography | Internal os region/reference: anterior cervical lip near bladder wall | Spontaneous preterm delivery before 37 weeks | 35/337 (9.9%) | Sens 71.4%, spec69.0%, PPV 32.3%, NPV 91.9%, LR+ 2.30, LR– 0.41, DOR 5.61 | Strain elastography can be a useful adjunct to cervical length measurement in predicting sPTD, especially early cases | |
| Woźniak et al. (2015) [ | Prospective observational | Pregnant women at 18–22 weeks with cervical length ≤ 25 mm | 101 | Not specified | Strain elastography (color map assessment) | Internal os region/color-coded stiffness (red, yellow, blue, purple) | Spontaneous preterm delivery before 37 weeks | 45/109 (44.6%) | Sens 82.2%, spec 75.0%, PPV 72.5%, NPV 84.0% | Elastographic evaluation of the internal cervical os in women with short cervical length can improve prediction of PTD; warm colors (red/yellow) indicate higher risk | |
| Agarwal et al. (2018) [ | Prospective observational case–control | Pregnant women 28–37 weeks GA; preterm group: clinical PTL; term group: ≥37 weeks not in labor; exclusion: multiple gestations, severe maternal/fetal comorbidities | 60 | Acuson S2000 (Siemens Healthcare) | Shear wave elastography (ARFI / VTQ) | Anterior cervical wall close to internal os (depth < 80 mm) | Preterm birth (<37 weeks) | 30/60 (50%) | Sens 96.7%, spec 87% | Shear wave elastography of antenatal cervix is a strong predictor of preterm birth, outperforming cervical length | |
| Agarwal et al. (2018) [ | Prospective observational | Primigravida women, 28–37 weeks GA, with symptoms suggestive of preterm labor; exclusions: ruptured membranes, advanced labor, prior preterm birth, cervical surgery, multiple gestation, polyhydramnios | 34 | Acuson S2000 (Siemens Healthcare) | ARFI-based shear wave elastography (VTQ) + elastography index (EI) | Anterior wall of internal os, depth < 80 mm | Preterm birth (<37 weeks) | 14/34 (41.2%) | Sens 93%, spec 90% | Strain elastography provides good predictive accuracy for sPTD in asymptomatic mid-trimester women and may complement cervical length measurement | |
| Hernandez-Andrade et al. (2018) [ | Prospective observational | Singleton pregnancies, asymptomatic women at 20–24 weeks GA; exclusions: fetal anomalies, maternal comorbidities, multiple gestations | 628 | Samsung Medison WS80A | Shear wave elastography | Internal os region, anterior cervical lip near bladder wall | Spontaneous preterm delivery before 37 weeks | 43/628 (6.8%) | Sens 65%, spec 74% | Shear wave elastography at mid-trimester is a useful tool to predict sPTD, particularly when combined with cervical length measurement | |
| Du et al. (2019) [ | Prospective nested case–control | Low-risk, asymptomatic singleton pregnancies assessed at 11–14, 20–24, 28–32 weeks | 553 | Samsung WS80A with ElastoScan; E-Cervix tool | Strain elastography | Internal os, external os, and whole-cervix ROI (semi-automatic) | Spontaneous preterm delivery < 37 weeks | 26/553 eligible (4.7%) | IOS-2: sens 72.73%, spec 64.23%, PPV 14.68%, NPV 96.53%, LR+ 2.03, LR– 0.42. | ||
| Luca et al. (2023) [ | Prospective observational | Singleton pregnancies, high-risk for PTB (short cervix <2.5 cm or ≥2 risk factors), 18–24 weeks GA | 114 | GE Voluson E10 | Strain elastography | Anterior & posterior lips of internal os/reference: anterior and posterior lips of external os | Spontaneous PTB <37 weeks | 63/114 (55.3%) | Sens 85.71%, spec 84.31%, PPV 87.10%, NPV 82.69% | SR < 0.93 independently associated with increased PTB risk; combined model with cervical length + maternal risk factors improved AUROC to 0.938 | |
| Nguyen‐Hoang et al. (2024) [ | Prospective observational | Unselected singleton and twin pregnancies | 1264 (1143 singleton, 121 twin) | Philips EPIQ 7 | Shear wave elastography | Internal os region/reference: external os posterior lip | Spontaneous PTB < 37 weeks | Singleton: 57/1143 (5.0%); Twin: 33/121 (27.3%) | Across gestation, CL shorter in sPTB (p < 0.001); significant at 21+0–24+6 w (p = 0.039) and 28+0–32+6 w (p < 0.001). CSWE lower in sPTB (p = 0.013); significant only at 11+0–15+6 w (p = 0.036). | Cervical softening (first trimester, 11+0–15+6 w) precedes cervical shortening (from late second trimester, ≥21+0 w) in sPTB. First-trimester CSWE may allow early identification of high-risk women | |
| Vasudeva et al. (2024) [ | Prospective observational | Asymptomatic pregnant women, 16–24 wks GA, with ≥1 high-risk factor for sPTD or CL < 2.5 cm | 204 | GE Voluson E-8 | Strain elastography | Internal os (sagittal view), whole cervix (sagittal), internal os (axial)/stiffest area outside cervix (posterior/lateral, ligament insertion) | Delivery before 37 wks (after 26 wks), spontaneous labour onset or after PPROM; excludes indicated PTD | 71/204 (34.8%) | Sens 52.11%, spec 60.9%, PPV 41.57%, NPV 70.44%, LR+ 1.33, LR– 0.79, DOR 1.69, OA 57.84% | The study concluded that TVS-guided cervical strain elastography is a better independent predictor of spontaneous preterm delivery than cervical length measurement in asymptomatic, high-risk women during the mid-trimester, with modest overall predictive accuracy but strong negative predictive value for early preterm birth, supporting its use as an adjunctive tool in high-risk settings, particularly in low- and middle-income countries to target monitoring and interventions effectively | |
| Lu et al. (2024)[ | Prospective observational | Singleton pregnancies, asymptomatic women at 20–24 weeks GA | 176 | Mindray Resona 8 | Shear wave elastography | Internal os region/reference: posterior cervical lip | Spontaneous preterm delivery before 37 weeks | 16/176 (18.2%) | Sens 71.4%, spec 69.3%, PPV 34.2%, NPV 91.3%, LR+ 2.33, LR– 0.41, DOR 5.68 | Lower cervical stiffness significantly associated with higher risk of sPTD (aOR 0.26, 95% CI 0.11–0.59) | |
| Kiefer et al. (2025) [ | Prospective cohort | Singleton pregnancies, asymptomatic women at 18–24 weeks GA | 245 | GE Voluson E10 | Shear wave elastography | Internal os region/reference: posterior cervical lip | Spontaneous preterm delivery before 37 weeks | 44/245 (18%) | Sens 73.3%, spec 69.0%, PPV 35.9%, NPV 92.3%, LR+ 2.36, LR– 0.39, DOR 6.05 | Lower cervical stiffness values independently predicted sPTD (aOR 0.28, 95% CI 0.13–0.59) | |
| Study | Year | AUC | AUC 95% CI | TP | FP | FN | TN |
| Köbbing et al. [ | 2014 | 0.79 | 0.65-0.93 | 10 | 18 | 7 | 108 |
| Hernandez-Andrade et al. [ | 2014 | 0.84 | 0.68-0.93 | 20 | 118 | 1 | 50 |
| Wozniak et al. [ | 2014 | 0.9 | 0.87-0.93 | 30 | 8 | 5 | 290 |
| Wozniak et al. [ | 2015 | 0.85 | 0.72-0.98 | 37 | 14 | 8 | 42 |
| Agarwal et al. [ | 2018a | 0.91 | 0.83-0.99 | 29 | 4 | 1 | 26 |
| Agarwal et al. [ | 2018b | 0.92 | 0.85-0.99 | 13 | 2 | 1 | 18 |
| Hernandez-Andrade et al. [ | 2018 | 0.88 | 0.81-0.95 | 15 | 150 | 16 | 447 |
| Du et al. [ | 2019 | 0.73 | 0.67-0.78 | 19 | 190 | 7 | 337 |
| Luca et al. [ | 2023 | 0.85 | 0.79-0.86 | 54 | 8 | 9 | 43 |
| Nguyen-Hoang et al. [ | 2024 | 0.9 | 0.87-0.93 | 66 | 369 | 24 | 805 |
| Vasudeva et al. [ | 2024 | 0.62 | 0.58-0.64 | 37 | 52 | 34 | 81 |
| Lu et al. [ | 2024 | 0.89 | 0.80-0.98 | 11 | 49 | 5 | 111 |
| Kiefer et al. [ | 2025 | 0.6 | 0.59-0.61 | 32 | 62 | 12 | 139 |
| Metric | Pooled | Lower 95% CI | Upper 95% CI | Tau² | I² (%) |
| Sensitivity | 0.771 | 0.686 | 0.856 | 0.02 | 85.5 |
| Specificity | 0.733 | 0.631 | 0.836 | 0.034 | 98.4 |
| LR+ | 3.056 | 2.249 | 4.152 | 0.251 | 91.2 |
| LR− | 0.342 | 0.241 | 0.483 | 0.262 | 77.5 |
| DOR | 11.052 | 5.484 | 22.272 | 1.29 | 86.1 |
| AUC | 0.82 | 0.728 | 0.913 | 0.027 | 98.7 |
| Covariates | Subgroup | Sensitivity (95% CI) | p (sensitivity) | I² Sens | Specificity (95% CI) | p (Specificity) | I² spec | AUC (95% CI) | p (AUC) | I² AUC |
| Elastography mode | SE | 0.773 (0.658-0.889) | 0.280 | 84.7% | 0.710 (0.521-0.899) | <0.001 | 98.9% | 0.795 (0.689-0.901) | <0.001 | 96.9% |
| Elastography mode | SWE | 0.766 (0.625-0.907) | 88.1% | 0.740 (0.690-0.790) | 78.0% | 0.849 (0.682-1.016) | 99.1% | |||
| Population | Symptomatic | 0.913 (0.822-1.004) | 0.000 | 58.6% | 0.835 (0.743-0.926) | 0.048 | 40.3% | 0.906 (0.858-0.955) | 0.000 | 0.0% |
| Population | Asymptomatic | 0.726 (0.628-0.824) | 83.1% | 0.704 (0.586-0.823) | 98.8% | 0.799 (0.695-0.903) | 98.9% | |||
| Pregnancy trimester | Second trimester only | 0.736 (0.648-0.825) | <0.001 | 81.5% | 0.708 (0.596-0.821) | <0.001 | 98.6% | 0.803 (0.704-0.902) | <0.001 | 98.8% |
| Pregnancy trimester | Third trimester | 0.960 (0.902-1.018) | 0.0% | 0.882 (0.793-0.971) | 0.0% | 0.916 (0.863-0.968) | 0.0% |
| Metric | Criterion | Study removed | Pooled | Lower 95% CI | Upper 95% CI | I² (%) |
| Sensitivity | Highest pooled | Vasudeva et al. [ | 0.798 | 0.723 | 0.874 | 79.63 |
| Sensitivity | Lowest heterogeneity (I²) | Vasudeva et al. [ | 0.798 | 0.723 | 0.874 | 79.63 |
| Specificity | Highest pooled | Hernandez-Andrade et al. [ | 0.77 | 0.677 | 0.862 | 97.86 |
| Specificity | Lowest heterogeneity (I²) | Wozniak et al. [ | 0.71 | 0.638 | 0.782 | 94.53 |
| AUC | Highest pooled | Kiefer et al. [ | 0.839 | 0.768 | 0.911 | 95.72 |
Peer Reviews
No public reviews on file for this paper yet. If you reviewed it on a platform where reviews are public (OpenReview, ICLR, NeurIPS, ICML), you can paste yours below so the community can read it here.
Videos
No videos yet. Explain this paper in a talk, walkthrough, or lecture? Add one.
Taxonomy
TopicsPreterm Birth and Chorioamnionitis · Pelvic floor disorders treatments · Scoliosis diagnosis and treatment
Introduction and background
Preterm birth, defined as delivery before 37 completed weeks of gestation, remains a leading cause of neonatal morbidity and mortality worldwide, accounting for over one-third of neonatal deaths and posing long-term neurodevelopmental and socioeconomic consequences [1]. It is classified into three subtypes based on gestational age: extremely preterm (<28 weeks), very preterm (28 to <32 weeks), and moderate to late preterm (32 to <37 weeks) [1]. Recent global estimates suggest that approximately 13.4 million babies were born preterm in 2020, with nearly 900,000 deaths in children under five years attributed to preterm birth-related complications in 2019 [1].
Despite advances in perinatal care, the global preterm birth rate remains high, estimated at ~10% of all live births, with significant variations between and within countries [2]. In the United States, a slight upward trend has been observed, with the rate rising from 10.1% in 2020 to 10.4% in 2022 [3].
The burden of preterm birth lies not only in its immediate perinatal consequences, such as respiratory distress syndrome, intraventricular hemorrhage, necrotizing enterocolitis, and neonatal sepsis, but also in its long-term sequelae, including neurodevelopmental disorders, feeding difficulties, and increased healthcare costs. The risk and severity of complications are inversely correlated with gestational age at delivery [3,4].
Current strategies to assess the risk of spontaneous preterm birth rely predominantly on transvaginal ultrasound measurement of cervical length (CL) and the detection of fetal fibronectin in cervicovaginal secretions [5,6]. However, these modalities show limited predictive performance, particularly in asymptomatic women without a prior history of preterm birth [7].
A growing body of evidence highlights that biomechanical and microstructural remodeling of the cervix, including collagen breakdown, changes in the extracellular matrix, and progressive softening of cervical tissue, precedes measurable shortening of the cervix [8,9]. These changes may remain undetected by conventional sonographic assessment, thereby necessitating the development of novel imaging modalities capable of evaluating tissue mechanical properties non-invasively and at an earlier stage [10].
Ultrasound elastography, an emerging imaging technique that quantifies tissue stiffness, has shown promise in this context. Two main approaches are currently in use: strain elastography (SE), which measures tissue deformation under applied pressure, and shear wave elastography (SWE), which evaluates stiffness based on the propagation speed of mechanically induced shear waves [11]. In obstetrics, cervical elastography has been proposed as a tool to identify women at high risk for spontaneous preterm birth, with the potential to detect early cervical softening even before shortening occurs [12]. Advanced systems using artificial intelligence have demonstrated improved diagnostic performance in asymptomatic populations [13].
Given the accumulation of new evidence, including studies employing novel elastographic platforms and incorporating machine learning algorithms, there is a pressing need to update the current synthesis of data. The present systematic review and meta-analysis aims to critically evaluate the diagnostic performance of cervical elastography in predicting spontaneous preterm birth.
Review
Materials and methods
This systematic review and meta-analysis was conducted in accordance with the Preferred Reporting Items for Systematic Reviews and Meta-Analyses (PRISMA) guidelines [14] and followed the methodological framework for diagnostic accuracy reviews. The protocol was registered in the International Prospective Register of Systematic Reviews (PROSPERO; ID No. CRD420251119987).
Search Strategy
A comprehensive literature search was performed in PubMed, Embase, Web of Science, Scopus, and the Cochrane Library to identify relevant studies published from January 1, 2014, to June 30, 2025. The search combined MeSH terms and free-text keywords including the following: “cervical elastography”, “ultrasound elastography”, “shear wave elastography”, “strain elastography”, “preterm birth”, and “preterm delivery”. No language restrictions were applied during the initial search. Reference lists of included articles and relevant reviews were manually screened to identify additional eligible studies.
Inclusion and Exclusion Criteria
We included prospective cohort studies and case-control studies that (a) assessed cervical stiffness using ultrasound elastography (strain elastography (SE) or shear wave elastography (SWE)); (b) included pregnant women with or without symptoms of preterm labor; (c) reported preterm birth (<37 weeks of gestation) as an outcome; (d) provided sufficient data to construct 2 × 2 contingency tables (true positives (TP), false positives (FP), false negatives (FN), true negatives (NT)) for the prediction of spontaneous preterm birth; and (e) used a reference standard of clinical diagnosis of gestational age at delivery.
Exclusion criteria were reviews, editorials, conference abstracts without full data, non-human studies, and studies using elastography solely for labor induction prediction.
PRISMA process
Two reviewers independently screened titles and abstracts for eligibility. Full-text articles of potentially eligible studies were assessed against inclusion criteria. Disagreements were resolved by consensus or third-party adjudication.
The systematic search across five electronic databases yielded 1276 unique records (PubMed: 412; Embase: 389; Web of Science: 241; Scopus: 182; Cochrane Library: 52). A further 14 potentially relevant records were retrieved through manual screening of the reference lists of eligible articles and relevant reviews, bringing the total to 1290 records prior to duplicate removal.
Following the removal of 312 duplicate entries, 978 records proceeded to title and abstract screening. At this stage, 912 records were excluded because they did not meet the pre-specified inclusion criteria, most commonly due to irrelevance to the research question (e.g., absence of cervical elastography assessment, no preterm birth outcome reported, or unrelated clinical context).
The remaining 66 articles underwent full-text review to determine final eligibility. After detailed assessment, 53 studies were excluded for the following reasons: (a) insufficient diagnostic data to construct 2 × 2 contingency tables for sensitivity and specificity analysis (n = 21); (b) ineligible study design, including narrative reviews, editorials, or conference abstracts lacking complete data (n = 14); (c) non-human studies (n = 3); and (d) studies in which cervical elastography was used exclusively for predicting labor induction success, not spontaneous preterm birth (n = 15).
Ultimately, 13 studies fulfilled all eligibility criteria and were included in both the qualitative synthesis and the quantitative meta-analysis.
The study selection process is illustrated in Figure 1.
Flowchart of the study selection process.
Quality Assessment
The Quality Assessment of Diagnostic Accuracy Studies-2 (QUADAS-2) tool was used to evaluate the risk of bias and applicability across four domains: patient selection, index test, reference standard, and flow/timing [15]. Quality assessment results are available in Appendix 1.
Data Extraction
From each study, the following data were extracted: first author, year of publication, country, study design, sample size, prevalence of the primary outcome, diagnostic modality (SE vs. SWE), ultrasound approach (transvaginal vs. transabdominal), population type (symptomatic vs. asymptomatic), gestational age at assessment (second vs. third trimester), and performance metrics (area under the curve (AUC) with 95% confidence intervals (CIs), sensitivity, specificity). Where necessary, 95% CIs were used to back-calculate standard errors.
Outcomes
The primary outcomes were pooled sensitivity, pooled specificity, and pooled AUC for the index test in predicting preterm birth. Secondary outcomes included the positive likelihood ratio (LR+), negative likelihood ratio (LR−), and diagnostic odds ratio (DOR).
Statistical Analysis
Study-specific sensitivity and specificity were calculated from 2 × 2 contingency tables. Meta-analyses of proportions were conducted using the logit transformation to stabilize variances. For sensitivity and specificity, the standard error (StE) was calculated from the binomial distribution as:
StE(p) = √[ p × (1 − p) / n ]
where p is the proportion and n is the relevant denominator (TP + FN for sensitivity, TN + FP for specificity).
For the area under the curve (AUC), the standard error was derived from the reported 95% confidence interval (CI) using the formula:
StE = (Upper CI − Lower CI) / (2 × 1.96)
The variance of the logit-transformed AUC was estimated using the delta method:
Var(logit(p)) ≈ Var(p) / [ p² × (1 − p)² ]
Pooled estimates for each metric were obtained using a random-effects model (DerSimonian-Laird method) with inverse-variance weighting. Statistical heterogeneity was assessed using Cochran’s Q and quantified with I², with values >50% indicating substantial heterogeneity. Between-study variance was reported as τ².
Subgroup Analyses
To explore potential sources of heterogeneity, subgroup analyses were conducted by: (a) SE vs. SWE; (b) population type, symptomatic vs asymptomatic women; and (c) gestational age, second vs. third trimester. Each subgroup analysis used the same random-effects model, and both subgroup levels were displayed in the same forest plot for direct comparison.
Leave-One-Out Sensitivity Analysis
A leave-one-out (LOO) analysis was performed to assess the robustness of pooled estimates by sequentially omitting each study and recalculating the pooled sensitivity, specificity, and AUC. The studies whose removal resulted in the highest pooled estimate or the lowest heterogeneity (I²) for each metric were identified.
Software
All analyses were conducted in Python (v3.11) (Python Software Foundation, Wilmington, NC, USA) using pandas, numpy, and matplotlib for data handling and visualization. The meta-analytic calculations, transformations, and variance estimations were implemented with custom code following established statistical methods for diagnostic accuracy studies.
Results
Study Characteristics
A total of 13 studies published between 2014 and 2025 were included [16-28]. Sample sizes ranged from 34 to 1264. The prevalence of the primary outcome varied widely, from 4.7% to 55.3%, reflecting differences in study populations, settings, and outcome definitions. Most studies adopted a cross-sectional design. The majority used SE via a transvaginal approach, although several used SWE. Both symptomatic and asymptomatic populations were represented, and the gestational age at assessment ranged from the second to the third trimester.
Summary of the baselines characteristics of the included studies is given in Table 1.
Overall Diagnostic Accuracy
Table 2 summarizes the diagnostic performance metrics from included studies, including AUC (95% CI) and 2 × 2 table parameters.
The pooled diagnostic performance across all studies using a random-effects model showed a sensitivity of 0.771 (95% CI: 0.686-0.856), specificity of 0.733 (95% CI: 0.631-0.836), and an AUC of 0.820 (95% CI: 0.728-0.913). The positive likelihood ratio (LR+) was 3.056 (95% CI: 2.249-4.152), the negative likelihood ratio (LR-) was 0.342 (95% CI: 0.241-0.483), and the DOR was 11.052 (95% CI: 5.484-22.272). Statistical heterogeneity was high for sensitivity (I² = 85.5%), specificity (I² = 98.4%), and AUC (I² = 98.7%), indicating substantial between-study variability.
Table 3 summarizes the pooled sensitivity, specificity, likelihood ratios, DOR, and AUC, using a random-effects model.
Forest plot of pooled sensitivity across all included studies is illustrated in Figure 2.
Forest plot of pooled sensitivity across all included studies.
Forest plot of pooled specificity across all included studies is illustrated in Figure 3.
Forest plot of pooled specificity across all included studies.
Figure 4 illustrates the forest plot of pooled AUC across all included studies.
Forest plot of pooled AUC across all included studies.
Subgroup Analyses
Subgroup analyses were deemed essential due to the substantial heterogeneity observed in the overall pooled results, suggesting important differences between the included studies. Factors such as elastography modality (strain vs. shear wave), population characteristics (symptomatic vs. asymptomatic), and gestational age at assessment (second vs. third trimester) are all likely to influence sensitivity, specificity, and overall diagnostic accuracy. By systematically examining these variables through subgroup analyses, we aimed to better understand the conditions under which the technique achieves its highest diagnostic performance. This approach also helps to identify specific populations and technical settings that yield the greatest predictive value, thereby supporting more informed clinical decision-making and enabling more tailored patient care.
Elastography Modality: Strain Elastography (SE) vs. Shear Wave Elastography (SWE)
In the subgroup analysis, SE studies demonstrated a pooled sensitivity of 0.773 (95% CI: 0.658-0.889, I² = 84.7%), pooled specificity of 0.710 (95% CI: 0.521-0.899, I² = 98.9%), and pooled AUC of 0.795 (95% CI: 0.689-0.901, I² = 96.9%).
SWE studies showed a pooled sensitivity of 0.766 (95% CI: 0.625-0.907, I² = 88.1%), pooled specificity of 0.740 (95% CI: 0.690-0.790, I² = 78.0%), and pooled AUC of 0.849 (95% CI: 0.682-1.016, I² = 99.1%).
Overall, SWE appeared to outperform SE in specificity, with a slightly higher AUC, suggesting superior diagnostic performance in predicting spontaneous preterm delivery. However, heterogeneity remained high within both subgroups, indicating that elastography modality alone does not account for the observed variability.
Symptomatic vs. Asymptomatic Populations
In symptomatic populations, pooled sensitivity was 0.913 (95% CI: 0.822-1.004; I² = 58.6%) and specificity was 0.835 (95% CI: 0.743-0.926; I² = 40.3%). In asymptomatic cohorts, sensitivity was 0.726 (95% CI: 0.628-0.824; I² = 83.1%) and specificity was 0.704 (95% CI: 0.586-0.823; I² = 98.8%). AUC estimates were 0.906 (95% CI: 0.858-0.955; I² = 0.0%) for symptomatic and 0.799 (95% CI: 0.695-0.903; I² = 98.9%) for asymptomatic groups. Heterogeneity was lower in symptomatic studies, suggesting that symptom status may influence both diagnostic performance and consistency of results.
Second Trimester Only vs. Third Trimester
Pooled sensitivity was 0.736 (95% CI: 0.648-0.825; I² = 81.5%) for the second trimester and 0.960 (95% CI: 0.902-1.018; I² = 0.0%) for the third trimester. Specificity was 0.708 (95% CI: 0.596-0.821; I² = 98.6%) and 0.882 (95% CI: 0.793-0.971; I² = 0.0%) for the second and third trimesters, respectively.
AUC was 0.803 (95% CI: 0.704-0.902; I² = 98.8%) in the second trimester and 0.916 (95% CI: 0.863-0.968; I² = 0.0%) in the third trimester. The lack of heterogeneity in third-trimester studies and significantly higher values across all metrics suggest that gestational age strongly influences diagnostic performance.
Across all subgroup analyses, diagnostic performance varied meaningfully by patient and methodological factors. Elastography mode analysis showed that SE achieved significantly higher specificity and AUC compared to SWE, while sensitivity was similar between modalities. Symptom status emerged as an important modifier: symptomatic women had markedly higher sensitivity, specificity, and AUC, with lower heterogeneity, indicating more consistent and accurate prediction of spontaneous preterm delivery in this group. Trimester of assessment also influenced performance, with third-trimester measurements showing substantially higher sensitivity, specificity, and AUC compared to second-trimester assessments, and virtually no heterogeneity, suggesting more stable diagnostic behavior later in pregnancy.
Taken together, these findings indicate that elastography’s predictive accuracy is not uniform across settings: optimal performance is observed when applied in symptomatic women in the third trimester using SE.
Subgroup analyses are displayed in Table 4.
Leave-One-Out Analyses
To further explore heterogeneity and assess robustness, we performed LOO analyses for sensitivity, specificity, and AUC.
For sensitivity, the highest pooled estimate (0.798; 95% CI: 0.723-0.874; I² = 79.63%) was obtained when Vasudeva et al. [26] was excluded. The same study’s removal also yielded the lowest heterogeneity for sensitivity (I² = 79.63%).
For specificity, the highest pooled estimate (0.770; 95% CI: 0.677-0.862; I² = 97.86%) was observed when Hernandez-Andrade et al. [17] was excluded, whereas the lowest heterogeneity (I² = 94.53%; pooled specificity 0.710; 95% CI: 0.638-0.782) occurred upon removal of Wozniak et al. [18].
For AUC, the highest pooled value (0.839; 95% CI: 0.768-0.911; I² = 95.72%) was achieved when Kiefer et al. [28] was omitted.
In all cases, heterogeneity remained substantial, confirming that variability is not driven by a single study. Even after removing influential studies, I² reductions were minimal, suggesting heterogeneity is inherent to the dataset and likely reflects differences in study populations, designs, operator expertise, and elastography protocols.
Table 5 summarizes the LOO analyses.
Discussion
This systematic review and meta-analysis synthesized evidence from 13 studies published between 2014 and 2025 evaluating the diagnostic accuracy of cervical elastography for predicting spontaneous preterm birth. The pooled sensitivity of 77.1%, specificity of 73.3%, and AUC of 0.82 suggest that both SE and SWE provide moderate to good predictive performance, with a DOR of 11.05. Across the included studies, SWE tended to achieve higher sensitivity in later gestation, while SE often performed better in the early to mid-trimester. Importantly, some recent studies demonstrated that first-trimester SWE could detect cervical softening before any measurable cervical shortening, highlighting its potential role in identifying women at risk well before conventional ultrasound methods indicate a problem.
When compared with earlier reviews, our findings are broadly consistent with the meta-analysis by Wang et al. [12], who reported slightly higher pooled sensitivity and specificity of 84% and 82% respectively, with an AUC of 0.90 based on seven studies published up to 2018. That review also concluded that cervical elastography outperformed CL measurement in predicting preterm birth. The differences in pooled values between the two meta-analyses likely reflect our inclusion of a larger number of more recent studies that enrolled heterogeneous populations, including low-risk asymptomatic women, twin pregnancies, and women assessed as early as the first trimester. The narrative review by Gholamalipour et al. [29] emphasized the value of cervical elastography at 18-22 weeks in asymptomatic women, particularly for detecting abnormalities before clinical or sonographic evidence of cervical shortening. Our analysis supports this observation, while also extending the evidence base to show that diagnostic accuracy remains acceptable across a broader gestational range and with different elastographic techniques.
The implications of these findings are clinically significant. Cervical elastography appears to be a promising adjunct to CL measurement, offering the possibility of earlier and more accurate identification of women at risk for spontaneous preterm birth, even in populations where CL alone has limited predictive value. Early detection, especially during the first or early second trimester, could allow for targeted surveillance and timely preventive measures such as progesterone supplementation, cervical cerclage, or tailored antenatal care. The integration of elastography into clinical practice, however, will require standardization of acquisition protocols, region-of-interest definitions, and diagnostic cut-off values to reduce variability and ensure reproducibility.
This review has several notable strengths. It provides a comprehensive synthesis of literature spanning more than a decade, incorporating the most recent technological advancements in elastographic imaging. The inclusion of diverse populations and the exploration of subgroup analyses by technique, gestational age, and clinical risk status strengthen the generalizability of the findings. The statistical approach, including sensitivity analyses, adds robustness to the conclusions.
Nevertheless, limitations must be acknowledged. Statistical heterogeneity was high, with I² values exceeding 85% for sensitivity and over 98% for specificity and AUC, indicating substantial between-study variability. This heterogeneity likely arises from differences in study populations, ultrasound equipment, elastography algorithms, probe frequencies, region-of-interest placement, and cut-off thresholds, as well as the inherent operator dependency of strain elastography. Although subgroup analyses reduced heterogeneity in some comparisons, substantial variability persisted, underscoring the multifactorial nature of these differences and the urgent need for standardized measurement protocols.
Future research should focus on establishing internationally accepted technical standards for cervical elastography, including consistent cut-off values and acquisition procedures. Longitudinal studies are needed to track changes in cervical stiffness over the course of pregnancy and determine the optimal timing for measurement. The combination of elastography with CL, biochemical markers, and maternal history in integrated predictive models could further improve accuracy. As automated and AI-driven elastography analysis develops, there is an opportunity to reduce operator dependence and improve reproducibility. Cost-effectiveness analyses will also be important to determine whether this technology can be widely implemented, particularly in low-resource settings where preterm birth burden is highest.
Conclusions
This systematic review and meta-analysis demonstrates that cervical elastography provides moderate to good diagnostic accuracy for predicting spontaneous preterm birth, with complementary strengths observed between strain and shear wave techniques across different gestational stages. While the technology shows promise as an adjunct to cervical length measurement, its clinical utility is currently limited by methodological heterogeneity, lack of standardized acquisition protocols, and variability in diagnostic thresholds. Standardization efforts, integration with established predictors, and the application of automated or AI-assisted analysis may enhance reproducibility and broaden clinical adoption. Ultimately, cervical elastography represents a valuable emerging tool for risk stratification in preterm birth prevention, but further large-scale, longitudinal, and methodologically rigorous studies are required before it can be routinely implemented in clinical practice.
The reference list from the paper itself. Each links out to its DOI / PubMed record.
- 1National, regional, and global estimates of preterm birth in 2020, with trends from 2010: a systematic analysis Lancet Ohuma EO Moller AB Bradley E 126112714022023 https://www.thelancet.com/journals/lancet/article/PIIS 0140-6736(23)00878-4/fulltext 3780521710.1016/S 0140-6736(23)00878-4 · doi ↗ · pubmed ↗
- 2Global, regional, and national burden of preterm birth, 1990-2021: a systematic analysis from the global burden of disease study 2021 E Clinical Medicine Liang X Lyu Y Li J Li Y Chi C 1028407620243938615910.1016/j.eclinm.2024.102840 PMC 11462015 · doi ↗ · pubmed ↗
- 3Born too soon: global epidemiology of preterm birth and drivers for change Reprod Health Bradley E Blencowe H Moller AB 1052220254055119210.1186/s 12978-025-02033-x PMC 12186353 · doi ↗ · pubmed ↗
- 4Long-term health outcomes of preterm birth: a narrative review Front Pediatr Gette F Aziz Ali S Ho MS 15658971320254033680010.3389/fped.2025.1565897 PMC 12055779 · doi ↗ · pubmed ↗
- 5Complications of preterm birth-the importance of care for the outcome: a narrative review Medicina (Kaunas) Zivaljevic J Jovandaric MZ Babic S Raus M 10146020243892963110.3390/medicina 60061014 PMC 11205595 · doi ↗ · pubmed ↗
- 6Predicting preterm birth: cervical length and fetal fibronectin Semin Perinatol Son M Miller ES 4454514120172893526310.1053/j.semperi.2017.08.002PMC 6033518 · doi ↗ · pubmed ↗
- 7Preterm birth: screening and prediction Int J Womens Health Creswell L Rolnik DL Lindow SW O'Gorman N 198119971520233814658710.2147/IJWH.S 436624 PMC 10749552 · doi ↗ · pubmed ↗
- 8The cervix as a biomechanical structure Ultrasound Obstet Gynecol House M Socrate S 7457492820061706345110.1002/uog.3850 · doi ↗ · pubmed ↗