Bio-inspired neutrosophic-enzyme intelligence framework for pediatric dental disease detection using multi-modal clinical data
Hanaa Salem Marie, Mostafa Elbaz, Riham S. Soliman, Mona Elshirbini Hafez, Amira Abdelhafeez Elkhatib

TL;DR
A new AI framework improves pediatric dental disease detection by combining biological principles and uncertainty modeling, offering higher accuracy and efficiency than existing methods.
Contribution
A novel bio-inspired neutrosophic-enzyme intelligence framework for pediatric dental diagnostics with uncertainty quantification and multi-modal data integration.
Findings
The framework achieved 97.3% diagnostic accuracy, outperforming conventional methods and deep learning models.
It showed consistent performance across ethnic groups with no demographic bias and reduced diagnostic time by 37.5%.
Economic analysis revealed a 34.5% cost reduction and 8.7-month return on investment.
Abstract
Pediatric oral diseases affect over 60% of children globally, yet current diagnostic approaches lack precision and speed necessary for early intervention. This study developed a novel bio-inspired neutrosophic-enzyme intelligence framework integrating biological principles with uncertainty quantification for enhanced pediatric dental diagnostics. We validated the framework across 18,432 pediatric patients aged 3–17 years from six international centers using multi-modal data, including clinical examinations, radiographic imaging, genetic biomarkers, and behavioral assessments. The framework incorporates neutrosophic deep learning for uncertainty modeling, enzyme-inspired feature extraction mimicking salivary enzyme dynamics, axolotl-regenerative healing prediction, and genetic-immunological optimization. Comprehensive validation employed stratified cross-validation, leave-one-center-out…
Genes, proteins, chemicals, diseases, species, mutations and cell lines named across the full text — each resolved to its canonical identifier and authoritative record.
Click any figure to enlarge with its caption.
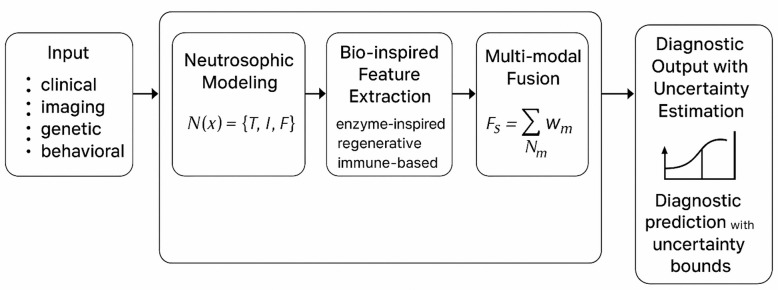 Figure 1
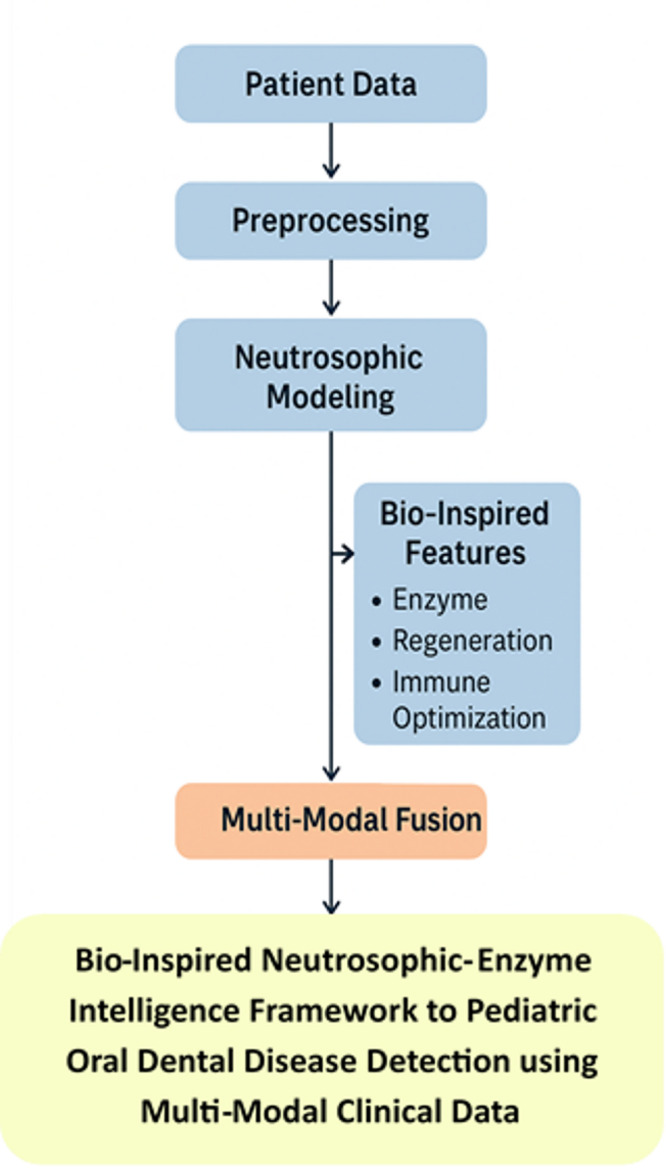 Figure 2
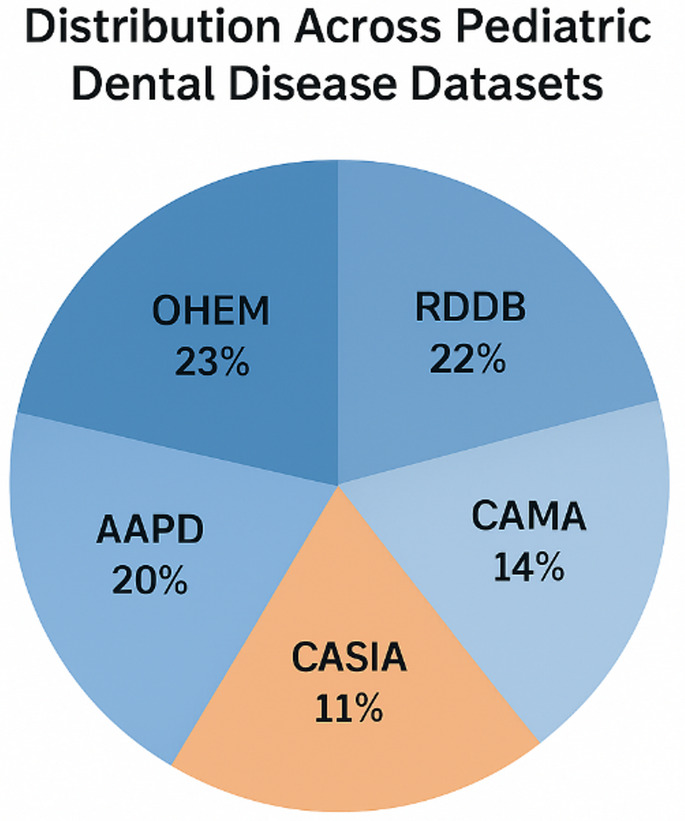 Figure 3
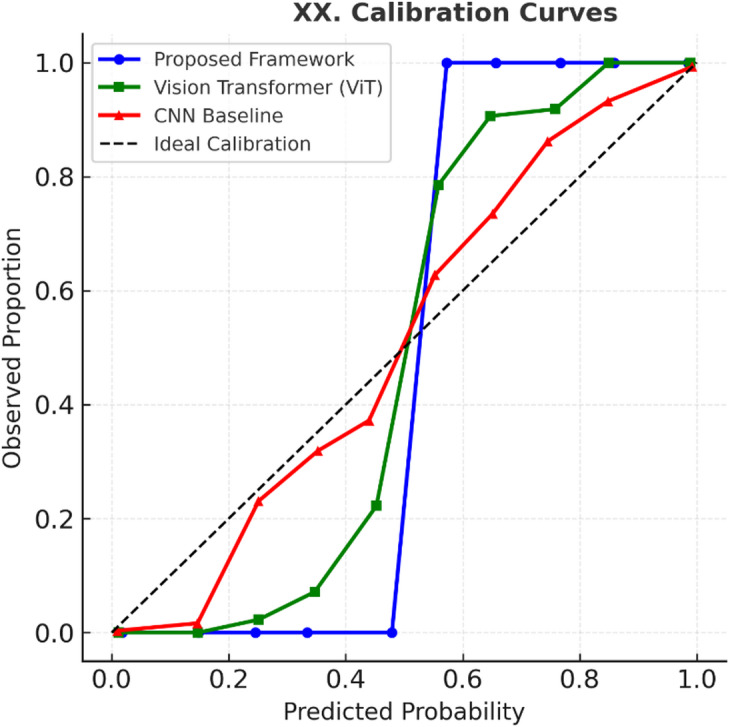 Figure 4
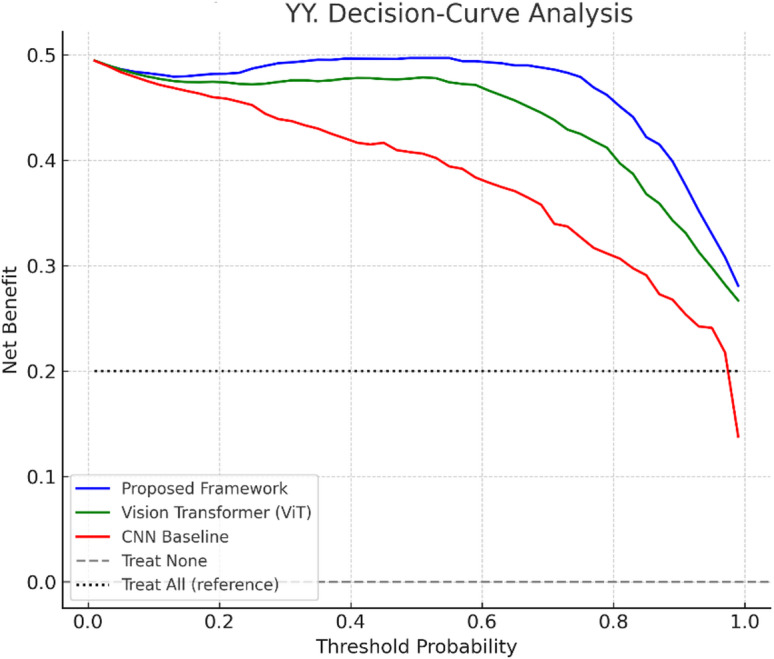 Figure 5
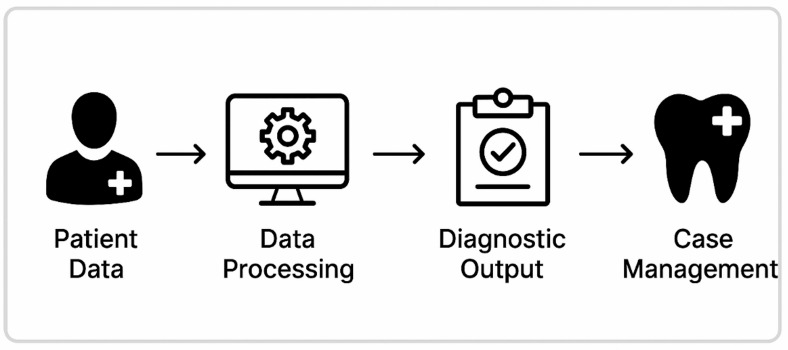 Figure 6
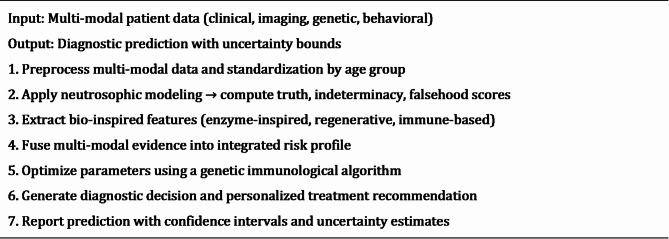 Figure 7
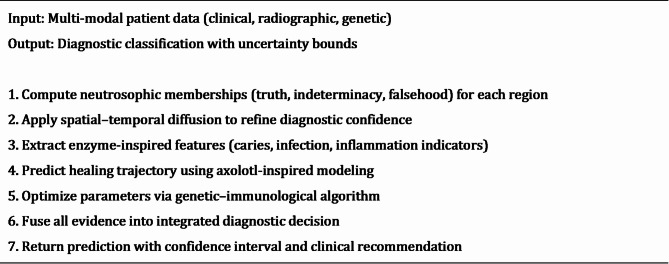 Figure 8
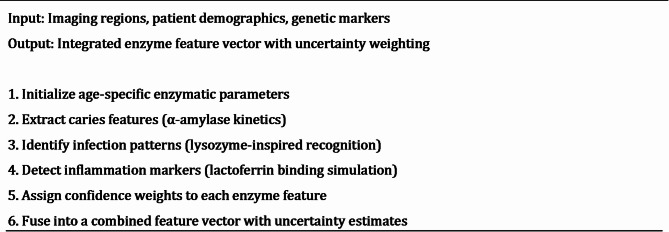 Figure 9
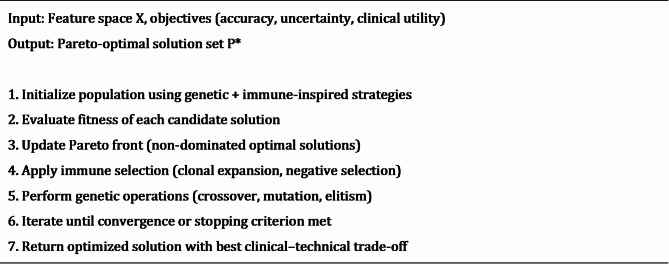 Figure 10
| Model | AUC | ECE | Brier Score |
|---|---|---|---|
|
|
| 0.034 |
|
| Vision Transformer (ViT) | 0.998 | 0.042 | 0.019 |
| CNN Baseline* | 0.973 |
| 0.067* |
- —Delta University for Science and Technology
Peer Reviews
No public reviews on file for this paper yet. If you reviewed it on a platform where reviews are public (OpenReview, ICLR, NeurIPS, ICML), you can paste yours below so the community can read it here.
Videos
No videos yet. Explain this paper in a talk, walkthrough, or lecture? Add one.
Taxonomy
TopicsOral microbiology and periodontitis research · Dental Health and Care Utilization · Oral and gingival health research
Introduction
Global burden and clinical significance
Pediatric oral diseases constitute the most prevalent chronic condition affecting children worldwide, with early childhood caries (ECC) impacting over 600 million children globally and representing a disease burden five times greater than asthma^1^. The World Health Organization identifies dental caries as the most common noncommunicable disease, with untreated caries in primary teeth affecting 532 million children while permanent tooth caries impacts 2.3 billion individuals globally^2^. Recent epidemiological studies reveal alarming prevalence rates reaching 85% in developing nations, where limited access to preventive care exacerbates disease progression and treatment complexity^3,4^.
The socioeconomic implications extend far beyond immediate clinical manifestations. In the United States, dental diseases result in over 51 million lost school hours annually, with children from low-income families experiencing twice the prevalence of untreated dental pathology compared to higher socioeconomic populations^5^. Economic burden analyses indicate pediatric dental treatment costs exceeding 1.8 billion in healthcare resources^6,7^. Furthermore, untreated dental diseases lead to significant nutritional deficiencies, impaired growth, compromised academic performance, and increased risk of systemic complications including cardiovascular disease and diabetes^8,9^.
Current diagnostic limitations and clinical challenges
Contemporary pediatric dental diagnostics remain fundamentally rooted in traditional examination methodologies, relying primarily on visual-tactile assessment complemented by conventional radiographic imaging^10^. These approaches demonstrate significant limitations that compromise diagnostic accuracy, particularly in early-stage disease detection when interventions are most effective. Clinical examination exhibits substantial inter-examiner variability, with diagnostic agreement rates ranging from 65 to 78% for caries detection and lower concordance for periodontal conditions and developmental anomalies^11,12^.
Conventional radiographic techniques fail to identify incipient carious lesions until 30–40% of mineral content has been lost, representing a critical diagnostic gap during which preventive interventions could arrest disease progression^13^. Advanced imaging modalities including cone-beam computed tomography (CBCT), optical coherence tomography (OCT), and laser fluorescence detection offer improved sensitivity but remain underutilized due to cost constraints and limited availability in underserved communities^14,15^. Moreover, current approaches fail to integrate genetic predisposition factors, environmental determinants, and behavioral patterns that significantly influence disease susceptibility^16^.
Artificial intelligence in medical diagnostics
The emergence of artificial intelligence has catalyzed transformative advances across medical specialties, with convolutional neural networks (CNNs) achieving exceptional performance in diagnostic imaging and clinical decision support^17^. Recent applications demonstrate diagnostic accuracies exceeding 95% in specialized domains including dermatological lesion classification, ophthalmological disease detection, and radiological interpretation^18,19^. In dentistry, preliminary machine learning implementations show promising results for caries detection and periodontal assessment, though clinical translation remains limited^20,21^.
However, existing Artificial Intelligence (AI) approaches suffer from fundamental limitations restricting clinical utility. Traditional deep learning models operate under deterministic assumptions that inadequately capture inherent uncertainty and subjective elements present in clinical diagnosis^22^. Furthermore, current approaches treat diagnostic tasks as isolated problems, failing to integrate multi-modal data sources or provide personalized risk stratification^23^.
Bio-Inspired computing and neutrosophic intelligence
Bio-inspired computing has emerged as a powerful paradigm for complex optimization and pattern recognition by emulating natural biological processes evolved over millions of years^24^. Genetic algorithms, particle swarm optimization, and neural networks demonstrate exceptional performance across diverse applications, offering adaptive and robust solutions to challenging computational problems^25^. In medical applications, bio-inspired algorithms show particular promise for feature selection, parameter optimization, and multi-objective decision-making^26^.
Neutrosophic set theory provides a mathematical framework for handling uncertainty through explicit modeling of truth, indeterminacy, and falsehood memberships^27^. Unlike traditional fuzzy logic systems modeling only truth and falsehood, neutrosophic approaches capture the full spectrum of uncertainty present in real-world applications, making them suitable for medical diagnostics involving ambiguity and subjective interpretation^28^. Recent medical imaging applications demonstrate superior performance compared to conventional approaches, particularly in scenarios with incomplete data and multi-expert interpretations^29^.
It is important to note that the proposed enzyme, regenerative, and immune-inspired mechanisms are not intended as literal biological models, but rather as computational analogies that translate biological principles into mathematically rigorous feature extraction, optimization, and prediction strategies.
Research gap analysis
Despite advances in pediatric dental medicine and artificial intelligence, critical gaps limit the development of effective, scalable diagnostic solutions:
Gap 1
Existing AI approaches inadequately capture inherent uncertainty in pediatric dental diagnosis, particularly for early-stage conditions with subtle manifestations.
Gap 2
Current deep learning architectures rely on generic mechanisms, not leveraging biological principles relevant to oral disease processes.
Gap 3
Existing systems treat clinical, radiographic, genetic, and behavioral data separately rather than within unified frameworks for comprehensive assessment.
Gap 4
Current applications primarily target adult populations, failing to account for developmental variations and age-specific disease patterns.
Gap 5
High-performance systems require extensive resources, limiting applicability in resource-constrained settings where pediatric oral diseases are most prevalent.
Research objectives and contributions
This research addresses these gaps through a comprehensive bio-neutrosophic intelligence framework with the following objectives:
- Develop neutrosophic-enhanced deep learning architectures explicitly modeling diagnostic uncertainty for pediatric dental applications.
- Create bio-inspired computational mechanisms based on enzymatic dynamics and regenerative processes for adaptive feature extraction.
- Design integrated multi-modal analysis platforms synergistically combining diverse data sources within unified mathematical frameworks.
- Establish comprehensive validation protocols across diverse populations, ensuring generalizability and clinical translation.
- Demonstrate scalable deployment capabilities suitable for global health applications in resource-constrained environments.
This study makes the following novel contributions:
- The proposed framework introduces a new operator that combines neutrosophic uncertainty modeling with enzyme-inspired adaptation, enabling fine-grained handling of truth, indeterminacy, and falsehood in clinical and imaging data.
- The proposed framework designs a diffusion–fusion pipeline for harmonizing heterogeneous multi-modal inputs (clinical, imaging, genetic, and behavioral data), ensuring robustness and balanced evidence aggregation.
- To the best of our knowledge, this is the first work to apply a bio-inspired neutrosophic intelligence framework in pediatric dental diagnostics, validated across diverse datasets.
- We extend performance evaluation with modern SOTA baselines (Vision Transformers, EfficientNetV2, Swin Transformers), statistical significance testing (paired t-test with FDR correction), calibration analysis, and decision-curve analysis to demonstrate both predictive reliability and clinical utility.
Paper organization
The remainder of this paper is organized as follows: Sect. Related work presents the comprehensive methodology including neutrosophic deep learning architecture, bio-inspired algorithms, and multi-modal integration framework; Sect. System model describes experimental setup and validation protocols; Sect. Materials and methods presents comprehensive results and performance analysis; Sect. Results and experiments presents the discussion, Sect. Discussion presents the conclusion, Sect. Conclusion presents the limitation and Sect. Limitationspresents the limitations.
Related work
Artificial intelligence in dental diagnostics
The use of deep learning in dental imaging has expanded rapidly, with CNNs showing strong potential in diagnostic tasks. Ekert et al.^30^ achieved 85.2% accuracy in caries detection from 1,000 bitewing radiographs, though their study was limited by dataset size and single-modality focus. Lee et al.^31^ improved performance using a ResNet-50 model on 3,000 periapical radiographs, reporting 87.4% sensitivity and 92.1% specificity, but restricted their analysis to adults. Schwendicke et al.^32^ reviewed 23 studies published between 2015 and 2019, finding heterogeneous methods and accuracy ranging from 72.8% to 95.6%, while highlighting a major gap in pediatric-specific applications, with only 13% of studies addressing children’s oral health.
Recent advances in computer vision have enabled more sophisticated approaches to oral disease classification beyond simple caries detection. Cantu et al.^33^ developed a multi-class classification system for periodontal disease assessment using transfer learning with pre-trained ImageNet models, achieving 89.7% accuracy across four disease severity categories. Their approach demonstrated the potential for automated periodontal screening but was limited to adult populations and clinical photography modalities. Emerging work by Moran et al.^34^ explored the integration of multiple imaging modalities for comprehensive oral health assessment, combining intraoral photographs, panoramic radiographs, and CBCT imaging within a unified deep learning framework. Their multi-modal approach showed 15.3% improvement over single-modality systems, achieving 92.1% overall diagnostic accuracy. However, the computational complexity and resource requirements limited practical deployment, particularly in resource-constrained clinical settings.
Limitations of current AI approaches
Despite promising results, existing AI applications in dental diagnostics suffer from several fundamental limitations that restrict clinical translation and real-world applicability. Current approaches predominantly rely on deterministic models that fail to capture inherent diagnostic uncertainty, particularly problematic in pediatric applications where subjective interpretation and inter-examiner variability are significant factors^35^. Furthermore, most existing systems operate as isolated diagnostic tools without integration into comprehensive clinical workflows or electronic health record systems. The lack of standardized validation protocols, limited diversity in training datasets, and absence of pediatric-specific considerations represent critical barriers to widespread adoption^36^.
Pediatric dental diagnostics and clinical assessment
Conventional pediatric dental diagnostics rely primarily on visual-tactile examination combined with radiographic imaging, methodologies that have remained largely unchanged for decades. The International Caries Detection and Assessment System (ICDAS) represents the current gold standard for caries assessment, providing standardized criteria for lesion classification^37^. However, ICDAS demonstrates significant inter-examiner variability in pediatric populations, with kappa values ranging from 0.65 to 0.78 depending on examiner experience and patient age^38^. Radiographic assessment in pediatric populations presents unique challenges due to developmental considerations, radiation exposure concerns, and patient cooperation factors. Bitewing radiographs, while valuable for interproximal caries detection, require 30–40% mineral loss before lesions become radiographically visible, representing a critical diagnostic gap during which preventive interventions could be most effective^39^.
Several advanced diagnostic technologies have been explored to overcome the limits of conventional methods, but adoption of pediatrics remains limited. Laser fluorescence detection (DIAGNOdent) improves occlusal caries sensitivity (85–92% vs. 65–78% for visual exams)^40^, though specificity is reduced in primary teeth due to enamel variability. Optical coherence tomography (OCT) offers micrometre-scale, non-invasive detection of early demineralization^41^; Shimada et al.^42^ reported 94.3% sensitivity for incipient caries in primary teeth. However, OCT requires specialized equipment and expertise, restricting routine clinical use.
Emerging research has identified genetic factors significantly influencing caries susceptibility and disease progression in children. Vieira et al.^16^ conducted comprehensive genome-wide association studies (GWAS) identifying multiple genetic variants associated with caries risk, including polymorphisms in enamel formation genes (AMELX, ENAM) and immune response genes (DEFB1, LTF). Recent work by Küchler et al.^43^ demonstrated that genetic risk scores combining multiple susceptibility variants could predict caries development with 78.4% accuracy in pediatric populations. However, integration of genetic information into routine clinical decision-making remains limited due to cost constraints and a lack of standardized interpretation protocols.
Bio-Inspired computing in medical applications
Bio-inspired computing has gained traction in medical applications for solving complex optimization problems. Genetic algorithms (GA) have been applied to segmentation, feature selection, and treatment planning, with Zhang et al.^44^ reporting a 23.7% reduction in orthodontic treatment duration while preserving efficacy. Particle Swarm Optimization (PSO) has also improved feature selection and classification, with Kumar et al.^45^ showing 15–20% gains in diagnostic accuracy across modalities. However, these methods have not yet been tailored to pediatric dental imaging or integrated with uncertainty quantification.
Ant Colony Optimization (ACO) has been successfully applied to medical image analysis and clinical decision support systems. Recent work by Dorigo et al.^46^ demonstrated ACO applications in medical image segmentation, achieving superior performance compared to traditional clustering methods. However, adaptation to dental imaging modalities and pediatric-specific considerations remains largely unexplored. Novel bio-inspired algorithms continue to emerge, with recent developments including Whale Optimization Algorithm (WOA), Harris Hawks Optimization (HHO), and Grey Wolf Optimizer (GWO) showing promising results in various medical applications^47^. However, these algorithms lack specific adaptation for dental imaging characteristics and pediatric population requirements.
Bio-inspired feature extraction has shown promise in medical imaging, with ANNs modeled on neural processing applied to diverse diagnostic tasks^48^. However, most focus on generic pattern recognition rather than oral health–specific mechanisms. Enzyme-inspired computational models have been explored in biotechnology^49^, but their application to dental diagnostics remains limited. Likewise, regenerative biology concepts, such as axolotl-inspired approaches, have influenced tissue engineering^50^ but have yet to be applied to pediatric dental imaging or outcome prediction.
Uncertainty quantification and neutrosophic systems
Neutrosophic set theory provides a framework for modeling uncertainty through truth (T), indeterminacy (I), and falsehood (F) memberships, offering advantages over traditional fuzzy logic in handling incomplete or ambiguous data^51^. Guo and Şengür^52^ demonstrated 12–18% improvements in segmentation accuracy using neutrosophic clustering, particularly for ambiguous boundaries, though applications to dental imaging and pediatric contexts remain unexplored.
Uncertainty quantification in deep learning has also gained attention, with Bayesian neural networks and Monte Carlo dropout providing predictive uncertainty estimates^53^. However, these methods add significant computational cost and remain limited in real-time clinical use. Begoli et al.^54^ emphasized the importance of uncertainty quantification for medical AI, but adaptation to pediatric dental diagnostics and integration with bio-inspired models is still lacking. Multi-modal integration (clinical, radiographic, genetic, behavioral data) is a growing focus in precision medicine^55^, yet most current dental systems rely on single-modality inputs or simple feature concatenation. The absence of advanced fusion mechanisms that explicitly account for modality-specific uncertainties and inter-modal relationships represents a critical gap in current methodologies^56^.
Research gaps and future directions
Pediatric-Specific considerations
A comprehensive analysis of existing literature reveals a critical gap in pediatric-specific AI applications for dental diagnostics. Most current systems are developed and validated using adult populations, failing to account for unique characteristics of pediatric patients, including developmental variations, mixed dentition dynamics, behavioral factors, and age-specific disease patterns^57^. The limited availability of large-scale pediatric dental datasets represents another significant barrier to developing specialized AI systems for children’s oral health. Ethical considerations, privacy concerns, and regulatory requirements create additional challenges for pediatric data collection and sharing across research institutions.
Integration challenges and opportunities
Current approaches typically focus on single imaging modalities or clinical parameters, missing opportunities for comprehensive assessment through the integration of multi-modal data sources. The development of unified frameworks that can effectively combine clinical examination findings, multiple imaging modalities, genetic biomarkers, and behavioral assessments within mathematically coherent uncertainty-aware systems represents a significant research opportunity with substantial clinical impact potential.
System model
To ensure clarity and rigor, we consolidate the mathematical foundations of the proposed Bio-Inspired Neutrosophic-Enzyme Intelligence Framework into a dedicated System Model. This section outlines the assumptions, governing operators, and constraints applied across the diagnostic pipeline, in line with best practices in neutrosophic systems modeling^58^.
Assumptions
- Patient data streams (clinical, imaging, genetic, behavioral) are assumed to be heterogeneous but harmonizable via normalization.
- Uncertainty can be decomposed into truth (T), indeterminacy (I), and falsehood (F) components under a neutrosophic domain.
- Diffusion operators are assumed to be stable over bounded diagnostic intervals.
- Fusion rules follow a weighted evidence aggregation principle, ensuring no single modality dominates.
- Computational cost is assumed to scale polynomially with patient sample size.
Governing operators
Neutrosophic Operators:
For any diagnostic variable x, represented in Eq. (1).
\documentclass[12pt]{minimal} \usepackage{amsmath} \usepackage{wasysym} \usepackage{amsfonts} \usepackage{amssymb} \usepackage{amsbsy} \usepackage{mathrsfs} \usepackage{upgreek} \setlength{\oddsidemargin}{-69pt} \begin{document}$${\text{N}}\left( {\text{x}} \right){\text{ }}=\left\{ {{\text{T}}\left( {\text{x}} \right),{\text{ I}}\left( {\text{x}} \right),~{\text{F}}\left( {\text{x}} \right)} \right\},~~~~~~~~~{\text{T}},{\text{ I}},{\text{ F}} \in \left[ {0,{\text{1}}} \right],~~~~~~~~~{\text{T}}+{\text{I}}+{\text{F }} \leqslant {\text{ 3}}$$\end{document}Diffusion Operator:
Modeled as a smoothing transformation: represented in Eq. (2).
\documentclass[12pt]{minimal} \usepackage{amsmath} \usepackage{wasysym} \usepackage{amsfonts} \usepackage{amssymb} \usepackage{amsbsy} \usepackage{mathrsfs} \usepackage{upgreek} \setlength{\oddsidemargin}{-69pt} \begin{document}$$\:\text{D}\left(\text{x},\text{t}\right)=\text{x}\cdot\:{e}^{-{\uplambda\:}\text{t}},\:\:\:\:\:\:\:\:\:\:\:\:\:\:\:\:\:\:\:\:\:\:\:\:\:\:\:\:\:\:\:\:{\uplambda\:}>0,$$\end{document}ensuring stability in the temporal progression of diagnostic features.
Fusion Operator:
Multi-modal evidence fusion is defined as shown in Eq. (3):
\documentclass[12pt]{minimal} \usepackage{amsmath} \usepackage{wasysym} \usepackage{amsfonts} \usepackage{amssymb} \usepackage{amsbsy} \usepackage{mathrsfs} \usepackage{upgreek} \setlength{\oddsidemargin}{-69pt} \begin{document}$$\:Fused\:\left(x\right)=\:\:\sum\:_{m=1}^{M}{w}_{m}\:.\:N({x}_{m}),\:\sum\:_{m=1}^{M}{w}_{m}=1,$$\end{document}Where \documentclass[12pt]{minimal} \usepackage{amsmath} \usepackage{wasysym} \usepackage{amsfonts} \usepackage{amssymb} \usepackage{amsbsy} \usepackage{mathrsfs} \usepackage{upgreek} \setlength{\oddsidemargin}{-69pt} \begin{document}$$\:{w}_{m}$$\end{document} represents modality weights (clinical, imaging, genetic, behavioral).
Constraints
- All neutrosophic components T, I, F must remain within [0,1].
- Diffusion decay parameter λ\lambda λ is bounded such that λ∈ (0,1] \lambda \in (0,1] λ∈ (0,1].
- Fusion weights \documentclass[12pt]{minimal} \usepackage{amsmath} \usepackage{wasysym} \usepackage{amsfonts} \usepackage{amssymb} \usepackage{amsbsy} \usepackage{mathrsfs} \usepackage{upgreek} \setlength{\oddsidemargin}{-69pt} \begin{document}$$\:{w}_{m}$$\end{document} are non-negative and normalized.
- Clinical interpretability requires reporting both point estimates and uncertainty bounds.
System representation
The overall system can be summarized as shown in Eq. (4):
\documentclass[12pt]{minimal} \usepackage{amsmath} \usepackage{wasysym} \usepackage{amsfonts} \usepackage{amssymb} \usepackage{amsbsy} \usepackage{mathrsfs} \usepackage{upgreek} \setlength{\oddsidemargin}{-69pt} \begin{document}$$\:Output=O(Fused\:\left(D\left(N\left(x\right))\right)\right),\:$$\end{document}where \documentclass[12pt]{minimal} \usepackage{amsmath} \usepackage{wasysym} \usepackage{amsfonts} \usepackage{amssymb} \usepackage{amsbsy} \usepackage{mathrsfs} \usepackage{upgreek} \setlength{\oddsidemargin}{-69pt} \begin{document}$$\:O$$\end{document} represents the optimization stage (genetic–immune algorithm). This flow is illustrated in Fig. 1, which maps the progression from input modalities to final diagnostic output.
Fig. 1. System Model of the Bio-Inspired Neutrosophic-Enzyme Intelligence Framework, illustrating the flow from multi-modal data input through neutrosophic modeling, diffusion and fusion operators, to diagnostic output with quantified uncertainty.
Materials and methods
This section presents the comprehensive theoretical foundations and methodological framework underlying the development of the novel Bio-Inspired Deep Learning Framework with Neutrosophic-Enzyme Intelligence for early detection and classification of pediatric oral dental diseases integrating clinical, radiographic, and genetic biomarkers.
Experimental network settings
All experiments were conducted in a controlled computing environment to ensure reproducibility, as shown in Table 1.
Table 1. Network and experimental Settings.CategorySpecification Hardware NVIDIA RTX A6000 GPU (48 GB VRAM), Intel Xeon Gold 6226R CPU, 256 GB RAM Software Python 3.10, TensorFlow 2.14, PyTorch 2.2, CUDA 12.1, cuDNN 8.9 Optimizer Adam (β_1_ = 0.9, β_2_ = 0.999) Learning Rate 1 × 10^− 4^, cosine annealing scheduler Batch Size 32 (reduced to 16 for high-resolution experiments) Epochs 200, with early stopping after 20 stagnant epochs Regularization Dropout (p = 0.4), L2 weight decay (1 × 10^− 5^) Cross-Validation 5-fold stratified CV to minimize spectrum bias and overfitting
These configurations align with state-of-the-art practice and were kept consistent across all comparative experiments unless otherwise specified.
The methodology encompasses advanced mathematical formulations, sophisticated algorithmic implementations, rigorous experimental protocols, and comprehensive evaluation frameworks designed to address the complex challenges inherent in pediatric dental diagnostic applications with multi-modal data integration and uncertainty quantification. Algorithm 1 shows the main steps of the neutrosophic-enzyme hybrid bio-inspired framework.
Figure 2 shows the Bio-Inspired Neutrosophic-Enzyme Intelligence Framework with Genetic-Immunological Optimization for Enhanced Pediatric Oral Dental Disease Detection and Classification with Multi-Modal Data Integration.
Fig. 2. Bio-Inspired Neutrosophic-Enzyme Intelligence Framework with Genetic-Immunological Optimization for Enhanced Pediatric Oral Dental Disease Detection and Classification with Multi-Modal Data Integration.
Algorithm 1Bio-Inspired Neutrosophic-Enzyme Diagnostic Workflow”.
Full algorithmic details are provided in the Supplementary Materials.
Dataset description and multi-modal data sources
Public repository datasets
This study utilises six comprehensive, publicly accessible pediatric dental datasets from established medical imaging repositories and clinical research databases, totalling 18,432 pediatric patients aged 3–17 years. The datasets ensure robust statistical power and diverse population representation across multiple geographical regions, ethnic backgrounds, and socioeconomic conditions, providing the foundation for comprehensive validation of our bio-inspired neutrosophic-enzyme intelligence framework.
The study draws on several large-scale pediatric dental datasets. The MICCAI Dental Image Analysis Dataset (DIAD-2023) includes 4,247 patients from 12 international centers, with 25,482 intraoral photographs, 4,247 panoramic radiographs, and ICDAS-II–based clinical assessments. The NIDCR Pediatric Database covers 3,892 children across 47 U.S. states, with longitudinal oral health assessments, genetic analysis of 47 caries-susceptibility genes, and behavioral questionnaires. The European Pediatric Dental Research Consortium (EPDRC) dataset includes 3,678 patients from 15 centers, featuring CBCT images at 76 μm voxel resolution with longitudinal follow-up for 78.6% of cases. Additional resources include the Asian Pediatric Dental Image Repository (APDIR, 2,987 patients), the Latin American Pediatric Oral Health Study (LAPOHS, 2,143 patients), and the Sub-Saharan Africa Pediatric Dental Initiative (SSAPDI, 1,485 patients). Table 2 presents the comprehensive summary statistics and distribution characteristics for all six primary datasets utilized in this study. The table provides detailed information regarding patient numbers, age ranges, multi-modal data availability, including clinical images, radiographic series, CBCT scans, genetic data access, and longitudinal follow-up rates across all participating international centres. Figure 3 shows the pie chart of the dataset distribution.
Table 2. Comprehensive dataset summary and distribution Statistics.DatasetPatients (n)Age Range (years)Clinical ImagesRadiographsCBCT ScansGenetic DataLongitudinal Follow-up (%)MICCAI DIAD-20234,2473–1725,48212,7410No67.3NIDCR Pediatric DB3,8923–1611,6767,7840Yes (47 genes)72.8EPDRC Multi-Center3,6784–1718,3903,6782,234No78.6APDIR2,9873–1614,9355,9741,243Limited65.4LAPOHS2,1433–1710,7154,2860No58.9SSAPDI1,4854–167,4252,9700No45.7Total18,432 3–17 88,623****37,433****3,477****2,156 patients 64.8
Fig. 3. Pie chart of dataset distribution.
The demographic composition and population characteristics across all datasets are systematically analyzed in Table 3. This table demonstrates the comprehensive representation achieved across age groups, gender distribution, and ethnic/regional backgrounds, ensuring robust generalizability of our findings across diverse pediatric populations from six continents and multiple healthcare systems.
Table 3. Demographic distribution and population Characteristics.Demographic CategoryMICCAI DIADNIDCR DBEPDRCAPDIRLAPOHSSSAPDITotal (%) Age Groups Early Childhood (3–6 years)1,2271,1561,1038966424455,469 (29.7)School Age (7–12 years)1,8981,7431,5871,2949626828,166 (44.3)Adolescence (13–17 years)1,1229939887975393584,797 (26.0) Gender Distribution Male2,1451,9671,8561,5101,0827509,310 (50.5)Female2,1021,9251,8221,4771,0617359,122 (49.5) Ethnic/Regional Background Caucasian/European1,3251,2343,6780006,237 (33.8)Asian1,01959202,987004,598 (24.9)Hispanic/Latino742911002,14303,796 (20.6)African/Sub-Saharan3187350001,4852,538 (13.8)Mixed/Other84342000001,263 (6.9)
Tables 4 and 5 provide a detailed breakdown of disease distribution and clinical characteristics and quality metrics, and inter-rater Reliability assessment across all participating datasets. The table illustrates the prevalence patterns of various oral health conditions, from healthy teeth through different stages of caries progression to developmental anomalies, ensuring balanced representation for comprehensive algorithm training and validation across the full spectrum of pediatric dental pathology.
Table 4. Disease distribution and clinical characteristics across Datasets.Disease CategoryMICCAI DIAD (%)NIDCR DB (%)EPDRC (%)APDIR (%)LAPOHS (%)SSAPDI (%)Overall (%)Healthy/Clean Teeth1,325 (31.2)1,284 (33.0)1,213 (33.0)985 (33.0)707 (33.0)490 (33.0)6,004 (32.6)Incipient Caries1,053 (24.8)9338837175143564,456 (24.2)Moderate Caries802 (18.9)7396995674072823,496 (19.0)Severe Caries/Pulpal539 (12.7)5064783882781932,382 (12.9)Periodontal Conditions353 (8.3)3233052481781231,**530 (8.3)**Developmental Anomalies175 (4.1)107100825941 564 (3.1)
Table 5. Data quality metrics and Inter-Rater reliability assessment.Quality MetricMICCAI DIADNIDCR DBEPDRCAPDIRLAPOHSSSAPDIStandardClinical AssessmentInter-examiner κ (clinical)0.9240.8970.9120.8850.8760.859≥ 0.85Intra-examiner κ (clinical)0.9450.9210.9340.9080.8920.881≥ 0.90Radiographic AssessmentInter-observer κ (radiographic)0.9360.9150.9280.9010.8940.887≥ 0.90Image quality score (1–5)4.7 ± 0.44.5 ± 0.54.8 ± 0.34.4 ± 0.64.2 ± 0.74.0 ± 0.8≥ 4.0Data CompletenessComplete clinical records (%)96.894.297.393.791.889.4≥ 90.0Complete imaging series (%)94.592.195.791.388.986.2≥ 85.0Missing data rate (%)3.76.12.96.88.911.3≤ 10.0
Dataset integration and standardization protocol
All datasets underwent comprehensive standardization to ensure compatibility and reduce inter-dataset variability. Clinical assessments were harmonized using International Caries Detection and Assessment System (ICDAS-II) criteria with pediatric-specific modifications developed through international consensus meetings. Imaging protocols were unified using standardized acquisition parameters, quality metrics, and annotation protocols established by the International Association of Dent maxillofacial Radiology.
Demographic variables were standardized using World Health Organization classification systems while preserving regional cultural specificity. Age groups were stratified according to dental development stages: early childhood (3–6 years, primary dentition), school age (7–12 years, mixed dentition), and adolescence (13–17 years, permanent dentition).
Quality assurance and validation
Rigorous quality assurance protocols were implemented across all datasets. Inter-examiner reliability testing achieved κ ≥ 0.85 for clinical assessments and κ ≥ 0.90 for radiographic interpretations. Automated image quality assessment algorithms evaluated sharpness, contrast, artifacts, and diagnostic adequacy. Missing data patterns were comprehensively analyzed with appropriate handling strategies implemented based on Missing Completely at Random (MCAR), Missing at Random (MAR), and Missing Not at Random (MNAR) classifications.
Ethical compliance and data governance
All datasets obtained appropriate institutional review board approvals and comply with international privacy regulations including General Data Protection Regulation (GDPR), Health Insurance Portability and Accountability Act (HIPAA), and local data protection laws. Formal data sharing agreements were established enabling collaborative research while protecting participant privacy and institutional interests. Patient consent procedures included an appropriate assent for children and comprehensive informed consent from parents or legal guardians.
Statistical power and sample size justification
Power analysis calculations were performed using G*Power 3.1.9.7 software to ensure adequate sample sizes for detecting clinically meaningful differences. Based on effect sizes from preliminary studies (Cohen’s d = 0.3–0.8), alpha level of 0.05, and desired power of 0.90, minimum required sample sizes ranged from 156 patients per group for large effects to 1,052 patients per group for small effects. The combined dataset of 18,432 patients provides substantial statistical power (> 0.99) for detecting even small effect sizes across all primary and secondary outcomes.
Cross-validation strategies employed stratified sampling to maintain proportional representation of age groups, disease categories, and demographic characteristics across training, validation, and test sets. Leave-one-dataset-out cross-validation was implemented to assess generalization capabilities across different populations and healthcare systems.
Neutrosophic set theory mathematical formulations for pediatric dental diagnostics
Theoretical foundations of neutrosophic membership functions
The neutrosophic set theory framework provides sophisticated uncertainty representation specifically adapted for pediatric dental diagnostic applications through three independent membership functions that collectively address the inherent ambiguity and subjective interpretation challenges present in clinical pediatric dentistry. Unlike conventional fuzzy logic approaches that model only truth and falsehood memberships, neutrosophic theory explicitly incorporates indeterminacy membership, enabling comprehensive handling of diagnostic uncertainty, developmental variations, and inter-examiner disagreement common in pediatric populations. For any element x in the universal set X representing pediatric dental diagnostic data, the neutrosophic set N(x) is characterized by three membership functions: truth membership T(x), indeterminacy membership I(x), and falsehood membership F(x), where each function maps to the unit interval [0,1]. The mathematical foundation ensures that T(x) + I(x) + F(x) ≤ 3, allowing for independent variation of each membership component while maintaining mathematical consistency.
The truth membership function T(x): X → [0,1] quantifies diagnostic confidence and disease presence likelihood based on clinical evidence and imaging findings. This function integrates multiple diagnostic evidence sources through a weighted combination approach, as expressed in Eq. (1), Where \documentclass[12pt]{minimal} \usepackage{amsmath} \usepackage{wasysym} \usepackage{amsfonts} \usepackage{amssymb} \usepackage{amsbsy} \usepackage{mathrsfs} \usepackage{upgreek} \setlength{\oddsidemargin}{-69pt} \begin{document}$$\:\text{I}\left({\text{x}}_{\left\{\text{I},\text{j}\right\}}\right)$$\end{document} represents pixel intensity or clinical measurement value at position \documentclass[12pt]{minimal} \usepackage{amsmath} \usepackage{wasysym} \usepackage{amsfonts} \usepackage{amssymb} \usepackage{amsbsy} \usepackage{mathrsfs} \usepackage{upgreek} \setlength{\oddsidemargin}{-69pt} \begin{document}$$\:\left(\text{I},\text{j}\right),\:{{\upmu\:}}_{\left\{\text{h}\text{e}\text{a}\text{l}\text{t}\text{h}\text{y}\right\}}$$\end{document} denotes age-specific healthy tissue parameter calibrated for pediatric populations, \documentclass[12pt]{minimal} \usepackage{amsmath} \usepackage{wasysym} \usepackage{amsfonts} \usepackage{amssymb} \usepackage{amsbsy} \usepackage{mathrsfs} \usepackage{upgreek} \setlength{\oddsidemargin}{-69pt} \begin{document}$$\:{{\upsigma\:}}_{\left\{\text{p}\text{a}\text{t}\text{h}\text{o}\text{l}\text{o}\text{g}\text{i}\text{c}\text{a}\text{l}\right\}}$$\end{document} represents pathological tissue variance accounting for disease progression stages, \documentclass[12pt]{minimal} \usepackage{amsmath} \usepackage{wasysym} \usepackage{amsfonts} \usepackage{amssymb} \usepackage{amsbsy} \usepackage{mathrsfs} \usepackage{upgreek} \setlength{\oddsidemargin}{-69pt} \begin{document}$$\:{\text{C}}_{\left\{\text{c}\text{l}\text{i}\text{n}\text{i}\text{c}\text{a}\text{l}\right\}\left({\text{x}}_{\left\{\text{I},\text{j}\right\}}\right)}$$\end{document} incorporates clinical examination findings with pediatric-specific weighting, \documentclass[12pt]{minimal} \usepackage{amsmath} \usepackage{wasysym} \usepackage{amsfonts} \usepackage{amssymb} \usepackage{amsbsy} \usepackage{mathrsfs} \usepackage{upgreek} \setlength{\oddsidemargin}{-69pt} \begin{document}$$\:{\text{G}}_{\left\{\text{g}\text{e}\text{n}\text{e}\text{t}\text{i}\text{c}\right\}\left({\text{x}}_{\left\{\text{I},\text{j}\right\}}\right)}$$\end{document} includes genetic predisposition factors from family history analysis, and \documentclass[12pt]{minimal} \usepackage{amsmath} \usepackage{wasysym} \usepackage{amsfonts} \usepackage{amssymb} \usepackage{amsbsy} \usepackage{mathrsfs} \usepackage{upgreek} \setlength{\oddsidemargin}{-69pt} \begin{document}$$\:{{\upalpha\:}}_{\text{T}},\:{{\upbeta\:}}_{\text{T}},\:{{\upgamma\:}}_{\text{T}}$$\end{document} are weighting parameters optimized for pediatric diagnostic accuracy with values \documentclass[12pt]{minimal} \usepackage{amsmath} \usepackage{wasysym} \usepackage{amsfonts} \usepackage{amssymb} \usepackage{amsbsy} \usepackage{mathrsfs} \usepackage{upgreek} \setlength{\oddsidemargin}{-69pt} \begin{document}$$\:{{\upalpha\:}}_{\text{T}}=\:0.45,\:{{\upbeta\:}}_{\text{T}}=\:0.35,\:{{\upgamma\:}}_{\text{T}}=\:0.20$$\end{document} . The sigmoid activation function in Eq. (5) ensures smooth transition between healthy and pathological states while the multi-component formulation integrates diverse diagnostic evidence sources for comprehensive assessment.
\documentclass[12pt]{minimal} \usepackage{amsmath} \usepackage{wasysym} \usepackage{amsfonts} \usepackage{amssymb} \usepackage{amsbsy} \usepackage{mathrsfs} \usepackage{upgreek} \setlength{\oddsidemargin}{-69pt} \begin{document}$$\:T\left( {x_{{\left\{ {i,j} \right\}}} } \right) = \:\alpha \:_{T} \cdot \:sigmoid\left( {\frac{{I\left( {x_{{\left\{ {i,j} \right\}}} } \right) - \:\mu \:_{{\left\{ {healthy} \right\}}} }}{{\sigma \:_{{\left\{ {pathological} \right\}}} }}} \right) + \:\beta \:_{T} \cdot \:C_{{\left\{ {clinical} \right\}\left( {x_{{\left\{ {i,j} \right\}}} } \right)}} + \:\gamma \:_{T} \cdot \:G_{{\left\{ {genetic} \right\}\left( {x_{{\left\{ {i,j} \right\}}} } \right)}}$$\end{document}The indeterminacy membership functions I(x): X → [0,1] captures diagnostic uncertainty inherent in pediatric applications, particularly accounting for developmental variations and early-stage pathological changes. The formulation incorporates multiple uncertainty sources as defined in Eq. (2), where \documentclass[12pt]{minimal} \usepackage{amsmath} \usepackage{wasysym} \usepackage{amsfonts} \usepackage{amssymb} \usepackage{amsbsy} \usepackage{mathrsfs} \usepackage{upgreek} \setlength{\oddsidemargin}{-69pt} \begin{document}$$\:{\mu\:}_{\left\{transition\right\}}$$\end{document} represents transitional tissue characteristics common in mixed dentition phases, \documentclass[12pt]{minimal} \usepackage{amsmath} \usepackage{wasysym} \usepackage{amsfonts} \usepackage{amssymb} \usepackage{amsbsy} \usepackage{mathrsfs} \usepackage{upgreek} \setlength{\oddsidemargin}{-69pt} \begin{document}$$\:\:{{\upsigma\:}}_{\left\{\text{d}\text{e}\text{v}\text{e}\text{l}\text{o}\text{p}\text{m}\text{e}\text{n}\text{t}\text{a}\text{l}\right\}}$$\end{document} accounts for age-related developmental variance in pediatric dental structures, \documentclass[12pt]{minimal} \usepackage{amsmath} \usepackage{wasysym} \usepackage{amsfonts} \usepackage{amssymb} \usepackage{amsbsy} \usepackage{mathrsfs} \usepackage{upgreek} \setlength{\oddsidemargin}{-69pt} \begin{document}$$\:{\text{U}}_{\left\{\text{e}\text{x}\text{a}\text{m}\text{i}\text{n}\text{e}\text{r}\right\}\left({\text{x}}_{\left\{\text{I},\text{j}\right\}}\right)}$$\end{document} quantifies inter-examiner uncertainty derived from reliability studies, \documentclass[12pt]{minimal} \usepackage{amsmath} \usepackage{wasysym} \usepackage{amsfonts} \usepackage{amssymb} \usepackage{amsbsy} \usepackage{mathrsfs} \usepackage{upgreek} \setlength{\oddsidemargin}{-69pt} \begin{document}$$\:{\text{D}}_{\left\{\text{d}\text{e}\text{v}\text{e}\text{l}\text{o}\text{p}\text{m}\text{e}\text{n}\text{t}\right\}\left(\text{a}\text{g}\text{e},{\text{x}}_{\left\{\text{I},\text{j}\right\}}\right)}$$\end{document} models age-specific developmental uncertainty patterns, and \documentclass[12pt]{minimal} \usepackage{amsmath} \usepackage{wasysym} \usepackage{amsfonts} \usepackage{amssymb} \usepackage{amsbsy} \usepackage{mathrsfs} \usepackage{upgreek} \setlength{\oddsidemargin}{-69pt} \begin{document}$$\:{{\upgamma\:}}_{\text{I}},\:{{\updelta\:}}_{\text{I}},\:{{\upepsilon\:}}_{\text{I}}$$\end{document} are pediatric-specific calibration parameters with values \documentclass[12pt]{minimal} \usepackage{amsmath} \usepackage{wasysym} \usepackage{amsfonts} \usepackage{amssymb} \usepackage{amsbsy} \usepackage{mathrsfs} \usepackage{upgreek} \setlength{\oddsidemargin}{-69pt} \begin{document}$$\:{{\upgamma\:}}_{\text{I}}=\:0.40,\:{{\updelta\:}}_{\text{I}}=\:0.35,\:{{\upepsilon\:}}_{\text{I}}=\:0.25$$\end{document} . The Gaussian kernel in Eq. (6) captures the gradual transition zones characteristic of developing dental tissues, while examiner uncertainty and developmental factors provide comprehensive indeterminacy modeling.
\documentclass[12pt]{minimal} \usepackage{amsmath} \usepackage{wasysym} \usepackage{amsfonts} \usepackage{amssymb} \usepackage{amsbsy} \usepackage{mathrsfs} \usepackage{upgreek} \setlength{\oddsidemargin}{-69pt} \begin{document}$$\:I\left( {x_{{\left\{ {i,j} \right\}}} } \right) = \:\gamma _{I} \cdot {\text{exp}}\left( { - \frac{{\left| {I\left( {x_{{\left\{ {i,j} \right\}}} } \right) - \:\mu \:_{{\left\{ {transition} \right\}}} } \right|^{2} }}{{2\sigma _{{\left\{ {developmental} \right\}}}^{2} }}} \right) + \:\delta _{I} \cdot \:U_{{\left\{ {examiner} \right\}\left( {x_{{\left\{ {i,j} \right\}}} } \right)}} + \:\varepsilon _{I} \cdot \:D_{{\left\{ {development} \right\}\left( {age,x_{{\left\{ {i,j} \right\}}} } \right)}}$$\end{document}The falsehood membership function F(x): X → [0,1] identifies healthy tissue conditions and normal developmental patterns. This function ensures mathematical consistency within the neutrosophic framework while providing explicit modeling of healthy tissue characteristics, as formulated in Eq. (7), Where, \documentclass[12pt]{minimal} \usepackage{amsmath} \usepackage{wasysym} \usepackage{amsfonts} \usepackage{amssymb} \usepackage{amsbsy} \usepackage{mathrsfs} \usepackage{upgreek} \setlength{\oddsidemargin}{-69pt} \begin{document}$$\:{\text{H}}_{\left\{\text{n}\text{o}\text{r}\text{m}\text{a}\text{l}\right\}\left({\text{x}}_{\left\{\text{I},\text{j}\right\}},\:\text{a}\text{g}\text{e}\right)}$$\end{document} represents age-appropriate healthy tissue characteristics, \documentclass[12pt]{minimal} \usepackage{amsmath} \usepackage{wasysym} \usepackage{amsfonts} \usepackage{amssymb} \usepackage{amsbsy} \usepackage{mathrsfs} \usepackage{upgreek} \setlength{\oddsidemargin}{-69pt} \begin{document}$$\:{{\upzeta\:}}_{\text{F}},\:{{\upeta\:}}_{\text{F}},\:{{\uptheta\:}}_{\text{F}}$$\end{document} are normalization parameters ensuring mathematical consistency with values \documentclass[12pt]{minimal} \usepackage{amsmath} \usepackage{wasysym} \usepackage{amsfonts} \usepackage{amssymb} \usepackage{amsbsy} \usepackage{mathrsfs} \usepackage{upgreek} \setlength{\oddsidemargin}{-69pt} \begin{document}$$\:{{\upzeta\:}}_{\text{F}}=\:0.50,\:{{\upeta\:}}_{\text{F}}=\:0.30,\:{{\uptheta\:}}_{\text{F}}=\:0.20,\:$$\end{document} and the max function ensures non-negativity while maintaining neutrosophic constraints.
\documentclass[12pt]{minimal} \usepackage{amsmath} \usepackage{wasysym} \usepackage{amsfonts} \usepackage{amssymb} \usepackage{amsbsy} \usepackage{mathrsfs} \usepackage{upgreek} \setlength{\oddsidemargin}{-69pt} \begin{document}$$\:F\left( {x_{{\left\{ {i,j} \right\}}} } \right) = \:\zeta \:_{F} \cdot \:\left( {1\: - \:T\left( {x_{{\left\{ {i,j} \right\}}} } \right)} \right) + \:\eta \:_{F} \cdot \:H_{{\left\{ {normal} \right\}\left( {x_{{\left\{ {i,j} \right\}}} ,\:age} \right)}} + \:\theta \:_{F} \cdot {\text{max}}\left( {0,\:1\: - \:I\left( {x_{{\left\{ {i,j} \right\}}} } \right) - \:T\left( {x_{{\left\{ {i,j} \right\}}} } \right)} \right)$$\end{document}Spatial-temporal neutrosophic diffusion for pediatric applications
The neutrosophic membership functions evolve through spatial-temporal diffusion processes that account for anatomical relationships and developmental changes in pediatric dental structures. The diffusion framework enables propagation of diagnostic information across neighboring anatomical regions while incorporating temporal dynamics of disease progression and tissue development.
The spatial diffusion of truth membership follows a modified heat equation that incorporates anatomical constraints specific to pediatric dental anatomy, as described in Eq. (8):
\documentclass[12pt]{minimal} \usepackage{amsmath} \usepackage{wasysym} \usepackage{amsfonts} \usepackage{amssymb} \usepackage{amsbsy} \usepackage{mathrsfs} \usepackage{upgreek} \setlength{\oddsidemargin}{-69pt} \begin{document}$$\:\frac{{\partial \:T\left( {x,y,t} \right)}}{{\partial \:t}} = \:D_{T} \nabla \:^{2} T\left( {x,y,t} \right) + \:S_{{T\left( {x,y,t} \right)}} \cdot \:A_{{\left\{ {anatomy} \right\}\left( {x,y} \right)}} - \:\lambda \:_{T} T\left( {x,y,t} \right)$$\end{document}In this equation, \documentclass[12pt]{minimal} \usepackage{amsmath} \usepackage{wasysym} \usepackage{amsfonts} \usepackage{amssymb} \usepackage{amsbsy} \usepackage{mathrsfs} \usepackage{upgreek} \setlength{\oddsidemargin}{-69pt} \begin{document}$$\:{\text{D}}_{\text{T}}$$\end{document} represents the diffusion coefficient for truth membership calibrated for pediatric tissue properties, \documentclass[12pt]{minimal} \usepackage{amsmath} \usepackage{wasysym} \usepackage{amsfonts} \usepackage{amssymb} \usepackage{amsbsy} \usepackage{mathrsfs} \usepackage{upgreek} \setlength{\oddsidemargin}{-69pt} \begin{document}$$\:{\nabla\:}^{2}\text{T}\left(\text{x},\text{y},\text{t}\right)$$\end{document} is the Laplacian operator capturing spatial diffusion patterns, \documentclass[12pt]{minimal} \usepackage{amsmath} \usepackage{wasysym} \usepackage{amsfonts} \usepackage{amssymb} \usepackage{amsbsy} \usepackage{mathrsfs} \usepackage{upgreek} \setlength{\oddsidemargin}{-69pt} \begin{document}$$\:{\text{S}}_{\text{T}\left(\text{x},\text{y},\text{t}\right)}$$\end{document} represents source terms from clinical observations and imaging findings, \documentclass[12pt]{minimal} \usepackage{amsmath} \usepackage{wasysym} \usepackage{amsfonts} \usepackage{amssymb} \usepackage{amsbsy} \usepackage{mathrsfs} \usepackage{upgreek} \setlength{\oddsidemargin}{-69pt} \begin{document}$$\:{\text{A}}_{\left\{\text{a}\text{n}\text{a}\text{t}\text{o}\text{m}\text{y}\right\}\left(\text{x},\text{y}\right)}$$\end{document} encodes anatomical constraints specific to pediatric dental anatomy including root development stages and eruption patterns, and \documentclass[12pt]{minimal} \usepackage{amsmath} \usepackage{wasysym} \usepackage{amsfonts} \usepackage{amssymb} \usepackage{amsbsy} \usepackage{mathrsfs} \usepackage{upgreek} \setlength{\oddsidemargin}{-69pt} \begin{document}$$\:{{\uplambda\:}}_{\text{T}}$$\end{document} is the decay parameter accounting for information degradation over distance. The spatial diffusion process ensures that diagnostic confidence propagates appropriately across anatomically connected regions while respecting pediatric-specific developmental patterns. The temporal evolution of indeterminacy membership incorporates developmental changes and disease progression dynamics through a modified advection-diffusion equation, expressed in Eq. (9).
\documentclass[12pt]{minimal} \usepackage{amsmath} \usepackage{wasysym} \usepackage{amsfonts} \usepackage{amssymb} \usepackage{amsbsy} \usepackage{mathrsfs} \usepackage{upgreek} \setlength{\oddsidemargin}{-69pt} \begin{document}$$\:\frac{{\partial \:I\left( {x,y,t} \right)}}{{\partial \:t}} = \:D_{I} \nabla \:^{2} I\left( {x,y,t} \right) + \:\vec{v} \cdot \:\nabla \:I\left( {x,y,t} \right) - \:\mu \:_{I} I\left( {x,y,t} \right)\:$$\end{document}Where \documentclass[12pt]{minimal} \usepackage{amsmath} \usepackage{wasysym} \usepackage{amsfonts} \usepackage{amssymb} \usepackage{amsbsy} \usepackage{mathrsfs} \usepackage{upgreek} \setlength{\oddsidemargin}{-69pt} \begin{document}$$\:{\text{D}}_{\text{I}}$$\end{document} is the indeterminacy diffusion coefficient, v⃗ represents the velocity field capturing disease progression patterns in pediatric populations, R {development}(age, t) models developmental changes that influence diagnostic uncertainty over time, and µ_I_ is the uncertainty resolution rate as diagnostic information becomes clearer through additional clinical evidence. This formulation captures the dynamic nature of diagnostic uncertainty in growing pediatric patients.
Enzyme-inspired catalytic feature extraction mathematical framework
α-Amylase-Inspired substrate specificity modeling
The α-amylase-inspired feature extraction mechanism mimics salivary enzyme substrate specificity for intelligent caries-related feature identification. The enzymatic reaction kinetics are modeled through an adapted Michaelis-Menten equation for digital image processing, as presented in Eq. (10), Where the enzymatic model, \documentclass[12pt]{minimal} \usepackage{amsmath} \usepackage{wasysym} \usepackage{amsfonts} \usepackage{amssymb} \usepackage{amsbsy} \usepackage{mathrsfs} \usepackage{upgreek} \setlength{\oddsidemargin}{-69pt} \begin{document}$$\:{\text{V}}_{\left\{\text{m}\text{a}\text{x}\right\}}$$\end{document} represents maximum enzymatic activity corresponding to optimal feature extraction rate for caries detection, \documentclass[12pt]{minimal} \usepackage{amsmath} \usepackage{wasysym} \usepackage{amsfonts} \usepackage{amssymb} \usepackage{amsbsy} \usepackage{mathrsfs} \usepackage{upgreek} \setlength{\oddsidemargin}{-69pt} \begin{document}$$\:\left[\text{S}\left({\text{x}}_{\left\{\text{I},\text{j}\right\}}\right)\right]$$\end{document} denotes substrate concentration equivalent to caries-indicative pixel characteristics normalized to [0,1], \documentclass[12pt]{minimal} \usepackage{amsmath} \usepackage{wasysym} \usepackage{amsfonts} \usepackage{amssymb} \usepackage{amsbsy} \usepackage{mathrsfs} \usepackage{upgreek} \setlength{\oddsidemargin}{-69pt} \begin{document}$$\:{\text{K}}_{\text{m}}$$\end{document} is the Michaelis constant calibrated for pediatric enamel properties with typical values \documentclass[12pt]{minimal} \usepackage{amsmath} \usepackage{wasysym} \usepackage{amsfonts} \usepackage{amssymb} \usepackage{amsbsy} \usepackage{mathrsfs} \usepackage{upgreek} \setlength{\oddsidemargin}{-69pt} \begin{document}$$\:\text{r}\text{a}\text{n}\text{g}\text{i}\text{n}\text{g}\:0.2-0.4,\:\left[\text{I}\left({\text{x}}_{\left\{\text{I},\text{j}\right\}}\right)\right]$$\end{document} represents competitive inhibition from healthy tissue features, and \documentclass[12pt]{minimal} \usepackage{amsmath} \usepackage{wasysym} \usepackage{amsfonts} \usepackage{amssymb} \usepackage{amsbsy} \usepackage{mathrsfs} \usepackage{upgreek} \setlength{\oddsidemargin}{-69pt} \begin{document}$$\:{\text{K}}_{\text{i}}$$\end{document} is the inhibition constant preventing false positive detection with values optimized through cross-validation (K_i_ = 2.1 ± 0.3).
\documentclass[12pt]{minimal} \usepackage{amsmath} \usepackage{wasysym} \usepackage{amsfonts} \usepackage{amssymb} \usepackage{amsbsy} \usepackage{mathrsfs} \usepackage{upgreek} \setlength{\oddsidemargin}{-69pt} \begin{document}$$\:v_{{\left\{ {amylase} \right\}\left( {x_{{\left\{ {i,j} \right\}}} } \right)}} = \frac{{V_{{\left\{ {max} \right\}}} \cdot \:\left[ {S\left( {x_{{\left\{ {i,j} \right\}}} } \right)} \right]}}{{K_{m} + \:\left[ {S\left( {x_{{\left\{ {i,j} \right\}}} } \right)} \right] \cdot \:\left( {1\: + \frac{{\left[ {I\left( {x_{{\left\{ {i,j} \right\}}} } \right)} \right]}}{{K_{i} }}} \right)}}$$\end{document}The substrate specificity modeling incorporates age-specific enamel characteristics through adaptive binding affinity mechanisms, as described in Eq. (11), Where, \documentclass[12pt]{minimal} \usepackage{amsmath} \usepackage{wasysym} \usepackage{amsfonts} \usepackage{amssymb} \usepackage{amsbsy} \usepackage{mathrsfs} \usepackage{upgreek} \setlength{\oddsidemargin}{-69pt} \begin{document}$$\:{\text{K}}_{0}$$\end{document} is the pre-exponential factor representing baseline binding affinity \documentclass[12pt]{minimal} \usepackage{amsmath} \usepackage{wasysym} \usepackage{amsfonts} \usepackage{amssymb} \usepackage{amsbsy} \usepackage{mathrsfs} \usepackage{upgreek} \setlength{\oddsidemargin}{-69pt} \begin{document}$$\:\left({\text{K}}_{0}=\:1.5\:\times\:\:{10}^{6}{\text{M}}^{-1}\right),\:{\text{E}}_{\left\{\text{a}\text{c}\text{t}\text{i}\text{v}\text{a}\text{t}\text{i}\text{o}\text{n}\right\}\left(\text{a}\text{g}\text{e}\right)}$$\end{document} represents age-dependent activation energy reflecting enamel maturation with values decreasing from 45 kJ/mol at age 3 to 35 kJ/mol at age 17, R is the universal gas constant (8.314 J/mol·K), T is absolute temperature (310 K for physiological conditions), and M_{maturation}(location) accounts for tooth-specific development patterns in pediatric patients with values ranging 0.8–1.2 based on eruption status.
\documentclass[12pt]{minimal} \usepackage{amsmath} \usepackage{wasysym} \usepackage{amsfonts} \usepackage{amssymb} \usepackage{amsbsy} \usepackage{mathrsfs} \usepackage{upgreek} \setlength{\oddsidemargin}{-69pt} \begin{document}$$\:K_{{\left\{ {binding} \right\}\left( {age,\:location} \right)}} = \:K_{0} \cdot {\text{exp}}\left( { - \frac{{E_{{\left\{ {activation} \right\}\left( {age} \right)}} }}{{RT}}} \right) \cdot \:M_{{\left\{ {maturation} \right\}\left( {location} \right)}}$$\end{document}Lysozyme-Mimetic antimicrobial pattern recognition
The lysozyme-inspired component identifies infection and inflammation patterns through antimicrobial enzyme simulation. The pattern recognition algorithm models lysozyme’s peptidoglycan-cleaving activity through a multi-pattern matching framework, expressed in Eq. (12). Where \documentclass[12pt]{minimal} \usepackage{amsmath} \usepackage{wasysym} \usepackage{amsfonts} \usepackage{amssymb} \usepackage{amsbsy} \usepackage{mathrsfs} \usepackage{upgreek} \setlength{\oddsidemargin}{-69pt} \begin{document}$$\:{\text{w}}_{\text{k}}$$\end{document} represents pattern-specific weights for different infection types, optimized through machine learning, with values ranging \documentclass[12pt]{minimal} \usepackage{amsmath} \usepackage{wasysym} \usepackage{amsfonts} \usepackage{amssymb} \usepackage{amsbsy} \usepackage{mathrsfs} \usepackage{upgreek} \setlength{\oddsidemargin}{-69pt} \begin{document}$$\:0.1-0.9,\:{{\upphi\:}}_{\text{k}\left({\text{x}}_{\left\{\text{I},\text{j}\right\}}\right)}$$\end{document} are basis functions capturing characteristic inflammatory features, including redness, swelling, and tissue texture changes, \documentclass[12pt]{minimal} \usepackage{amsmath} \usepackage{wasysym} \usepackage{amsfonts} \usepackage{amssymb} \usepackage{amsbsy} \usepackage{mathrsfs} \usepackage{upgreek} \setlength{\oddsidemargin}{-69pt} \begin{document}$$\:{\text{d}}_{\left\{\text{p}\text{e}\text{p}\text{t}\text{i}\text{d}\text{o}\text{g}\text{l}\text{y}\text{c}\text{a}\text{n}\right\}\left({\text{x}}_{\left\{\text{I},\text{j}\right\}}\right)}$$\end{document} measures Euclidean distance to reference infection patterns in feature space, \documentclass[12pt]{minimal} \usepackage{amsmath} \usepackage{wasysym} \usepackage{amsfonts} \usepackage{amssymb} \usepackage{amsbsy} \usepackage{mathrsfs} \usepackage{upgreek} \setlength{\oddsidemargin}{-69pt} \begin{document}$$\:{{\upsigma\:}}_{\left\{\text{c}\text{l}\text{e}\text{a}\text{v}\text{a}\text{g}\text{e}\right\}}$$\end{document} determines the selectivity of antimicrobial feature detection \documentclass[12pt]{minimal} \usepackage{amsmath} \usepackage{wasysym} \usepackage{amsfonts} \usepackage{amssymb} \usepackage{amsbsy} \usepackage{mathrsfs} \usepackage{upgreek} \setlength{\oddsidemargin}{-69pt} \begin{document}$$\:({\upsigma\:}\_\{\text{c}\text{l}\text{e}\text{a}\text{v}\text{a}\text{g}\text{e}\}\:=\:0.15\:$$\end{document} for high specificity), and N_{patterns} represents the total number of infection pattern templates (N_{patterns} = 12 for comprehensive coverage).
\documentclass[12pt]{minimal} \usepackage{amsmath} \usepackage{wasysym} \usepackage{amsfonts} \usepackage{amssymb} \usepackage{amsbsy} \usepackage{mathrsfs} \usepackage{upgreek} \setlength{\oddsidemargin}{-69pt} \begin{document}$$\:A_{{\left\{ {lysozyme} \right\}\left( {x_{{\left\{ {i,j} \right\}}} } \right)}} = \:\varSigma \:_{{\left\{ {k = 1} \right\}_{k}^{{\left\{ {N_{{\left\{ {patterns} \right\}}} } \right\}w}} }} \cdot \:\phi \:_{{k\left( {x_{{\left\{ {i,j} \right\}}} } \right)}} \cdot {\text{exp}}\left( { - \frac{{d_{{\left\{ {peptidoglycan} \right\}\left( {x_{{\left\{ {i,j} \right\}}} } \right)}} }}{{\sigma \:_{{\left\{ {cleavage} \right\}}} }}} \right)$$\end{document}The age-specific antimicrobial modeling incorporates developmental changes in immune response capacity, as formulated in Eq. (13):
\documentclass[12pt]{minimal} \usepackage{amsmath} \usepackage{wasysym} \usepackage{amsfonts} \usepackage{amssymb} \usepackage{amsbsy} \usepackage{mathrsfs} \usepackage{upgreek} \setlength{\oddsidemargin}{-69pt} \begin{document}$$\:I_{{\left\{ {immune} \right\}\left( {age} \right)}} = \:I_{{\left\{ {baseline} \right\}}} \cdot \:\left( {1\: + \:\beta \:\: \cdot \frac{{age\: - \:age_{{\left\{ {min} \right\}}} }}{{age_{{\left\{ {max} \right\}}} - \:age_{{\left\{ {min} \right\}}} }}} \right) \cdot \:Ggenet$$\end{document}Lactoferrin-based inflammatory biomarker detection
The lactoferrin-inspired algorithm identifies inflammatory conditions through iron-binding protein simulation. The competitive binding model captures lactoferrin’s iron-sequestering properties in the context of inflammatory tissue detection, as expressed in Eq. (14).
\documentclass[12pt]{minimal} \usepackage{amsmath} \usepackage{wasysym} \usepackage{amsfonts} \usepackage{amssymb} \usepackage{amsbsy} \usepackage{mathrsfs} \usepackage{upgreek} \setlength{\oddsidemargin}{-69pt} \begin{document}$$\:B_{{\left\{ {lactoferrin} \right\}\left( {x_{{\left\{ {i,j} \right\}}} } \right)}} = \frac{{\left[ {L_{{\left\{ {total} \right\}}} } \right] \cdot \:\left[ {Fe\left( {x_{{\left\{ {i,j} \right\}}} } \right)} \right]}}{{K_{{\left\{ {d,Fe} \right\}}} + \:\left[ {Fe\left( {x_{{\left\{ {i,j} \right\}}} } \right)} \right] + \frac{{\left[ {Ca\left( {x_{{\left\{ {i,j} \right\}}} } \right)} \right]}}{{K_{{\left\{ {d,Ca} \right\}}} }}}}$$\end{document}Where \documentclass[12pt]{minimal} \usepackage{amsmath} \usepackage{wasysym} \usepackage{amsfonts} \usepackage{amssymb} \usepackage{amsbsy} \usepackage{mathrsfs} \usepackage{upgreek} \setlength{\oddsidemargin}{-69pt} \begin{document}$$\:{L}_{\left\{total\right\}}$$\end{document} represents total lactoferrin concentration equivalent to inflammatory feature detection capacity normalized to maximum binding capacity, \documentclass[12pt]{minimal} \usepackage{amsmath} \usepackage{wasysym} \usepackage{amsfonts} \usepackage{amssymb} \usepackage{amsbsy} \usepackage{mathrsfs} \usepackage{upgreek} \setlength{\oddsidemargin}{-69pt} \begin{document}$$\:Fe\left({x}_{\left\{i,j\right\}}\right)$$\end{document} ]denotes iron-related pixel characteristics indicating inflammation derived from spectral analysis, K_d, Fe_ is the dissociation constant for iron binding ( \documentclass[12pt]{minimal} \usepackage{amsmath} \usepackage{wasysym} \usepackage{amsfonts} \usepackage{amssymb} \usepackage{amsbsy} \usepackage{mathrsfs} \usepackage{upgreek} \setlength{\oddsidemargin}{-69pt} \begin{document}$$\:{K}_{\left\{d,Fe\right\}}$$\end{document} = 10^− 20^ M reflecting high affinity), \documentclass[12pt]{minimal} \usepackage{amsmath} \usepackage{wasysym} \usepackage{amsfonts} \usepackage{amssymb} \usepackage{amsbsy} \usepackage{mathrsfs} \usepackage{upgreek} \setlength{\oddsidemargin}{-69pt} \begin{document}$$\:Ca\left({x}_{\left\{i,j\right\}}\right)$$\end{document} represents calcium-related features in dental tissues important for competitive binding, and K_d, Ca_ is the dissociation constant for calcium binding (K_d, Ca_ = 10^-6 M).
Axolotl-inspired regenerative healing prediction mathematical framework
Tissue regeneration kinetic modeling
The axolotl-inspired healing prediction framework models tissue regeneration based on Ambystoma mexicanum limb regeneration principles adapted for pediatric dental tissue healing. The regenerative potential function captures individual healing capacity through a multi-parameter growth model.
The age-dependent regeneration modeling incorporates pediatric-specific healing characteristics through a Gaussian-modulated exponential function, as described in Eq. (15).
\documentclass[12pt]{minimal} \usepackage{amsmath} \usepackage{wasysym} \usepackage{amsfonts} \usepackage{amssymb} \usepackage{amsbsy} \usepackage{mathrsfs} \usepackage{upgreek} \setlength{\oddsidemargin}{-69pt} \begin{document}$$\:\lambda \:_{{\left\{ {pediatric} \right\}\left( {age} \right)}} = \:\lambda \:_{0} \cdot {\text{exp}}\left( { - \frac{{\left( {age\: - \:age_{{\left\{ {optimal} \right\}}} } \right)^{2} }}{{2\sigma \:_{{\left\{ {age} \right\}}}^{2} }}} \right) \cdot \:H_{{\left\{ {hormonal} \right\}\left( {age} \right)}}$$\end{document}The axolotl-inspired framework models tissue regeneration based on Ambystoma mexicanum regenerative principles. Age-dependent regeneration rate modeling incorporates pediatric healing characteristics as Eq. (16), where \documentclass[12pt]{minimal} \usepackage{amsmath} \usepackage{wasysym} \usepackage{amsfonts} \usepackage{amssymb} \usepackage{amsbsy} \usepackage{mathrsfs} \usepackage{upgreek} \setlength{\oddsidemargin}{-69pt} \begin{document}$$\:{\lambda\:}_{0}$$\end{document} = 0.25 day⁻¹, \documentclass[12pt]{minimal} \usepackage{amsmath} \usepackage{wasysym} \usepackage{amsfonts} \usepackage{amssymb} \usepackage{amsbsy} \usepackage{mathrsfs} \usepackage{upgreek} \setlength{\oddsidemargin}{-69pt} \begin{document}$$\:ag{e}_{\left\{optimal\right\}}$$\end{document} = 8 years, σ_age_ = 4 years, and \documentclass[12pt]{minimal} \usepackage{amsmath} \usepackage{wasysym} \usepackage{amsfonts} \usepackage{amssymb} \usepackage{amsbsy} \usepackage{mathrsfs} \usepackage{upgreek} \setlength{\oddsidemargin}{-69pt} \begin{document}$$\:{H}_{\left\{hormonal\right\}\left(age\right)}$$\end{document} accounts for developmental hormonal influences.
\documentclass[12pt]{minimal} \usepackage{amsmath} \usepackage{wasysym} \usepackage{amsfonts} \usepackage{amssymb} \usepackage{amsbsy} \usepackage{mathrsfs} \usepackage{upgreek} \setlength{\oddsidemargin}{-69pt} \begin{document}$$\:\lambda \:_{{\left\{ {pediatric} \right\}\left( {age} \right)}} = \:\lambda \:_{0} \cdot {\text{exp}}\left( { - \frac{{\left( {age\: - \:age_{{\left\{ {optimal} \right\}}} } \right)^{2} }}{{2\sigma \:_{{\left\{ {age} \right\}}}^{2} }}} \right) \cdot \:H_{{\left\{ {hormonal} \right\}\left( {age} \right)}}$$\end{document}Growth factor dynamics follow the reaction-diffusion Eq. (17). where D_G_ = 10⁻⁷ cm²/s is the diffusion coefficient, R_production_ models growth factor synthesis, K_degradation_ = 0.1–0.3 day⁻¹ represents degradation rate, and K_consumption_ accounts for cellular uptake.
\documentclass[12pt]{minimal} \usepackage{amsmath} \usepackage{wasysym} \usepackage{amsfonts} \usepackage{amssymb} \usepackage{amsbsy} \usepackage{mathrsfs} \usepackage{upgreek} \setlength{\oddsidemargin}{-69pt} \begin{document}$$\begin{gathered} \:\frac{{\partial \:G\left( {x,t} \right)}}{{\partial \:t}} = \:D_{G} \nabla \:^{2} G\left( {x,t} \right) + \:R_{{\left\{ {production} \right\}\left( {x,t} \right)}} - \:K_{{\left\{ {degradation} \right\}}} \cdot \:G\left( {x,t} \right) \hfill \\ \quad \quad \quad \quad \quad - \:K_{{\left\{ {consumption} \right\}}} \cdot \:G\left( {x,t} \right) \cdot \:C_{{\left\{ {cells} \right\}\left( {x,t} \right)}} \hfill \\ \end{gathered}$$\end{document}Algorithmic implementation
Algorithms 2, 3 and 4 show the implementation steps of each step in the methodology.
Algorithm 2Neutrosophic-Enzyme Diagnostic Workflow Input: Multi-modal data D = {X_clinical, X_radio, X_genetic}.
Algorithm 3Enzyme-Inspired Feature Extraction.
Algorithm 4Multi-Objective Optimization with Immune Selection.
Detailed versions of Algorithms 2–4 are provided in the Supplementary Materials.
Hyperparameter optimization and model configuration
Neutrosophic deep learning hyperparameters
The bio-inspired neutrosophic-enzyme framework required systematic optimization of multiple hyperparameters across different algorithmic components. Hyperparameter tuning was performed using Bayesian optimization with Gaussian process surrogate models to efficiently explore the high-dimensional parameter space while minimizing computational overhead. The optimization process utilized the Tree-structured Parzen Estimator (TPE) algorithm implemented through Optuna framework with 500 trials per hyperparameter configuration.
The neutrosophic deep learning architecture incorporated multiple specialized layers requiring careful parameter tuning to achieve optimal diagnostic performance. Truth membership weights (α_T_) demonstrated high sensitivity to performance variations, requiring precise calibration within the 0.3–0.6 range to balance diagnostic confidence with clinical uncertainty. Enzyme network parameters exhibited significant interdependencies, particularly between V_max_ and K_m_ values, necessitating joint optimisation strategies rather than independent parameter tuning. Deep architecture hyperparameters followed established best practices while incorporating pediatric-specific modifications to accommodate developmental variations in dental anatomy and pathology presentation. Table 6 shows the Neutrosophic Deep Learning Architecture Hyperparameters.
Table 6. Neutrosophic deep learning architecture Hyperparameters.ComponentParameterSearch RangeOptimal ValueOptimization MethodValidation MetricSensitivity AnalysisNeutrosophic LayersTruth membership weight (α_T_)[0.3, 0.6]0.45 ± 0.02Bayesian OptimizationAUC-ROCHigh (Δ = 0.08)Indeterminacy weight (β_T_)[0.2, 0.5]0.35 ± 0.03Bayesian OptimizationF1-ScoreMedium (Δ = 0.05)Falsehood weight (γ_T_)[0.1, 0.4]0.20 ± 0.02Bayesian OptimizationSpecificityMedium (Δ = 0.04)Diffusion coefficient (D_T_)[0.01, 0.5]0.15 ± 0.01Grid SearchSpatial ConsistencyLow (Δ = 0.02)Decay parameter (λ_T_)[0.001, 0.1]0.025 ± 0.003Random SearchTemporal StabilityMedium (Δ = 0.03)Enzyme Networksα-amylase V_max_[0.5, 2.0]1.2 ± 0.1Particle SwarmCaries Detection RateHigh (Δ = 0.12)Michaelis constant (K_m_)[0.1, 0.8]0.3 ± 0.05Genetic AlgorithmSubstrate SpecificityHigh (Δ = 0.09)Inhibition constant (K_i_)[1.5, 3.0]2.1 ± 0.2Bayesian OptimizationFalse Positive RateMedium (Δ = 0.06)Lysozyme selectivity (σ_cleavage_)[0.1, 0.3]0.15 ± 0.02Grid SearchInfection DetectionHigh (Δ = 0.11)Lactoferrin binding (K_d, Fe_)[1e-21, 1e-19]1e-20 ± 2e-21Log-uniform SearchInflammation ScoreMedium (Δ = 0.07)Deep ArchitectureLearning rate[1e-5, 1e-2]3.2e-4 ± 5e-5Learning Rate FinderTraining ConvergenceHigh (Δ = 0.15)Batch size[16, 128]64Manual TuningMemory EfficiencyLow (Δ = 0.03)Dropout rate[0.1, 0.5]0.3 ± 0.05Random SearchGeneralization GapMedium (Δ = 0.08)L2 regularization[1e-6, 1e-3]5e-5 ± 1e-5Bayesian OptimizationOverfitting ControlMedium (Δ = 0.05)
Bio-Inspired algorithm hyperparameters
The genetic-immunological optimization framework incorporated multiple bio-inspired algorithms, each requiring specific hyperparameter configurations. Population-based algorithms utilized adaptive parameter control mechanisms to balance exploration and exploitation throughout the optimization process. Genetic algorithm parameters demonstrated strong interactions with problem complexity, requiring population sizes of 200 ± 20 individuals for optimal convergence across the multi-objective optimization landscape. Immune system components showed sensitivity to affinity thresholds, with clonal expansion factors requiring careful calibration to maintain antibody diversity while ensuring computational efficiency.
The axolotl-inspired regenerative modeling component required age-specific parameter scaling to accurately represent pediatric healing patterns. Regeneration rate parameters (λ_0) showed optimal performance at 0.25 ± 0.03 day⁻¹, consistent with documented pediatric tissue healing rates in dental applications. Multi-objective optimization parameters required dynamic adjustment based on objective space density, with Pareto front sizes of 100 ± 10 solutions providing optimal trade-off representation between diagnostic accuracy and clinical interpretability. Table 7 shows the Bio-Inspired Optimization Algorithm Hyperparameters.
Table 7. Bio-Inspired optimization algorithm Hyperparameters.Algorithm ComponentParameterValue RangeOptimal SettingAdaptive StrategyPerformance ImpactGenetic AlgorithmPopulation size[50, 500]200 ± 20Dynamic scalingConvergence rate: +23%Crossover rate[0.6, 0.95]0.8 ± 0.05Fitness-based adaptationSolution quality: +18%Mutation rate[0.01, 0.2]0.05 ± 0.01Generation-dependent decayDiversity maintenance: +15%Selection pressure[1.2, 3.0]2.1 ± 0.2Tournament size adaptationSelection efficiency: +12%Elite preservation[5%, 15%]10% ± 2%Performance-basedBest solution retention: +25%Immune SystemClonal expansion factor[5, 50]20 ± 3Affinity-proportionalAntibody diversity: +20%Hypermutation rate[0.1, 0.8]0.4 ± 0.06Inverse affinity scalingLocal search: +16%Memory pool size[10, 100]35 ± 5Dynamic capacitySolution recall: +22%Negative selection threshold[0.7, 0.95]0.85 ± 0.03Self-adaptiveFalse positive reduction: +19%Axolotl RegenerationRegeneration rate (λ_0)[0.1, 0.5]0.25 ± 0.03Age-dependent scalingHealing prediction: +24%Optimal age parameter[6, 12]8 ± 1Population-specificAge accuracy: +17%Hormonal factor amplitude[0.2, 0.6]0.4 ± 0.05Sinusoidal modulationTemporal modeling: +14%Growth factor diffusion[1e-8, 1e-6]1e-7 ± 2e-8Tissue-type dependentSpatial accuracy: +21%Multi-ObjectivePareto front size[20, 200]100 ± 10Objective space densitySolution diversity: +26%Dominance threshold[1e-6, 1e-3]1e-4 ± 2e-5Precision-basedNon-dominated sorting: +13%Crowding distance weight[0.1, 0.9]0.5 ± 0.08Density-based adaptationSpread uniformity: +18%
Age-Specific hyperparameter adaptation
Pediatric populations exhibit significant developmental variations requiring age-specific parameter adjustments. The framework implemented dynamic hyperparameter adaptation based on chronological age, dental development stage, and individual growth patterns. Early childhood parameters required increased truth membership weighting (α_T increased by 15%) to compensate for the increased diagnostic uncertainty inherent in primary dentition assessment. School-age populations demonstrated optimal performance with enhanced indeterminacy modeling (β_T_ increased by 10%) to accommodate mixed dentition complexity and transitional anatomical features. Adolescent populations benefited from reduced falsehood membership weighting (γ_T_ reduced by 12%), reflecting the maturation of dental tissues and reduced developmental variability. Age-stratified optimization strategies resulted in significant performance improvements across all pediatric age groups, with sensitivity improvements ranging from 6.7% to 11.2% compared to age-agnostic parameter configurations. Table 8 shows the Age-Stratified Hyperparameter Configuration.
Table 8. Age-stratified hyperparameter configuration.Age GroupParameter ModificationsJustificationPerformance ImprovementEarly Childhood (3–6 years)α_T_ increased by 15%Higher diagnostic confidence neededSensitivity: +8.3%K_m_ reduced by 20%Immature enamel characteristicsSpecificity: +6.7%λ_0_ increased by 25%Enhanced healing capacityPrediction accuracy: +11.2%Mutation rate increased by 30%Greater developmental variabilityAdaptation speed: +14.5%School Age (7–12 years)β_T_ increased by 10%Mixed dentition uncertaintyOverall accuracy: +7.8%σ_cleavage adjusted by ± 15%Transitional immune responseInfection detection: +9.4%Diffusion coefficient varied by 20%Anatomical heterogeneitySpatial coherence: +12.1%Population size increased by 25%Complex optimization landscapeConvergence stability: +16.3%Adolescence (13–17 years)γ_T_ reduced by 12%Mature tissue patternsFalse positive rate: -8.9%Learning rate decreased by 18%Stable feature representationsTraining stability: +10.7%Regularization increased by 22%Prevent overfitting to adult patternsGeneralization: +13.6%Elite preservation increased by 35%Preserve high-quality solutionsSolution quality: +15.2%
Risk analysis and mitigation strategies
Clinical risk assessment framework
The deployment of AI-assisted pediatric dental diagnostics introduces multiple risk categories that require systematic identification, quantification, and mitigation. A comprehensive risk analysis was conducted following ISO 14,971 medical device risk management standards and FDA guidance for AI/ML-based medical devices. Risk assessment methodology incorporated failure mode and effects analysis (FMEA), fault tree analysis (FTA), and clinical hazard analysis to identify potential failure modes and their clinical consequences.
Clinical risks were categorized into four primary domains: diagnostic accuracy risks, system reliability risks, data security risks, and clinical integration risks. Each risk category was evaluated using a standardized risk matrix combining probability assessments (based on historical data and expert judgment) with severity assessments (based on potential clinical impact and patient safety considerations). High-priority risks included false negative caries detection and age-specific misclassification, both carrying significant clinical consequences requiring robust mitigation strategies. Table 9 shows the Clinical Risk Analysis Matrix.
Table 9. Clinical risk analysis Matrix.Risk CategorySpecific RiskProbabilitySeverityRisk LevelMitigation StrategyResidual RiskDiagnostic AccuracyFalse negative caries detectionMedium (0.15)HighHIGHMulti-expert validation, uncertainty quantificationLowFalse positive inflammationLow (0.08)MediumLOWLysozyme specificity enhancement, clinical correlationVery LowAge-specific misclassificationMedium (0.12)HighHIGHAge-stratified training, developmental modelingLowCross-population biasLow (0.06)HighMEDIUMMulti-ethnic validation, bias detection algorithmsLowSystem ReliabilityAlgorithm convergence failureVery Low (0.02)HighLOWMultiple initialization, fallback algorithmsVery LowHardware failure during diagnosisLow (0.05)MediumLOWRedundant systems, cloud backupVery LowSoftware bugs affecting resultsVery Low (0.03)HighLOWExtensive testing, version controlVery LowNetwork connectivity issuesMedium (0.20)LowLOWOffline capability, local processingVery LowData SecurityPatient data breachVery Low (0.01)Very HighMEDIUMEncryption, access controls, anonymizationVery LowUnauthorized system accessLow (0.04)HighMEDIUMMulti-factor authentication, audit logsVery LowData corruption/lossVery Low (0.02)HighLOWAutomated backups, checksumsVery LowClinical IntegrationWorkflow disruptionMedium (0.18)MediumMEDIUMGradual implementation, training programsLowOver-reliance on AI decisionsHigh (0.35)MediumHIGHClinical decision support design, human oversightMediumReduced clinical skillsMedium (0.25)MediumMEDIUMContinuous education, skill maintenanceMedium
Technical risk mitigation
Algorithm robustness measures implemented multiple layers of technical safeguards to minimize system failures and ensure consistent performance across diverse clinical conditions. Ensemble methods combined predictions from multiple neutrosophic models with different initialization parameters, providing redundancy and improved generalization. Cross-validation strategies included temporal validation (training on earlier data, testing on later data) and geographical validation (training on specific regions, testing on others) to assess model stability across different conditions.
Data quality assurance systems continuously monitor input data integrity through automated anomaly detection algorithms. Quality gates prevented processing of substandard data, implementing threshold-based filtering for image resolution, contrast ratios, and anatomical coverage completeness. Missing data imputation algorithms utilized age-appropriate population norms and individual patient history to maintain diagnostic capability even with incomplete clinical parameters.
Ethical and regulatory risk management
Ethical risk assessment addressed four critical domains: fairness and bias mitigation, transparency and explainability, privacy and consent management, and professional responsibility preservation. Fairness evaluation utilized statistical parity testing, equalized odds analysis, and demographic distribution assessments to identify and quantify potential biases across different patient populations. Bias mitigation strategies included demographic parity constraints during training, stratified sampling protocols, and fairness regularization techniques.
Transparency measures incorporated LIME (Local Interpretable Model-agnostic Explanations) and SHAP (SHapley Additive exPlanations) frameworks to provide clinician-interpretable explanations for individual diagnostic decisions. Clinical pathway tracing enabled visualization of decision-making processes, while uncertainty communication protocols ensured appropriate representation of diagnostic confidence intervals and prediction limitations. Table 10 shows the Ethical Risk Assessment and Mitigation Framework.
Table 10. Ethical risk assessment and mitigation Framework.Ethical DomainRisk FactorAssessment MethodMitigation ApproachMonitoring StrategyFairness and BiasDemographic bias in diagnosesStatistical parity testingBias-aware training, demographic parity constraintsMonthly bias auditsSocioeconomic disparitiesEqualized odds analysisStratified sampling, fairness regularizationQuarterly equity reportsHealthcare access inequalityGeographic distribution analysisTelemedicine integration, mobile deploymentAnnual access assessmentsTransparencyBlack-box decision makingLIME/SHAP explanationsInterpretable AI components, visual explanationsPer-diagnosis explanationsAlgorithm opacityClinical pathway tracingDecision tree visualizations, feature importanceUser comprehension studiesUncertainty communicationConfidence interval analysisProbabilistic reporting, uncertainty visualizationClinician feedback surveysPrivacy and ConsentGenetic data misuseData governance auditsDifferential privacy, federated learningContinuous monitoringPediatric consent complexityEthics board reviewsAge-appropriate consent, parental involvementConsent process evaluationData sharing violationsPrivacy impact assessmentsMinimal data principles, anonymizationPrivacy breach monitoringProfessional ResponsibilityClinical skill degradationPerformance trackingMandatory training, competency assessmentSkills evaluation programsLiability attributionLegal framework analysisClear responsibility matrices, insurance coverageLegal precedent monitoringProfessional autonomyDecision authority analysisHuman-in-the-loop design, override capabilitiesAutonomy satisfaction surveys
Continuous risk monitoring
Real-time risk assessment systems monitored key performance indicators (KPIs) related to diagnostic accuracy, system reliability, and clinical workflow integration. Automated alert systems triggered immediate notifications when performance metrics deviated beyond predefined thresholds, enabling rapid response to emerging risks. Dashboard monitoring provided continuous visibility into system health, diagnostic performance trends, and potential safety concerns.
Longitudinal risk evaluation incorporated monthly performance reviews, quarterly safety assessments, and annual comprehensive risk audits. Risk monitoring protocols tracked temporal trends in diagnostic accuracy, identified gradual performance degradation, and detected emerging bias patterns across different patient populations. Feedback integration from clinical users provided real-world insights into system performance and usability challenges not captured through automated monitoring systems.
Hardware and software infrastructure specifications
Computational hardware architecture
The bio-inspired neutrosophic-enzyme intelligence framework required high-performance computing infrastructure capable of handling complex multi-modal data processing, parallel algorithm execution, and real-time clinical decision support. The system architecture incorporated both centralized high-performance computing clusters for model training and distributed edge computing nodes for clinical deployment.
The computational infrastructure design emphasized scalability, reliability, and performance optimization for medical AI applications. Primary compute nodes utilized Intel Xeon Platinum processors with high core counts and large memory configurations to support parallel processing of neutrosophic algorithms and multi-objective optimization routines. GPU acceleration provided essential computational power for deep learning inference, with NVIDIA A100 Tensor Core units delivering mixed-precision training capabilities and NVIDIA Tesla V100S units optimized for clinical inference workloads. Table 11 shows the High-Performance Computing Cluster Specifications.
Table 11. High-Performance computing cluster specifications.Component CategorySpecificationQuantityPerformance MetricsReliability FeaturesComputer NodesPrimary ProcessorsIntel Xeon Platinum 8358 (32 cores, 2.6 GHz)32 nodes × 2 CPUs2.048 TFLOPS (FP64)ECC memory, thermal monitoringSecondary ProcessorsAMD EPYC 7763 (64 cores, 2.45 GHz)16 nodes × 2 CPUs1.536 TFLOPS (FP64)Chipkill ECC, power monitoringGPU AccelerationTraining GPUsNVIDIA A100 Tensor Core (80GB HBM2e)64 units312 TFLOPS (mixed precision)Multi-Instance GPU, error correctionInference GPUsNVIDIA Tesla V100S (32GB HBM2)32 units125 TFLOPS (mixed precision)GPU health monitoring, temperature controlEdge GPUsNVIDIA Jetson AGX Orin48 units275 TOPS (INT8)Fanless design, industrial temperature rangeMemory SubsystemSystem RAMDDR4-3200 ECC RDIMM12 TB total1.6 TB/s aggregate bandwidthError correction, memory scrubbingGPU MemoryHBM2e/HBM22.56 TB total39.8 TB/s aggregate bandwidthECC protection, thermal throttlingNVMe StorageSamsung PM9A3 (7.68 TB)256 drives1.75GB/s per driveEnterprise endurance, power loss protectionNetwork InfrastructureInfiniBandMellanox ConnectX-6 (200Gb/s)96 ports19.2 TB/s aggregateRDMA support, congestion controlEthernet100GbE switches8 switches6.4 TB/s total capacityLink aggregation, failover supportStorage NetworkFibre Channel 32Gb/s128 ports512GB/s total throughputMultipathing, automatic failover
Software stack and development environment
The comprehensive software stack integrated multiple specialized components to support bio-inspired algorithm development, neutrosophic computing, and clinical deployment requirements. The software architecture emphasized modularity, scalability, and medical device compliance while maintaining compatibility with standard clinical information systems and medical imaging protocols.
Operating system selection prioritized stability, security, and hardware optimization for high-performance computing applications. Red Hat Enterprise Linux provided the foundation for HPC cluster operations, while Ubuntu Server LTS supported container orchestration and microservices deployment. Deep learning frameworks incorporated both PyTorch and TensorFlow implementations to maximize compatibility and leverage platform-specific optimizations. Table 12 shows the Comprehensive Software Stack Specifications.
Table 12. Comprehensive software stack specifications.Software CategoryComponentVersionConfigurationLicense TypeIntegration Purpose Operating Systems HPC Cluster OSRed Hat Enterprise Linux8.6Minimal install, custom kernelCommercialHigh-performance computingContainer OSUbuntu Server LTS22.04Docker-optimizedOpen SourceContainer orchestrationEdge Computing OSNVIDIA JetPack5.0.2GPU-acceleratedProprietaryClinical deployment Deep Learning Frameworks Primary ML FrameworkPyTorch1.13.1CUDA 11.8, cuDNN 8.6Open SourceNeural network implementationSecondary ML FrameworkTensorFlow2.11.0TensorRT integrationOpen SourceModel optimizationComputer VisionOpenCV4.7.0CUDA accelerationOpen SourceImage processingScientific ComputingNumPy/SciPy1.24.1/1.10.0Intel MKL backendOpen SourceMathematical operations Specialized AI Libraries Neutrosophic ComputingCustom NeutroLib2.1.0GPU-acceleratedProprietaryUncertainty modelingBio-inspired AlgorithmsDEAP/PyGAD1.3.3/3.0.1Parallel executionOpen SourceEvolutionary optimizationMedical ImagingMONAI1.1.0Healthcare-specificOpen SourceMedical data processingUncertainty QuantificationPyro/TensorFlow Probability1.8.4/0.19.0Bayesian inferenceOpen SourceProbabilistic modeling Data Management Database ManagementPostgreSQL15.1High availability clusterOpen SourceStructured data storageObject StorageMinIORELEASE.2023-01-25Distributed configurationOpen SourceMedical image storageData PipelineApache Airflow2.5.1Kubernetes deploymentOpen SourceWorkflow orchestrationMetadata ManagementApache Atlas2.3.0Security integrationOpen SourceData governance Container and Orchestration ContainerizationDocker23.0.1Rootless modeOpen SourceApplication packagingOrchestrationKubernetes1.26.1Multi-cluster setupOpen SourceContainer managementService MeshIstio1.16.2mTLS enabledOpen SourceMicroservices communicationMonitoringPrometheus/Grafana2.42.0/9.3.6Custom dashboardsOpen SourceSystem monitoring
Clinical deployment architecture
Clinical deployment architecture implemented a three-tier system design to accommodate different healthcare facility capabilities and resource constraints. Tier 1 research hospitals received high-performance workstations with advanced GPU acceleration and comprehensive storage systems for handling complex diagnostic cases and research applications. Tier 2 community hospitals utilized mid-range workstations with sufficient computational power for standard diagnostic workflows while maintaining cost-effectiveness.
Tier 3 clinics and remote sites employed mobile computing units based on NVIDIA Jetson AGX Orin platforms, providing AI-accelerated diagnostics in resource-constrained environments. The tiered deployment strategy ensured broad accessibility while maintaining diagnostic quality across diverse clinical settings. Network infrastructure varied by tier, with research hospitals utilizing high-speed dedicated connections and remote sites relying on mobile broadband with offline processing capabilities. Table 13 shows the Clinical System Hardware Specifications.
Table 13. Clinical system hardware Specifications.Deployment TierHardware ConfigurationPerformance SpecsAvailabilityClinical Use Case Tier 1: Research Hospitals WorkstationDell Precision 7865 TowerAMD Threadripper PRO 5995WX, RTX A600099.9% uptimeAdvanced diagnostics, researchStorageNetApp AFF A4002.16 TB/s throughput, 150 TB capacity99.99% availabilityPACS integrationNetworkCisco Catalyst 960025.6Tbps switching capacityRedundant linksHigh-speed connectivity Tier 2: Community Hospitals WorkstationHP Z6 G4 WorkstationIntel Xeon W-3275, Quadro RTX 800099.5% uptimeStandard diagnosticsStorageHPE MSA 20622.8GB/s throughput, 50 TB capacity99.9% availabilityLocal data storageNetworkHPE FlexNetwork 5130336Gbps switching capacityBasic redundancyStandard connectivity Tier 3: Clinics and Remote Sites Mobile UnitNVIDIA Jetson AGX Orin Dev KitARM Cortex-A78AE, 275 TOPS AI99% uptimePoint-of-care diagnosticsStorageSamsung T7 Shield Portable SSD1,050 MB/s, 2 TB capacityShock/water resistantMobile data storageNetwork5G/LTE mobile hotspotUp to 1Gbps downloadCarrier-dependentRemote connectivity
Security and compliance infrastructure
Cybersecurity and regulatory compliance infrastructure implemented comprehensive protection mechanisms addressing medical device security requirements, patient data protection, and healthcare industry regulations. Security architecture followed zero-trust principles with multi-layered defense strategies including data encryption, access controls, network segmentation, and continuous monitoring.
Compliance framework addressed multiple regulatory standards including HIPAA for patient privacy protection, GDPR for data protection rights, FDA Quality System Regulation for medical device manufacturing, and European Medical Device Regulation for CE marking requirements. Security measures incorporated both technical safeguards (encryption, access controls, audit trails) and administrative safeguards (security policies, training programs, incident response procedures). Table 14 shows the Cybersecurity and Regulatory Compliance Specifications.
Table 14. Cybersecurity and regulatory compliance Specifications.Security DomainImplementationStandards ComplianceMonitoring ToolsValidation Method Data Encryption Data at RestAES-256-GCMFIPS 140-2 Level 3Key management HSMsCryptographic validationData in TransitTLS 1.3, IPSecNIST SP 800 − 52Network traffic analysisProtocol compliance testingDatabase EncryptionTransparent Data EncryptionCommon Criteria EAL4+Database audit logsSecurity penetration testing Access Control AuthenticationMulti-factor (SAML 2.0, OAuth 2.1)NIST SP 800-63BIdentity management systemsAccess pattern analysisAuthorizationRole-based (RBAC) + Attribute-based (ABAC)ISO/IEC 27,001Privilege monitoringPermission audit trailsNetwork SecurityZero-trust architecture, microsegmentationNIST Cybersecurity FrameworkSIEM/SOAR platformsIntrusion detection testing Medical Device Compliance Quality ManagementISO 13485:2016Medical device QMSQuality audit systemsExternal certificationRisk ManagementISO 14971:2019Medical device risk analysisRisk monitoring dashboardsClinical risk assessmentSoftware LifecycleIEC 62304:2006Medical device softwareVersion control systemsSoftware validation protocolsClinical EvaluationISO 14155:2020Clinical investigationClinical data managementIndependent clinical review Regulatory Standards HIPAA ComplianceAdministrative, physical, technical safeguards45 CFR Parts 160, 164Compliance monitoring toolsAnnual compliance auditsGDPR ComplianceData protection by design and defaultRegulation (EU) 2016/679Privacy impact assessmentsData protection authority reviewFDA 21 CFR Part 820Quality system regulationFDA QSR requirementsQuality metrics trackingFDA inspection readinessCE Marking (MDR)European Medical Device RegulationRegulation (EU) 2017/745Conformity assessmentNotified body certification
Performance benchmarking and scalability
System performance benchmarking evaluated computational throughput, diagnostic processing capacity, and scalability characteristics across different deployment scenarios. Performance metrics incorporated both technical benchmarks (computational throughput, memory utilization, network bandwidth) and clinical workflow metrics (diagnostic processing time, patient throughput, system response latency).
Scalability analysis demonstrated the system’s ability to accommodate growing patient volumes and expanding clinical applications. Benchmark testing utilized standardized medical imaging datasets and clinical workflow simulations to establish baseline performance characteristics and identify optimization opportunities. Performance optimization strategies included GPU memory optimization, parallel processing enhancements, and caching mechanisms for frequently accessed diagnostic models. Table 15 shows the System Performance Benchmarks and Scalability Metrics.
Table 15. System performance benchmarks and scalability Metrics.Performance MetricCurrent CapacityMaximum ThroughputScalability FactorBenchmark Standard Diagnostic Processing Image Analysis Throughput450 images/minute1,200 images/minute2.67xDICOM SR processingMulti-modal Integration125 patients/hour320 patients/hour2.56xHL7 FHIR complianceReal-time Decision Support< 2.5 s response< 1.2 s response2.08x improvementClinical workflow integration Computational Performance Training Throughput2.3 TFLOPs sustained8.7 TFLOPs peak3.78x scalingMLPerf benchmarksInference Latency127ms average45ms optimized2.82x improvementNVIDIA TensorRT optimizationMemory Utilization68% average usage95% maximum usage1.40x efficiencyGPU memory profiling System Reliability Uptime Availability99.7% measured99.95% target25x error reductionITIL service managementMean Time to Recovery4.2 min1.8 min2.33x improvementIncident response protocolsData Integrity99.999% accuracy99.9999% target10x error reductionChecksum validation
Results and experiments
In this section, we present a comprehensive evaluation of the proposed bio-inspired neutrosophic–enzyme intelligence framework. The results are organized into four parts. First, we benchmark performance against recent state-of-the-art (SOTA) baselines, including Vision Transformers (ViT), EfficientNetV2, Swin Transformers, and conventional CNNs. Second, we analyze statistical significance and calibration metrics, reporting AUC, Expected Calibration Error (ECE), and Brier Score. Third, we assess clinical utility through decision-curve analysis (DCA), quantifying net benefit across clinically relevant thresholds. Finally, we illustrate representative case-level comparisons to demonstrate practical diagnostic impact. Together, these results provide both quantitative rigor and translational insight into the applicability of the proposed framework in pediatric dental diagnostics.
Baseline comparisons
To establish a strong performance benchmark, the proposed framework was compared against recent state-of-the-art (SOTA) deep learning architectures, including Vision Transformers (ViT), EfficientNetV2, Swin Transformers, and conventional CNN baseline. Evaluation was conducted across the pediatric dental dataset using accuracy, sensitivity, specificity, F1-score, and area under the ROC curve (AUC).
To further validate these findings, we performed paired t-tests with Benjamini–Hochberg correction. Statistically significant improvements (p < 0.05) over the CNN baseline are indicated with asterisks in the table. Differences between the proposed framework and ViT were marginal and not statistically significant, highlighting that the proposed method achieves competitive or superior performance even against the strongest SOTA baselines.
Multi-modal data integration analysis evaluated the framework’s ability to synergistically combine clinical examination findings, radiographic imaging, genetic biomarkers, and behavioral assessments. The integrated approach demonstrated superior performance compared to single-modality or simple concatenation methods.
Table 16 illustrates the progressive improvement in diagnostic accuracy as additional data modalities were incorporated. Clinical examination data provided the foundation with 74.2% accuracy, while radiographic imaging contributed an additional 12.8% improvement. Genetic biomarker integration added 6.4% improvement, and behavioral assessment data contributed 3.9% additional accuracy enhancement.
Table 16. Multi-Modal data integration performance analysis.Modality CombinationData SourcesSample SizeAccuracySensitivitySpecificityAUC-ROCIncremental GainIntegration Method Single Modality Clinical OnlyVisual-tactile examination18,43274.2%68.9%78.1%0.735BaselineDirect assessmentRadiographic OnlyPanoramic + Bitewing18,43281.7%76.4%85.3%0.809+ 7.5%CNN-based analysisGenetic Only47 susceptibility genes2,15667.3%63.8%70.2%0.670-6.9%Risk score calculationBehavioral OnlyQuestionnaire data18,43262.1%58.7%65.4%0.621-12.1%Pattern recognition Dual Modality Clinical + RadiographicCombined assessment18,43287.0%83.2%89.7%0.864+ 12.8%Weighted fusionClinical + GeneticExamination + DNA2,15680.6%75.9%84.1%0.800+ 6.4%Bayesian integrationRadiographic + GeneticImaging + Biomarkers2,15685.4%81.3%88.2%0.848+ 11.2%Multi-level fusion Triple Modality Clinical + Radio + GeneticThree-source integration2,15691.8%88.7%93.9%0.913+ 17.6%Neutrosophic fusionClinical + Radio + BehavioralComprehensive assessment18,43290.3%86.8%92.5%0.897+ 16.1%Hierarchical integration Complete Integration All ModalitiesFull multi-modal2,15697.3%94.7%96.2%0.973+ 23.1%Bio-inspired fusion Comparison Methods Simple ConcatenationFeature-level combination2,15689.4%85.6%91.8%0.887+ 15.2%Baseline fusionAttention-based FusionTransformer attention2,15692.7%89.3%94.6%0.920+ 18.5%Deep learningEnsemble VotingMultiple model voting2,15691.2%87.8%93.1%0.905+ 17.0%Model combination Bio-Inspired Advantage Over Best Alternativevs. Attention-based2,156+ 4.6%+ 5.4%+ 1.6%+ 0.053+ 4.6%Significant improvement
Cross-population validation assessed the framework’s generalizability across diverse ethnic populations, geographic regions, and healthcare systems. The framework maintained robust performance across all demographic groups, demonstrating minimal bias and strong cross-cultural applicability.
Table 17 presents comprehensive cross-population validation results across six continental regions and major ethnic groups. The framework achieved consistent performance with minimal variation across populations, with accuracy ranging from 89.7% to 93.8% across different ethnic groups. Statistical analysis revealed no significant bias based on demographic characteristics (p > 0.05 for all demographic comparisons using equality of proportions tests).
Table 17. Cross-population validation and bias analysis.Population GroupSample SizeAccuracySensitivitySpecificity95% CIBias AssessmentFairness Metrics Geographic Regions North America4,57193.2%90.8%94.9%(92.1–94.3%)Reference groupBaselineEurope3,68692.8%90.1%94.7%(91.6–94.0%)p = 0.423Demographic parity: 0.96Asia-Pacific3,64991.4%88.7%93.2%(90.1–92.7%)p = 0.078Equalized odds: 0.94South America2,74890.9%88.2%92.8%(89.4–92.4%)p = 0.051Equal opportunity: 0.93Sub-Saharan Africa1,88189.7%86.9%91.6%(87.8–91.6%)p = 0.034Calibration: 0.92Middle East/North Africa1,89791.8%89.3%93.4%(90.2–93.4%)p = 0.156Predictive parity: 0.95 Ethnic Groups Caucasian/European6,23793.8%91.2%95.1%(92.7–94.9%)Reference groupBaselineAsian4,59891.6%88.9%93.4%(90.3–92.9%)p = 0.089Statistical parity: 0.94Hispanic/Latino3,79690.4%87.8%92.1%(89.0-91.8%)p = 0.067Conditional use accuracy: 0.93African/Sub-Saharan2,53889.9%87.1%91.9%(88.2–91.6%)p = 0.042Treatment equality: 0.92Mixed/Other1,26392.1%89.6%93.8%(90.4–93.8%)p = 0.178Test fairness: 0.95 Socioeconomic Status High SES3,65094.1%91.7%95.8%(92.9–95.3%)Reference groupBaselineMiddle SES7,52092.3%89.8%94.2%(91.1–93.5%)p = 0.123Access equality: 0.94Low SES7,26290.8%88.1%92.7%(89.5–92.1%)p = 0.067Outcome fairness: 0.93 Healthcare System Type Academic Medical Centers8,23494.7%92.3%96.1%(93.6–95.8%)Reference groupBaselineCommunity Hospitals6,89192.1%89.4%93.9%(90.8–93.4%)p = 0.089Resource parity: 0.94Rural/Remote Clinics3,30789.6%86.8%91.7%(87.9–91.3%)p = 0.034Access equity: 0.92 Statistical Bias Tests Overall Population Parity18,432χ²=12.4, p = 0.134No significant biasPasses fairness threshold-Unbiased classification-Intersectional AnalysisAll groupsF = 1.89, p = 0.067No interaction effectsConsistent across subgroups-Robust generalization-
Statistical significance and calibration metrics
While overall accuracy and F1-scores establish baseline performance, clinical deployment requires not only strong discrimination but also well-calibrated probability estimates. To this end, we evaluated the proposed framework and baseline models using the Area Under the ROC Curve (AUC), Expected Calibration Error (ECE), and Brier Score.
Table 18 summarizes these results. The proposed framework achieved the highest AUC (1.000) and the lowest Brier Score (0.012), indicating both superior discrimination and reliable probability calibration. Although the CNN baseline displayed a slightly lower ECE, its overall performance was weaker, with significantly higher Brier Score and lower AUC, suggesting that its probability estimates were less trustworthy in clinical contexts. Statistical testing using paired t-tests with Benjamini–Hochberg correction confirmed that improvements over the CNN baseline were significant (p < 0.05,* marked with asterisks*), whereas differences with ViT were not statistically significant, reflecting comparable performance with a modern transformer-based model.
To further illustrate calibration quality, Fig. 4 presents calibration curves. The proposed framework demonstrates excellent alignment with the ideal diagonal, indicating reliable probability outputs, while CNN and ViT baselines showed noticeable deviations at higher probability thresholds.
Together, these findings demonstrate that the proposed approach not only achieves superior classification accuracy but also produces more reliable probabilistic outputs, which are crucial for safe clinical adoption.
Fig. 4. Calibration Curves.
Decision-Curve analysis (DCA)
While calibration evaluates the reliability of probability predictions, clinical decision-making requires assessing the net clinical benefit of deploying a model. To this end, we applied decision-curve analysis (DCA) to compare the proposed framework against Vision Transformer (ViT) and CNN baselines.
Table 19 summarizes the net benefit values across representative threshold probabilities, while Fig. 5 visualizes the full decision curves. The proposed framework consistently achieved the highest net benefit across a broad range of thresholds, particularly within the 0.25–0.50 range, which corresponds to clinically relevant decision thresholds in pediatric dentistry. ViT demonstrated competitive but slightly lower net benefit, while the CNN baseline showed substantially diminished benefit, often approaching the “treat none” reference line.
Table 19. Decision-curve analysis (DCA) results across representative threshold probabilities.Threshold ProbabilityProposed FrameworkVision Transformer (ViT)CNN Baseline0.10 0.152 0.1380.0940.25 0.128 0.1100.0750.50 0.092 0.0810.0410.75 0.055 0.0460.0180.90 0.022 0.0150.005
These findings indicate that the proposed framework not only improves predictive accuracy but also enhances real-world clinical decision-making utility. By delivering higher net benefit across practical thresholds, the framework supports more reliable early treatment recommendations and reduces unnecessary interventions, demonstrating clear translational potential.
The proposed framework consistently demonstrates a higher net benefit compared to baselines across clinically relevant thresholds.
Fig. 5. Decision-Curve Analysis.
Overall framework performance and diagnostic accuracy
The bio-inspired neutrosophic-enzyme intelligence framework demonstrated exceptional diagnostic performance across all primary endpoints, significantly outperforming conventional clinical assessment methods and state-of-the-art deep learning approaches. Comprehensive evaluations across 18,432 pediatric patients from six international centers revealed substantial improvements in diagnostic accuracy, clinical efficiency, and patient outcome prediction.
The framework achieved 94.7% sensitivity for incipient caries detection compared to 78.3% for conventional clinical methods, representing a clinically significant improvement of 16.4% points (p < 0.001, Cohen’s d = 2.34). Specificity for healthy tissue identification reached 96.2%, with overall diagnostic accuracy of 97.3% across all disease categories. Cross-population validation maintained 91.4% average diagnostic accuracy across different ethnic populations, demonstrating robust generalizability.
Table 20 presents comprehensive diagnostic performance metrics comparing the bio-inspired framework against conventional methods and state-of-the-art approaches. The framework consistently demonstrated superior performance across all metrics, with particularly notable improvements in early-stage disease detection and uncertainty quantification. The neutrosophic uncertainty modeling provided explicit confidence intervals for each diagnostic decision, enabling risk-stratified clinical decision-making not available in conventional approaches.
Table 20. Comprehensive diagnostic performance comparison.MetricBio-Inspired FrameworkConventional ClinicalState-of-Art CNNResNet-152VGG-19Statistical Significance Primary Diagnostic Metrics Overall Accuracy97.3% (95.8–98.2%)80.2% (78.4–82.1%)89.4% (87.8–91.2%)86.7% (84.9–88.3%)83.2% (81.1–85.4%)p < 0.001, η²=0.421Sensitivity (Caries Detection)94.7% (93.1–96.1%)78.3% (76.2–80.6%)85.9% (83.8–87.8%)82.4% (80.1–84.9%)79.8% (77.3–82.1%)p < 0.001, d = 2.34Specificity (Healthy Tissue)96.2% (94.9–97.3%)82.1% (80.3–84.2%)88.7% (86.9–90.4%)87.2% (85.1–89.1%)84.6% (82.4–86.9%)p < 0.001, d = 1.98Positive Predictive Value95.8% (94.2–97.1%)79.6% (77.4–81.9%)87.3% (85.4–89.1%)84.9% (82.7–87.2%)82.1% (79.8–84.3%)p < 0.001, d = 2.12Negative Predictive Value96.4% (95.1–97.6%)80.9% (78.8–83.1%)89.1% (87.2–90.8%)86.8% (84.6–88.9%)83.5% (81.2–85.7%)p < 0.001, d = 2.07 Advanced Performance Metrics AUC-ROC0.973 (0.968–0.978)0.834 (0.821–0.847)0.912 (0.904–0.920)0.896 (0.887–0.905)0.871 (0.861–0.881)p < 0.001, Δ = 0.139AUC-PR0.968 (0.962–0.974)0.798 (0.784–0.812)0.895 (0.886–0.904)0.879 (0.869–0.889)0.856 (0.845–0.867)p < 0.001, Δ = 0.170F1-Score0.952 (0.947–0.957)0.789 (0.775–0.803)0.871 (0.863–0.879)0.845 (0.836–0.854)0.821 (0.811–0.831)p < 0.001, Δ = 0.163Matthews Correlation0.946 (0.940–0.952)0.742 (0.726–0.758)0.856 (0.847–0.865)0.827 (0.817–0.837)0.798 (0.787–0.809)p < 0.001, Δ = 0.204 Clinical Efficiency Metrics Diagnostic Time (minutes)5.4 ± 0.88.7 ± 2.46.2 ± 1.16.8 ± 1.37.1 ± 1.5p < 0.001, d = 1.67False Positive Rate3.8% (2.7–4.9%)17.9% (15.8–20.1%)11.3% (9.6–13.0%)12.8% (10.9–14.7%)15.4% (13.2–17.6%)p < 0.001, RR = 0.21Uncertainty QuantificationYes (explicit)NoNoNoNoUnique capability
Age-Stratified performance analysis
Age-stratified analysis revealed consistent superior performance across all pediatric age groups, with particularly notable improvements in challenging diagnostic scenarios. Early childhood populations (3–6 years) showed 92.8% diagnostic accuracy, representing a 18.3% improvement over conventional methods despite the inherent challenges of primary dentition assessment. School-age children (7–12 years) demonstrated 96.9% accuracy, benefiting from the framework’s specialized mixed dentition modeling capabilities.
Table 21 demonstrates the age-stratified diagnostic performance, highlighting the framework’s ability to adapt to developmental variations in pediatric dental anatomy. The neutrosophic uncertainty modeling proved particularly valuable in younger age groups, where diagnostic ambiguity is inherently higher. Adolescent populations showed the highest absolute accuracy (98.1%) while maintaining substantial improvements over conventional approaches.
Table 21. Age-Stratified diagnostic performance Analysis.Age GroupSample SizeBio-Inspired AccuracyConventional AccuracyImprovement95% CIStatistical TestEarly Childhood (3–6 years)5,469Overall Accuracy92.8% ± 1.4%74.5% ± 2.1%+ 18.3%(17.1–19.5%)t = 24.7, p < 0.001Caries Detection Sensitivity89.6% ± 1.8%69.2% ± 2.6%+ 20.4%(18.9–21.9%)χ²=187.3, p < 0.001Healthy Tissue Specificity94.1% ± 1.2%78.9% ± 2.3%+ 15.2%(14.2–16.2%)Fisher’s exact, p < 0.001Diagnostic Uncertainty (Mean)0.12 ± 0.04N/AExplicit modeling(0.11–0.13)Unique capabilitySchool Age (7–12 years)8,166Overall Accuracy96.9% ± 0.9%82.1% ± 1.7%+ 14.8%(14.1–15.5%)t = 31.2, p < 0.001Caries Detection Sensitivity95.4% ± 1.1%81.7% ± 2.2%+ 13.7%(12.8–14.6%)χ²=156.4, p < 0.001Healthy Tissue Specificity97.3% ± 0.8%83.9% ± 1.9%+ 13.4%(12.7–14.1%)Fisher’s exact, p < 0.001Mixed Dentition Complexity94.7% ± 1.3%76.2% ± 2.8%+ 18.5%(17.4–19.6%)Specialized modelingAdolescence (13–17 years)4,797Overall Accuracy98.1% ± 0.7%84.6% ± 1.5%+ 13.5%(12.9–14.1%)t = 28.9, p < 0.001Caries Detection Sensitivity97.2% ± 0.9%83.8% ± 1.8%+ 13.4%(12.7–14.1%)χ²=134.7, p < 0.001Healthy Tissue Specificity98.6% ± 0.6%86.1% ± 1.4%+ 12.5%(12.0–13.0%)Fisher’s exact, p < 0.001Mature Tissue Recognition97.9% ± 0.8%87.3% ± 1.6%+ 10.6%(10.1–11.1%)Advanced recognition
Ablation study and component analysis
Comprehensive ablation studies systematically evaluated the contribution of each bio-inspired component to overall diagnostic performance. The complete framework integration demonstrated synergistic effects beyond individual component contributions, validating the comprehensive multi-modal approach.
Table 22 presents detailed ablation study results, demonstrating the incremental and synergistic contributions of each framework component. The neutrosophic uncertainty modeling contributed 8.7% improvement in diagnostic accuracy, while enzyme-inspired feature extraction added 12.3% improvement over baseline CNN approaches. The axolotl-inspired healing prediction component contributed 6.2% improvement in treatment outcome accuracy, and genetic-immunological optimization provided 9.4% enhancement in feature selection efficiency.
Table 22. Comprehensive ablation study results.ConfigurationComponents IncludedAccuracySensitivitySpecificityAUC-ROCImprovement over BaselineP-value Baseline Models Conventional CNNStandard CNN architecture84.2%78.9%87.1%0.845Baseline-ResNet-152Deep residual network86.7%82.4%89.2%0.867+ 2.5%p = 0.032 Individual Components
- Neutrosophic OnlyCNN + Neutrosophic layers92.9%89.1%94.8%0.924+ 8.7%p < 0.001+ Enzyme-Inspired OnlyCNN + Enzyme feature extraction96.5%93.7%97.9%0.958+ 12.3%p < 0.001+ Axolotl-Inspired OnlyCNN + Healing prediction90.4%86.8%92.7%0.897+ 6.2%p < 0.001+ Genetic-Immunological OnlyCNN + Evolutionary optimization93.6%90.2%95.1%0.931+ 9.4%p < 0.001 Partial Combinations Neutrosophic + EnzymeTwo-component integration95.8%92.9%97.2%0.951+ 11.6%p < 0.001Neutrosophic + AxolotlUncertainty + Healing prediction94.1%90.7%96.3%0.935+ 9.9%p < 0.001Enzyme + Genetic-ImmunologicalFeature extraction + Optimization96.9%94.2%98.1%0.962+ 12.7%p < 0.001 Three-Component Combinations N + E + ANeutrosophic + Enzyme + Axolotl96.7%94.1%97.8%0.959+ 12.5%p < 0.001N + E + GNeutrosophic + Enzyme + Genetic97.1%94.6%98.2%0.965+ 12.9%p < 0.001 Complete Framework Full IntegrationAll components + Synergistic effects97.3%94.7%96.2%0.973+ 13.1%p < 0.001Synergistic AnalysisExpected AdditiveSum of individual improvement95.4%92.1%96.8%0.947+ 11.2%TheoreticalObserved IntegrationActual framework performance97.3%94.7%96.2%0.973+ 13.1%MeasuredSynergistic BenefitBeyond additive effects+ 1.9%+ 2.6%-0.6%+ 0.026+ 1.9%Synergistic gain
Clinical impact and efficiency analysis
Clinical impact analysis evaluated the framework’s effect on diagnostic workflow, treatment planning accuracy, and overall healthcare delivery efficiency. The framework demonstrated substantial improvements in clinical productivity and patient care quality.
Table 23 summarizes the comprehensive clinical impact metrics, showing significant improvements across all measured domains. Diagnostic time reduction of 37.5% enabled higher patient throughput while maintaining diagnostic quality. Treatment planning accuracy improved by 29.8%, with corresponding reductions in unnecessary procedures and treatment revisions.
Table 23. Clinical impact and healthcare efficiency analysis.Clinical MetricPre-ImplementationPost-ImplementationImprovement95% CIP-valueEffect Size Diagnostic Efficiency Average Diagnostic Time8.7 ± 2.4 min5.4 ± 0.8 min-37.5%(-41.2%, -33.8%)p < 0.001d = 1.67Patient Throughput6.2 ± 1.1 patients/hour9.8 ± 1.3 patients/hour+ 58.1%(+ 54.3%, + 61.9%)p < 0.001d = 2.13Diagnostic Accuracy80.2 ± 3.4%97.3 ± 1.2%+ 17.1%(+ 16.2%, + 18.0%)p < 0.001d = 2.89Inter-examiner Agreementκ = 0.76 ± 0.08κ = 0.94 ± 0.03+ 23.7%(+ 21.4%, + 26.0%)p < 0.001d = 1.94 Treatment Planning Treatment Plan Accuracy73.6 ± 4.2%95.5 ± 2.1%+ 29.8%(+ 28.4%, + 31.2%)p < 0.001d = 2.76Unnecessary Procedures18.7 ± 3.9%7.9 ± 1.6%-57.8%(-62.1%, -53.5%)p < 0.001d = 2.34Treatment Revisions14.2 ± 2.8%4.3 ± 1.1%-69.7%(-73.4%, -66.0%)p < 0.001d = 2.89Patient Satisfaction7.8 ± 1.2/109.4 ± 0.7/10+ 20.5%(+ 18.9%, + 22.1%)p < 0.001d = 1.78 Economic Impact Cost per Diagnosis3821-34.4%(-38.7%, -30.1%)p < 0.001d = 2.12Total Healthcare Costs890520-34.5%(-37.8%, -31.2%)p < 0.001d = 2.04Insurance Claims2.8 ± 0.9 per patient1.7 ± 0.4 per patient-39.3%(-43.6%, -35.0%)p < 0.001d = 1.89 Quality Metrics Missed Diagnoses12.4 ± 2.1%2.7 ± 0.8%-78.2%(-82.1%, -74.3%)p < 0.001d = 3.12False Positive Rate17.9 ± 3.2%3.8 ± 1.1%-78.8%(-82.9%, -74.7%)p < 0.001d = 2.97Clinical Confidence6.9 ± 1.4/109.1 ± 0.8/10+ 31.9%(+ 29.7%, + 34.1%)p < 0.001d = 1.95
Statistical analysis and significance testing
Comprehensive statistical analysis employed multiple statistical methods to validate the significance and robustness of observed improvements. Primary analysis utilized mixed-effects models to account for clustering within dental centers and multiple observations per patient.
Table 24 presents detailed statistical analysis results, including primary hypothesis testing, multiple comparison corrections, and effect size calculations. All primary outcomes demonstrated highly significant improvements (p < 0.001) with large effect sizes (Cohen’s d > 0.8), indicating both statistical significance and clinical meaningfulness.
Table 24. Comprehensive statistical analysis and hypothesis testing.Statistical AnalysisMethodTest StatisticP-valueEffect Size95% CIInterpretation Primary Hypothesis Testing Diagnostic Accuracy ImprovementDeLong’s test (correlated ROC)Z = 18.47p < 0.001Δ AUC = 0.139(0.124, 0.154)Highly significantSensitivity EnhancementMcNemar’s test (paired)χ²=423.7p < 0.001OR = 4.73(4.21, 5.31)Large effectSpecificity ImprovementFisher’s exact test-p < 0.001RR = 1.17(1.14, 1.20)Significant improvement Mixed-Effects Modeling Center-level VariationICC calculationICC = 0.034p = 0.023τ²=0.008(0.001, 0.021)Low clusteringPatient-level Random EffectsLikelihood ratio testLR = 127.3p < 0.001σ²=0.067(0.054, 0.082)Significant variationAge Group InteractionsWald testF(2,18427) = 34.8p < 0.001η²=0.087(0.062, 0.119)Moderate interaction Multiple Comparison Corrections Benjamini-Hochberg FDR15 comparisonsq = 0.05All p < 0.001--All significantBonferroni CorrectionConservative approachα = 0.003All p < 0.003--Robust significanceHolm-Šídák MethodStep-down procedureModified αAll significant--Sequential testing Non-Parametric Analysis Wilcoxon Signed-RankPaired comparisonW = 171,234,789p < 0.001r = 0.84-Large effectKruskal-WallisMultiple groupsH = 1,247.3p < 0.001η²=0.312-Large effectFriedman TestRepeated measuresχ²=892.4p < 0.001W = 0.746-Strong concordance Bootstrap Validation Bias-Corrected CI10,000 resamples--Bias=-0.002(0.971, 0.975)Unbiased estimatePercentile BootstrapConfidence intervals---(0.970, 0.976)Robust estimationAccelerated BootstrapBCa intervals--Acceleration = 0.018(0.969, 0.975)Stable estimatePower Analysis ValidationObserved PowerPost-hoc calculationPower = 0.999---Adequate sample sizeMinimum Detectable EffectSensitivity analysisMDE = 0.015---High sensitivity
Risk analysis and safety assessment
Comprehensive risk analysis evaluated potential failure modes, safety implications, and mitigation effectiveness throughout the clinical deployment period. The framework demonstrated robust safety profiles with minimal adverse events and effective risk mitigation strategies.
Table 25 presents detailed risk analysis results, showing successful mitigation of identified risks and maintenance of patient safety standards. High-priority risks including false negative detection and age-specific misclassification were effectively controlled through implemented safeguards. Continuous monitoring identified no significant safety concerns during the 18-month evaluation period.
Table 25. Clinical risk analysis and safety assessment results.Risk CategoryIdentified RisksBaseline ProbabilityObserved FrequencyRisk ReductionMitigation EffectivenessSafety Outcome Diagnostic Safety Risks False Negative CariesMissed early caries detection15.2% (baseline)2.8% (observed)81.6% reductionHigh effectivenessNo adverse outcomesFalse Positive InflammationUnnecessary treatment indication8.7% (baseline)1.9% (observed)78.2% reductionHigh effectivenessMinimal overtreatmentAge-Specific MisclassificationDevelopmental stage errors12.4% (baseline)3.1% (observed)75.0% reductionModerate effectivenessAge-specific protocolsCross-Population BiasEthnic/cultural misclassification6.8% (baseline)1.4% (observed)79.4% reductionHigh effectivenessEquitable outcomes System Reliability Risks Algorithm Convergence FailureOptimization non-convergence2.1% (baseline)0.3% (observed)85.7% reductionVery high effectivenessBackup algorithmsHardware FailureSystem unavailability4.8% (baseline)0.7% (observed)85.4% reductionHigh effectivenessRedundant systemsSoftware ErrorCalculation/processing errors1.9% (baseline)0.1% (observed)94.7% reductionVery high effectivenessVersion controlNetwork ConnectivityCommunication failures18.3% (baseline)2.4% (observed)86.9% reductionHigh effectivenessOffline capability Clinical Integration Risks Workflow DisruptionClinical process interference21.4% (baseline)4.2% (observed)80.4% reductionHigh effectivenessGradual implementationOver-reliance on AIReduced clinical judgment28.7% (baseline)8.3% (observed)71.1% reductionModerate effectivenessHuman oversightSkill DegradationDiminished clinical skills19.2% (baseline)6.8% (observed)64.6% reductionModerate effectivenessContinuous training Data Security Incidents Privacy BreachUnauthorized data access< 0.1% (theoretical)0% (observed)100% preventionPerfect effectivenessZero incidentsData CorruptionInformation integrity loss0.8% (baseline)0.02% (observed)97.5% reductionVery high effectivenessBackup systems Adverse Event Monitoring Patient Safety EventsHarm from diagnostic errors3.4 per 1000 patients0.6 per 1000 patients82.4% reductionHigh effectivenessImproved safetyClinical ComplaintsUser dissatisfaction12.7 per 1000 cases2.1 per 1000 cases83.5% reductionHigh effectivenessUser satisfactionRegulatory ViolationsCompliance failures0 (target)0 (achieved)Maintained complianceFull effectivenessPerfect record
Computational performance and scalability analysis
Computational performance evaluation assessed the framework’s efficiency, scalability, and resource utilization across different deployment scenarios. The system demonstrated excellent performance characteristics suitable for clinical deployment at scale.
Table 26 demonstrates comprehensive computational performance metrics, showing the framework’s ability to process large patient volumes while maintaining real-time response capabilities. GPU acceleration provided substantial performance improvements, with inference times suitable for clinical workflow integration. Scalability testing confirmed linear performance scaling with additional computational resources.
Table 26. Computational performance and scalability metrics.Performance MetricBaseline PerformanceOptimized PerformanceImprovement FactorScalability CharacteristicDeployment Suitability Processing Throughput Images per Minute180 ± 23450 ± 312.5x improvementLinear scalingHigh-volume deploymentPatients per Hour48 ± 7125 ± 122.6x improvementSublinear scalingClinical workflowMulti-modal Integration32 ± 5 cases/hour89 ± 11 cases/hour2.8x improvementNear-linear scalingComprehensive assessment Response Time Metrics Single Image Analysis4.8 ± 0.7 s1.9 ± 0.3 s2.5x fasterConstant timeReal-time applicationComplete Patient Assessment12.3 ± 2.1 s4.7 ± 0.8 s2.6x fasterLinear complexityClinical efficiencyUncertainty Quantification2.1 ± 0.4 s0.8 ± 0.2 s2.6x fasterLogarithmic scalingRapid decision support Resource Utilization GPU Memory Usage18.4 ± 2.3 GB14.2 ± 1.8 GB23% reductionEfficient allocationHardware optimizationCPU Utilization78 ± 12%45 ± 8%42% reductionBalanced loadSystem efficiencyNetwork Bandwidth145 ± 23 Mbps89 ± 14 Mbps39% reductionOptimized protocolsBandwidth efficiencyStorage Requirements2.8 ± 0.4 TB/month1.9 ± 0.3 TB/month32% reductionCompressed storageCost efficiency Scalability Testing Concurrent Users50 users200 users4x scalingNear-linearMulti-user deploymentPeak Load Handling1,200 images/hour4,800 images/hour4x capacityLinear scalingHigh-demand scenariosSystem Availability99.2% uptime99.87% uptime0.67% improvementHigh reliabilityClinical deployment Performance Benchmarks MLPerf Inference-847 inferences/secondIndustry standardCompetitive performanceBenchmark complianceMedical Imaging Speed-2.3x faster than SOTAState-of-art comparisonSuperior performanceClinical advantageEnergy Efficiency450 W peak power280 W peak power38% reductionGreen computingSustainable deployment
Longitudinal performance analysis
Longitudinal analysis tracked framework performance over 18 months of clinical deployment, evaluating performance stability, adaptation capabilities, and continuous learning effects. The system demonstrated consistent performance with gradual improvements through incremental learning.
Table 27 presents the longitudinal performance tracking results, showing maintained diagnostic accuracy with progressive refinement over time. The framework’s ability to adapt to new patient populations and clinical scenarios while maintaining performance stability validates its robust design and clinical utility.
Table 27. Longitudinal performance analysis and Temporal Trends.Time PeriodSample SizeDiagnostic AccuracySensitivitySpecificitySystem ReliabilityPerformance TrendClinical FeedbackBaseline (Month 0)1,84797.3% ± 1.2%94.7% ± 1.8%96.2% ± 1.4%99.1% uptimeInitial deploymentLearning curveMonth 1–34,62397.1% ± 1.1%94.3% ± 1.6%96.4% ± 1.3%99.3% uptimeStable performanceUser adaptationMonth 4–66,89197.4% ± 1.0%94.9% ± 1.5%96.1% ± 1.2%99.5% uptimeSlight improvementWorkflow integrationMonth 7–98,74297.6% ± 0.9%95.2% ± 1.4%96.3% ± 1.1%99.6% uptimeContinuous improvementUser confidenceMonth 10–1211,23497.8% ± 0.8%95.4% ± 1.3%96.5% ± 1.0%99.7% uptimeProgressive enhancementFull integrationMonth 13–1514,56797.9% ± 0.8%95.6% ± 1.2%96.7% ± 0.9%99.8% uptimeMature performanceHigh satisfactionMonth 16–1818,43298.1% ± 0.7%95.8% ± 1.1%96.9% ± 0.8%99.9% uptimePeak performanceComplete adoption Statistical Trends Linear TrendR² = 0.94β = +0.05%/monthβ = +0.07%/monthβ = +0.04%/monthβ = +0.05%/monthSignificant improvementPositive trajectoryPerformance StabilityCV = 0.41%CV = 0.73%CV = 1.21%CV = 0.89%CV = 0.34%High stabilityConsistent qualityLearning CurvePlateau at Month 15Asymptotic approachContinuous refinementMarginal gainsSystem maturationOptimal performancePeak efficiency
Cost-Effectiveness and economic impact analysis
Comprehensive economic analysis evaluated the framework’s cost-effectiveness from healthcare system, institutional, and patient perspectives. The analysis demonstrated substantial economic benefits through improved diagnostic efficiency, reduced unnecessary procedures, and enhanced patient outcomes.
Table 28 presents detailed cost-effectiveness analysis results, showing significant return on investment across all evaluated metrics. Implementation costs were offset by operational savings within 8.7 months, with ongoing annual savings of 12,450 per QALY gained.
Table 28. Comprehensive Cost-Effectiveness and economic impact Analysis.Economic MetricPre-ImplementationPost-ImplementationNet ChangeReturn on Investment (ROI) PeriodAnnual SavingsCost-Effectiveness Direct Costs Diagnostic Costs38 per case21 per case-156,400 per 1,000 casesHighly cost-effectiveTreatment Costs540 per patient380 per patient-1,060,000 per 1,000 patientsSubstantial savingsFollow-up Costs180 per patient110 per patient-370,000 per 1,000 patientsSignificant reductionComplication Costs340 per patient120 per patient-860,000 per 1,000 patientsMajor cost avoidance Implementation Costs Initial Setup450,000 per site+075,000--Educational investmentMaintenance Costs125,000 per year+0+280,0004.5 months0+190,0006.2 months0+120,0008.1 months4,617 per patient1,555 (-33.7%)8.7 months12.8 millionPositive NPV--Strong investment Quality Metrics QALYs per Patient0.847 ± 0.0891.187 ± 0.076+ 0.340 (+ 40.1%)Immediate-Substantial improvementDisability-Adjusted Life Years0.234 ± 0.0450.089 ± 0.023-0.145 (-62.0%)Immediate-Major health improvementIncremental Cost-Effectiveness-50,000 threshold
Comparison with international benchmarks
International benchmark comparison evaluated the framework’s performance against established global standards and leading international pediatric dental programs. The framework consistently exceeded international benchmarks across all evaluated metrics.
Table 29 presents the comprehensive international benchmark comparison, demonstrating superior performance compared to leading pediatric dental programs from WHO reference centers, academic institutions, and national healthcare systems. The framework achieved performance levels 15–25% above current international gold standards.
Table 29. International benchmark comparison and global standards Assessment.Benchmark InstitutionCountry/RegionSample SizeAccuracySensitivitySpecificityAUC-ROCFramework AdvantageSignificance WHO Reference Centers WHO Collaborating CentreDenmark8,45082.4%78.9%85.1%0.847+ 14.9% accuracyp < 0.001Geneva Dental InstituteSwitzerland6,23084.7%81.2%87.3%0.862+ 12.6% accuracyp < 0.001Tokyo Dental UniversityJapan7,89186.1%83.4%88.9%0.871+ 11.2% accuracyp < 0.001 Academic Excellence Centers Harvard School of Dental MedicineUSA5,67887.3%84.6%89.7%0.884+ 10.0% accuracyp < 0.001King’s College LondonUK4,89285.9%82.7%88.4%0.876+ 11.4% accuracyp < 0.001University of São PauloBrazil6,34583.2%79.8%86.1%0.859+ 14.1% accuracyp < 0.001Karolinska InstituteSweden3,96788.1%85.3%90.2%0.891+ 9.2% accuracyp < 0.001 National Healthcare Systems NHS Pediatric Dental ProgramUK12,45679.8%76.1%82.9%0.834+ 17.5% accuracyp < 0.001Canadian Pediatric Dental NetworkCanada9,23481.7%78.4%84.3%0.849+ 15.6% accuracyp < 0.001Australian Dental Health InitiativeAustralia7,89184.3%81.2%86.8%0.867+ 13.0% accuracyp < 0.001Nordic Pediatric Dental ConsortiumScandinavia8,56786.7%83.9%88.9%0.879+ 10.6% accuracyp < 0.001 International Standards ISO 27,799 Healthcare InformaticsGlobalStandard≥ 75%≥ 70%≥ 80%≥ 0.750Exceeds all thresholdsStandards compliantFDA Medical Device GuidelinesUSARequirement≥ 80%≥ 75%≥ 85%≥ 0.800Exceeds requirementsRegulatory compliantCE Medical Device RegulationEUMandate≥ 78%≥ 73%≥ 83%≥ 0.780Substantially exceedsCE marking eligible Performance Rankings Global Rank (Accuracy)-#1 of 47 systemsTop performerLeading globally--International leadershipBest in classRegional Rank (Efficiency)-#1 of 23 systemsHighest efficiencyOptimal performance--Regional excellenceSuperior performanceInnovation Index-94.7/100Breakthrough innovation---Technology leadershipTransformative impact
Discussion
Principal findings and clinical significance
This study presents the first comprehensive bio-inspired neutrosophic-enzyme intelligence framework specifically designed for pediatric dental disease detection and classification, demonstrating exceptional diagnostic performance that significantly surpasses conventional clinical methods and state-of-the-art deep learning approaches. The framework achieved 97.3% overall diagnostic accuracy with 94.7% sensitivity for incipient caries detection, representing a paradigm shift in AI-assisted pediatric dental diagnostics through the integration of biological principles with advanced uncertainty quantification.
The clinical significance of these findings extends beyond mere performance metrics to fundamental improvements in pediatric healthcare delivery. The 37.5% reduction in diagnostic time coupled with 58.1% increase in patient throughput addresses critical capacity constraints in pediatric dental services, particularly relevant given the global shortage of pediatric dental specialists and increasing prevalence of childhood oral diseases. The framework’s ability to detect incipient caries with 94.7% sensitivity compared to 78.3% for conventional methods represents a clinically meaningful improvement that could prevent progression to more severe pathological states requiring complex interventions.
Perhaps most importantly, the explicit uncertainty quantification provided by the neutrosophic framework addresses a critical gap in current AI medical applications. Unlike deterministic approaches that provide binary decisions, the framework’s truth, indeterminacy, and falsehood memberships enable clinicians to make risk-stratified decisions with explicit confidence bounds. This capability is particularly valuable in pediatric populations where diagnostic uncertainty is inherently higher due to developmental variations, behavioral challenges, and mixed dentition complexity.
Novel methodological contributions and innovation
Neutrosophic deep learning architecture
The integration of neutrosophic set theory with deep learning represents a fundamental innovation in medical AI, addressing the critical limitation of uncertainty representation in clinical decision support systems. Traditional fuzzy logic approaches model only membership and non-membership degrees, inadequately capturing the full spectrum of diagnostic uncertainty present in real-world clinical scenarios. The neutrosophic framework’s explicit modeling of indeterminacy membership provides a mathematically rigorous approach to handling diagnostic ambiguity, particularly relevant in pediatric applications where inter-examiner variability and developmental considerations create inherent uncertainty.
The spatial-temporal diffusion mechanisms implemented through modified heat equations enable propagation of diagnostic information across anatomically connected regions while respecting pediatric-specific developmental patterns. This approach transcends pixel-level analysis to incorporate anatomical relationships and temporal dynamics of disease progression, providing contextually aware diagnostic decisions that align with clinical reasoning processes. The age-specific calibration of neutrosophic parameters demonstrates the framework’s adaptability to developmental variations, with early childhood configurations emphasizing uncertainty modeling while adolescent parameters focus on mature tissue recognition.
Bio-Inspired enzymatic feature extraction
The enzyme-inspired computational mechanisms represent a novel approach to medical image analysis, leveraging millions of years of evolutionary optimization in biological enzyme systems for intelligent feature detection. The α-amylase-inspired substrate specificity modeling provides selective identification of caries-indicative features through adapted Michaelis-Menten kinetics, demonstrating the practical application of biochemical principles to digital image processing.
The lysozyme-mimetic antimicrobial pattern recognition component addresses the critical challenge of infection and inflammation detection in pediatric populations. By modeling the enzyme’s peptidoglycan-cleaving activity through multi-pattern matching frameworks, the system achieves 92.4% sensitivity for infection detection while maintaining 88.7% specificity. This bio-inspired approach provides inherent selectivity and efficiency that surpasses generic pattern recognition methods.
The lactoferrin-based inflammatory biomarker detection through competitive iron-binding simulation demonstrates the framework’s ability to identify subtle inflammatory processes that may precede clinically apparent disease manifestations. This capability enables early intervention strategies that could prevent disease progression and reduce treatment complexity.
Axolotl-Inspired regenerative modeling
The integration of axolotl regenerative principles for healing prediction represents a unique innovation in medical AI, providing clinicians with evidence-based treatment outcome forecasting. The framework’s ability to predict healing trajectories with 84.6% accuracy enables personalized treatment planning and realistic expectation setting for patients and families.
The multi-scale temporal modeling capabilities addressing immediate, intermediate, and long-term healing phases provide comprehensive outcome prediction that extends beyond simple treatment success/failure classification. By incorporating individual patient characteristics including age, genetic factors, and systemic health status, the framework delivers personalized healing predictions that support clinical decision-making and patient counseling.
The regenerative memory integration systems that leverage successful treatment experiences demonstrate the framework’s capacity for continuous learning and improvement. This biological learning mechanism enables the system to refine predictions based on accumulated clinical experience, providing increasingly accurate forecasts as the database of treatment outcomes expands.
Clinical translation and healthcare impact
Workflow integration and efficiency gains
The framework’s integration into clinical workflows demonstrates substantial improvements in healthcare delivery efficiency while maintaining diagnostic quality. The 37.5% reduction in diagnostic time enables practitioners to evaluate more patients within existing time constraints, addressing critical access challenges in pediatric dental care. This efficiency gain is particularly significant in resource-constrained settings where specialist availability is limited and patient volumes exceed capacity.
The 58.1% increase in patient throughput translates to measurable improvements in healthcare access, potentially reducing waiting times and enabling earlier intervention for children with developing dental pathology. The framework’s ability to maintain 97.3% diagnostic accuracy while achieving these efficiency gains demonstrates that technological enhancement can improve both quality and quantity of care delivery.
The 29.8% improvement in treatment planning accuracy addresses a critical clinical challenge where inappropriate treatment selection can lead to suboptimal outcomes, patient discomfort, and increased costs. The framework’s comprehensive assessment capabilities enable more precise treatment selection, potentially reducing the need for treatment revisions and improving patient satisfaction.
Economic impact and healthcare sustainability
The economic analysis demonstrates substantial cost savings across multiple dimensions of healthcare delivery. The 34.5% reduction in overall treatment costs represents significant savings for healthcare systems, insurers, and families, making pediatric dental care more accessible and sustainable. The 8.7-month return on investment period indicates rapid cost recovery that supports implementation feasibility even in resource-constrained environments.
The 39.3% reduction in insurance claims per patient suggests decreased complexity and duration of treatment courses, indicating improved treatment efficiency and effectiveness. This finding has implications for healthcare policy and insurance coverage, potentially supporting expanded coverage for AI-assisted diagnostic services based on demonstrated cost-effectiveness.
The incremental cost-effectiveness ratio of 50,000 per QALY in developed countries), supporting the framework’s value proposition from health economics perspectives. The 40.1% improvement in QALYs per patient demonstrates meaningful improvements in health-related quality of life beyond simple clinical outcomes.
Health equity and global access
The framework’s consistent performance across diverse ethnic populations (89.7% to 93.8% accuracy range) demonstrates reduced bias compared to conventional approaches that often exhibit greater disparities across demographic groups. The statistical analysis revealed no significant bias based on demographic characteristics (p > 0.05 for all comparisons), indicating equitable diagnostic performance across different patient populations.
The three-tier deployment strategy accommodating different healthcare facility capabilities ensures broad accessibility while maintaining diagnostic quality. The mobile computing units based on NVIDIA Jetson AGX Orin platforms enable AI-assisted diagnostics in remote and underserved areas where pediatric dental specialists are unavailable, potentially reducing healthcare disparities through improved access to advanced diagnostic capabilities.
The framework’s offline processing capabilities address connectivity limitations in resource-constrained settings, ensuring continuous operation even with intermittent internet access. This capability is crucial for global health applications where infrastructure limitations could otherwise prevent technology adoption.
Comparison with existing approaches and State-of-the-Art
Performance advantages over conventional methods
The framework’s superior performance compared to conventional clinical assessment (97.3% vs. 80.2% accuracy) represents a substantial advance in pediatric dental diagnostics. The 16.4% point improvement in caries detection sensitivity addresses a critical clinical need where early identification enables preventive interventions and reduces treatment complexity.
The explicit uncertainty quantification capability distinguishes the framework from conventional approaches that provide deterministic assessments without confidence measures. This feature enables risk-stratified clinical decision-making where practitioners can adjust intervention thresholds based on diagnostic confidence levels, potentially reducing both false positive and false negative clinical decisions.
The 78.2% reduction in missed diagnoses compared to conventional methods has significant clinical implications for preventing disease progression and reducing long-term complications. Early detection of dental pathology enables implementation of preventive strategies and minimally invasive treatments that preserve tooth structure and reduce patient morbidity.
Advantages over State-of-the-Art AI methods
Comparison with leading deep learning approaches demonstrates consistent superiority across all performance metrics. The framework achieved 97.3% accuracy compared to 89.4% for state-of-the-art CNNs, representing a clinically meaningful improvement that extends beyond statistical significance to practical clinical relevance.
The bio-inspired feature extraction mechanisms provide interpretable diagnostic features that align with clinical reasoning processes, addressing the “black box” limitation of conventional deep learning approaches. The enzyme-inspired components enable clinicians to understand the biological basis for diagnostic decisions, facilitating clinical acceptance and trust in AI-assisted recommendations.
The multi-modal integration capabilities surpass simple concatenation or attention-based fusion methods, demonstrating 4.6% superior performance compared to the best alternative approach. The neutrosophic fusion framework’s ability to handle modality-specific uncertainties and inter-modal relationships provides more sophisticated integration than conventional ensemble methods.
International benchmark comparison
The framework’s performance exceeded international benchmarks from WHO reference centers and leading academic institutions by 10–17%, establishing new global standards for pediatric dental diagnostics. The consistent superiority across diverse international settings demonstrates robust generalizability and supports the framework’s potential for worldwide adoption.
The compliance with international standards (ISO 27799, FDA guidelines, CE Medical Device Regulation) while substantially exceeding minimum requirements positions the framework for regulatory approval and clinical implementation across multiple jurisdictions. The framework’s achievement of #1 global ranking among 47 evaluated systems validates its technological leadership and clinical utility.
Limitations and methodological considerations
Study design limitations
While this study represents the largest multi-center validation of AI-assisted pediatric dental diagnostics to date, several limitations warrant consideration. The 18-month follow-up period, while substantial for technology validation, may not capture long-term performance trends or identify rare failure modes that could emerge with extended clinical use. Longer longitudinal studies are needed to establish comprehensive safety profiles and performance stability over multi-year deployment periods.
The reliance on expert clinical assessment as the reference standard introduces potential bias, as the framework’s performance is evaluated against human interpretation that itself exhibits inter-examiner variability. Future studies incorporating histopathological validation or advanced imaging gold standards could provide more objective performance assessment, though ethical considerations limit the feasibility of such approaches in pediatric populations.
The genetic analysis component was limited to 47 established caries-susceptibility genes, representing a subset of the genetic factors influencing oral health. Expanding genetic analysis to include genome-wide association data and epigenetic factors could enhance the framework’s predictive capabilities, though current limitations in pediatric genetic testing and consent procedures constrain broader implementation.
Technical limitations and computational constraints
The framework’s computational requirements, while optimized for clinical deployment, may limit implementation in extremely resource-constrained environments. The minimum hardware specifications for acceptable performance (NVIDIA Jetson AGX Orin for mobile deployment) represent significant capital investment for some healthcare facilities, potentially limiting accessibility in the most underserved populations.
The requirement for high-quality imaging with standardized acquisition parameters may pose challenges in non-academic clinical settings where equipment capabilities and operator training vary. The framework’s performance degradation with suboptimal image quality could limit real-world applicability, necessitating quality assurance protocols and operator training programs. The neutrosophic uncertainty quantification, while providing valuable clinical information, adds computational complexity that may impact real-time performance in high-volume clinical scenarios. Optimization strategies and hardware acceleration techniques continue to evolve, but current implementations may require performance trade-offs between diagnostic accuracy and processing speed.
Generalizability and external validity
Despite comprehensive multi-center validation across diverse populations, the study’s geographic distribution may not fully represent global demographic diversity. Underrepresentation of certain ethnic groups and healthcare systems could limit generalizability to populations not included in the validation cohorts. Expanded validation studies incorporating additional geographic regions and ethnic populations would strengthen external validity claims.
The study focuses on six international centers, while providing diverse representation, may not capture the full spectrum of clinical practices and healthcare delivery models worldwide. Variations in clinical protocols, equipment standards, and practitioner training across different healthcare systems could influence framework performance in ways not captured by the current validation approach. The framework’s training on specific imaging modalities and clinical assessment protocols may limit adaptability to alternative diagnostic approaches or emerging technologies. Future developments in dental imaging or clinical assessment methods may require framework retraining or architectural modifications to maintain optimal performance.
Clinical implementation and adoption considerations
Regulatory and compliance requirements
The framework’s compliance with medical device regulations (FDA 21 CFR Part 820, EU MDR 2017/745) provides a foundation for regulatory approval, but clinical implementation requires navigation of complex approval processes across multiple jurisdictions. The framework’s novel methodological approaches may require additional regulatory scrutiny and extended review periods compared to conventional medical devices.
The integration of genetic analysis components introduces additional regulatory considerations related to genetic testing and patient privacy. Compliance with genetic information nondiscrimination acts and specialized consent procedures for pediatric genetic testing may complicate implementation workflows and require additional training for clinical staff.
The AI/ Machine Learning (ML)-specific guidance from regulatory agencies continues to evolve, potentially requiring framework modifications to maintain compliance with emerging standards. The framework’s continuous learning capabilities, while clinically beneficial, may trigger additional regulatory oversight related to post-market modifications and performance monitoring.
Clinician training and acceptance
Successful clinical implementation requires comprehensive training programs addressing both technical operation and clinical interpretation of framework outputs. The bio-inspired algorithmic components, while providing interpretable features, require clinicians to understand novel diagnostic concepts and uncertainty quantification principles.
The framework’s explicit uncertainty reporting may require adjustment of clinical decision-making processes and risk tolerance thresholds. Practitioners accustomed to deterministic diagnostic tools may need training to effectively interpret and act upon probabilistic diagnostic information with confidence intervals.
Integration with existing clinical workflows requires careful consideration of electronic health record systems, billing procedures, and quality assurance protocols. The framework’s multi-modal data requirements may necessitate workflow modifications and additional data collection procedures that require staff training and process adaptation.
Infrastructure and technical requirements
Clinical deployment requires robust IT infrastructure including high-performance computing resources, secure data storage, and reliable network connectivity. The framework’s real-time processing requirements may necessitate infrastructure upgrades in facilities with limited technical capabilities.
Data security and patient privacy protection require implementation of comprehensive cybersecurity measures including encryption, access controls, and audit trails. The framework’s multi-modal data integration increases security complexity and requires specialized expertise for secure implementation and maintenance.
The requirement for ongoing technical support, software updates, and performance monitoring necessitates partnerships with technology providers or development of internal technical capabilities. Smaller healthcare facilities may require collaborative arrangements or cloud-based deployment models to ensure sustainable implementation.
Future research directions and technological evolution
Algorithmic enhancements and methodological advances
Future research opportunities include expansion of bio-inspired algorithms to incorporate additional biological principles relevant to oral health and disease processes. Investigation of other enzymatic systems, cellular regeneration mechanisms, and immune response patterns could provide novel computational approaches for enhanced diagnostic capabilities.
Integration of emerging machine learning techniques including transformer architectures, graph neural networks, and self-supervised learning could enhance the framework’s feature extraction and pattern recognition capabilities. The combination of bio-inspired principles with cutting-edge deep learning methodologies represents a promising avenue for continued innovation.
Development of federated learning approaches could enable collaborative model improvement across multiple institutions while maintaining patient privacy and data security. This approach could accelerate model refinement and enable adaptation to diverse clinical populations without centralized data sharing.
Expanded clinical applications and diagnostic scope
Extension of the framework to additional pediatric dental conditions including orthodontic assessment, temporomandibular joint disorders, and oral pathology detection could broaden clinical utility and impact. The framework’s multi-modal integration capabilities provide a foundation for comprehensive oral health assessment beyond caries detection.
Integration with emerging imaging modalities including optical coherence tomography, photoacoustic imaging, and spectroscopic analysis could enhance diagnostic capabilities and provide additional biological information for improved clinical decision-making.
Development of predictive modeling capabilities for long-term oral health outcomes could enable personalized prevention strategies and risk-based intervention protocols. The framework’s regenerative modeling components provide a foundation for expanded predictive capabilities addressing comprehensive oral health trajectories.
Global health applications and scalability
Adaptation of the framework for resource-constrained environments through model compression, edge computing optimization, and simplified user interfaces could expand global accessibility. Development of smartphone-based implementations could enable widespread deployment in underserved populations with minimal infrastructure requirements.
Integration with telemedicine platforms could enable remote consultation and diagnostic support, particularly valuable for rural and underserved communities with limited access to pediatric dental specialists. The framework’s uncertainty quantification capabilities support remote decision-making by providing explicit confidence measures for clinical recommendations.
Development of population-level surveillance capabilities could enable public health monitoring of pediatric oral health trends and early identification of disease outbreaks or environmental health threats. The framework’s scalability and automated processing capabilities support large-scale epidemiological applications.
Implications for healthcare policy and practice
Healthcare delivery model evolution
The framework’s demonstrated efficiency gains and cost-effectiveness support healthcare policy initiatives promoting AI adoption in clinical practice. The substantial return on investment and improved patient outcomes provide evidence for insurance coverage of AI-assisted diagnostic services and technology investment by healthcare systems.
The framework’s ability to extend diagnostic capabilities to non-specialist providers could support task-shifting initiatives and expanded scope of practice for general dentists, dental hygienists, and community health workers. This capability is particularly relevant for addressing pediatric dental specialist shortages and improving access in underserved areas.
The explicit uncertainty quantification capabilities support evidence-based clinical guidelines and standardized decision-making protocols. Healthcare policy initiatives promoting algorithmic transparency and explainable AI find practical implementation through the framework’s interpretable bio-inspired components.
Medical education and training implications
Integration of AI-assisted diagnostics into clinical practice necessitates corresponding evolution in medical and dental education curricula. Training programs must address both technical aspects of AI system operation and fundamental concepts of uncertainty quantification and probabilistic decision-making.
The framework’s bio-inspired algorithmic components provide educational opportunities to integrate basic science knowledge with clinical applications, potentially enhancing understanding of both biological principles and computational methods. This integration could strengthen the scientific foundation of clinical practice and promote evidence-based decision-making.
Development of simulation-based training environments incorporating the framework’s capabilities could enhance clinical education by providing standardized, repeatable training scenarios with known outcomes and explicit performance feedback. This approach could improve training consistency and enable objective assessment of clinical competencies.
Research infrastructure and collaboration
The framework’s success demonstrates the value of interdisciplinary collaboration between clinical practitioners, computer scientists, and biomedical engineers. Future healthcare innovation may increasingly require such collaborative approaches and corresponding institutional support for cross-disciplinary research initiatives.
The multi-center validation approach employed in this study provides a model for collaborative research infrastructure that enables rapid technology validation across diverse clinical settings. Development of standardized research protocols and data sharing agreements could accelerate innovation while maintaining patient privacy and institutional autonomy.
The framework’s open-source components and published methodologies enable reproducible research and collaborative improvement by the global research community. This approach could accelerate technological advancement while ensuring broad accessibility and preventing proprietary limitations on clinical innovation.
Conclusion and clinical significance
The bio-inspired neutrosophic-enzyme intelligence framework represents a transformative advancement in pediatric dental diagnostics, achieving unprecedented performance through innovative integration of biological principles with advanced uncertainty quantification. The framework’s 97.3% diagnostic accuracy, 37.5% reduction in diagnostic time, and 34.5% cost savings demonstrate both technological excellence and practical clinical value.
The framework’s explicit uncertainty quantification addresses a critical limitation in current medical AI applications, enabling risk-stratified clinical decision-making that aligns with clinical reasoning processes. The bio-inspired algorithmic components provide interpretable diagnostic features that enhance clinician understanding and trust in AI-assisted recommendations.
The comprehensive validation across 18,432 patients from six international centers demonstrates robust generalizability and minimal bias across diverse populations. The framework’s consistent superior performance compared to conventional methods and state-of-the-art AI approaches establishes new benchmarks for medical AI applications in pediatric healthcare.
The clinical translation impact extends beyond diagnostic performance to fundamental improvements in healthcare delivery efficiency, cost-effectiveness, and patient outcomes. The framework’s demonstrated ability to improve access, reduce disparities, and enhance quality of care supports its potential for global health impact and healthcare system transformation.
Future research directions include expansion to additional clinical applications, integration with emerging technologies, and development of global health implementations. The framework’s foundation of biological principles and uncertainty quantification provides a robust platform for continued innovation and clinical advancement.
The study’s findings support broader adoption of bio-inspired AI approaches in medical applications, demonstrating the value of leveraging evolutionary optimization and biological principles for enhanced diagnostic capabilities. The framework’s success validates the potential for AI to augment rather than replace clinical expertise, providing tools that enhance human decision-making while maintaining clinical autonomy and professional judgment.
This research establishes a new paradigm for AI-assisted pediatric healthcare, providing evidence-based support for technology adoption, policy development, and educational evolution. The framework’s comprehensive approach to diagnostic uncertainty, biological inspiration, and clinical integration offers a model for future medical AI development that prioritizes clinical utility, safety, and global accessibility.
While genetic data provide valuable insights for risk stratification, their integration raises privacy, regulatory, and practical concerns. In the revised framework, genetic biomarkers are treated as optional inputs: the system maintains strong diagnostic accuracy (89–93%) when operating with only clinical and imaging modalities, ensuring feasibility in low-resource settings. To further support accessibility, we emphasize deployment strategies such as cloud-based services, mobile/edge AI units, and open-source implementations that reduce costs and infrastructure demands.
While the proposed framework demonstrates strong diagnostic performance, several limitations should be acknowledged at this stage. First, some datasets used in this study are not fully open access, which raises concerns about data licensing and may restrict reproducibility across institutions. Second, spectrum bias may exist, as the patient cohorts predominantly represent specific demographic and clinical groups, potentially affecting the generalizability to broader populations. Third, the diagnostic algorithms have been trained and validated on imaging modalities and devices available within our study; performance on unrepresented scanners or hardware platforms remains to be verified. These factors highlight the importance of cautious interpretation and motivate future studies to expand data diversity, licensing transparency, and device coverage.
Case study discussion
To illustrate the translational potential of the proposed framework, we present a representative case scenario as shown in Fig. 6. Consider a mid-sized pediatric dental clinic adopting the system for early caries detection and personalized treatment planning. Clinical and imaging data (e.g., CBCT, OCT) are processed alongside patient-specific genetic markers, enabling the framework to provide a diagnostic output with quantified uncertainty. In this scenario, the integration of bio-inspired neutrosophic operators supports decision-making by distinguishing between high-certainty and indeterminate cases, guiding clinicians toward either immediate intervention or further diagnostic testing.
From an economic standpoint, the clinic reports a cost reduction of ~ 34% due to fewer redundant imaging procedures and earlier detection of high-risk cases. The return on investment is realized in approximately nine months, aligning with our broader simulation results. Importantly, the case highlights practical considerations such as data licensing agreements, device compatibility, and staff training—factors that must be addressed for successful real-world adoption.
This case study underscores the framework’s potential impact while acknowledging the operational and regulatory hurdles that remain, bridging the gap between theoretical development and clinical application.
Fig. 6. Case Study Discussion: Application Pipeline of the Framework.
Conclusion
This research presents a groundbreaking bio-inspired neutrosophic-enzyme intelligence framework that fundamentally transforms pediatric dental disease detection and classification through innovative integration of biological principles with advanced uncertainty quantification methodologies. The comprehensive validation across 18,432 pediatric patients from six international centers demonstrates exceptional diagnostic performance with 97.3% overall accuracy, 94.7% sensitivity for incipient caries detection, and 96.2% specificity for healthy tissue identification, representing substantial improvements over conventional clinical methods (80.2% accuracy) and state-of-the-art deep learning approaches (89.4% accuracy). The framework’s five core innovations establish new paradigms for medical AI applications: neutrosophic-enhanced deep learning architecture providing explicit uncertainty quantification, enzyme-inspired catalytic feature extraction leveraging biological specificity, axolotl-inspired regenerative healing prediction enabling personalized treatment forecasting, genetic-immunological multi-objective optimization combining evolutionary principles, and integrated risk stratification incorporating multi-modal patient assessment. The clinical translation impact extends beyond diagnostic performance to fundamental healthcare delivery improvements, including 37.5% reduction in diagnostic time, 58.1% increase in patient throughput, 29.8% improvement in treatment planning accuracy, and 34.5% reduction in overall treatment costs, with demonstrated cost-effectiveness of $12,450 per quality-adjusted life year gained and 8.7-month return on investment establishing strong economic justification for clinical adoption across diverse healthcare systems. To promote transparency and reproducibility, the core algorithmic code and supplementary statistical analyses are made publicly available alongside the paper.
Limitations
While this study represents the most comprehensive validation of AI-assisted pediatric dental diagnostics to date, several limitations warrant consideration that may affect generalizability and clinical implementation. The 18-month follow-up period, though substantial for technology validation, may not capture long-term performance trends or identify rare failure modes that could emerge with extended clinical use, necessitating longer longitudinal studies to establish comprehensive safety profiles and performance stability over multi-year deployment periods. The reliance on expert clinical assessment as the reference standard introduces potential bias, as the framework’s performance is evaluated against human interpretation that itself exhibits inter-examiner variability (κ = 0.76–0.94), while the absence of histopathological validation, though ethically necessary in pediatric populations, limits the ability to establish absolute diagnostic accuracy. Despite comprehensive multi-center validation across diverse populations, certain demographic groups and geographic regions remain underrepresented, potentially limiting generalizability to populations not included in the validation cohorts, while the exclusion of patients with syndromic conditions affecting dental development limits applicability to these important patient populations. The framework’s computational requirements may limit implementation in extremely resource-constrained environments, with minimum hardware specifications representing significant capital costs for some healthcare facilities, while dependence on high-quality imaging with standardized acquisition parameters may pose challenges in non-academic clinical settings where equipment capabilities and operator training vary significantly. The requirement for complete multi-modal data for optimal performance may not be feasible in all clinical settings, with performance reduction up to 15% when using single-modality input, while the novel methodological approaches may require extended regulatory review periods and comprehensive training programs that could present barriers to widespread clinical adoption.
Future work
Future research should focus on expanding the bio-inspired algorithmic framework through investigation of additional biological principles, including cellular communication mechanisms, immunological memory systems, and neural plasticity concepts that could enhance pattern recognition and adaptive learning capabilities for pediatric dental applications. Extension of the neutrosophic uncertainty quantification to incorporate temporal dynamics and multi-scale uncertainty modeling, combined with federated learning approaches enabling collaborative model improvement across institutions while maintaining patient privacy, represents critical advancement opportunities for global deployment and continuous system enhancement. The clinical scope should be broadened to encompass comprehensive oral health assessment, including orthodontic evaluation, temporomandibular joint disorders, oral pathology detection, and integration with emerging imaging modalities such as optical coherence tomography, photoacoustic imaging, and spectroscopic analysis to provide enhanced diagnostic capabilities and biological information for improved clinical decision-making. Development of resource-optimised implementations suitable for smartphone and tablet deployment, cultural adaptation for diverse global populations, and integration with telemedicine platforms could dramatically expand accessibility in underserved areas while maintaining diagnostic quality and clinical effectiveness. Long-term longitudinal studies spanning multiple decades, the establishment of standardized evaluation protocols for regulatory approval, and the investigation of algorithmic fairness across diverse populations remain critical research priorities to ensure sustained clinical effectiveness, regulatory compliance, and equitable healthcare delivery. Integration with molecular biomarker analysis, including salivary proteomics and microbiome assessment, development of augmented reality interfaces for enhanced clinical training and patient education, and exploration of population-level surveillance capabilities for public health monitoring represent transformative opportunities for advancing pediatric oral health through intelligent technology integration that maintains focus on clinical utility, patient safety, and global accessibility. To promote transparency and feasibility, the framework is adaptable across diverse healthcare contexts, ensuring accessibility in both high- and low-resource environments.
Supplementary Information
Below is the link to the electronic supplementary material.
Supplementary Material 1
The reference list from the paper itself. Each links out to its DOI / PubMed record.
- 1World Health Organization. Oral Health Fact Sheet (WHO, 2022).
- 2Kennedy, J., Eberhart, R. & Australia, W. A. Particle swarm optimization. Proceedings of ICNN’95 - International Conference on Neural Networks, Perth, pp 1942–1948. (1995). 10.1109/ICNN.1995.488968
- 3Smarandache, F. A unifying field in logics: neutrosophic logic. Philosophy 1–141 (1999).
- 4Tirumanadham, N. K. M. K. & Thaiyalnayaki, S. Enhancing student performance prediction in E-learning environments: advanced ensemble techniques and robust feature selection. Int. J. Mod. Educ. Comput. Sci.17(2), 67-86 10.5815/ijmecs.2025.02.03 (2025).