Preoperative predictors of chronic pain after laparoendoscopic groin hernia repair: A Swedish Hernia Registry study
Bengt Novik, Gabriel Sandblom, Anders Thorell

TL;DR
This study identifies preoperative factors linked to chronic pain after hernia surgery and highlights potential selection bias in patient responses.
Contribution
The study identifies seven preoperative predictors of chronic postoperative inguinal pain after laparoendoscopic hernia repair in a large, population-based cohort.
Findings
Seven preoperative factors, including female sex, younger age, and BMI > 25, were significantly associated with chronic postoperative inguinal pain.
Response rates varied by age, with non-respondents being younger, indicating potential selection bias.
The study suggests future research should focus on preoperative pain assessment and improving response rates among younger patients.
Abstract
Chronic postoperative inguinal pain (CPIP) is a major adverse outcome of groin hernioplasty. Despite multiple CPIP studies, investigations involving unselected patients and sufficiently large cohorts to assess multiple predictors concurrently are still needed. This study evaluated the relative impact of preoperative predictors of CPIP after laparoendoscopic groin hernia repair. A secondary aim was to assess selection bias. This population-based cohort study included unilateral laparoendoscopic repairs from a prospective CPIP project within the Swedish Hernia Registry, where all groin hernia repairs recorded between September 2012 and December 2018 were surveyed at 1 year postoperatively. Responses were analyzed using multivariable logistic regression to assess whether any of 15 predetermined preoperative candidate variables, including demographics, comorbidities, and hernia-related…
Genes, proteins, chemicals, diseases, species, mutations and cell lines named across the full text — each resolved to its canonical identifier and authoritative record.
Click any figure to enlarge with its caption.
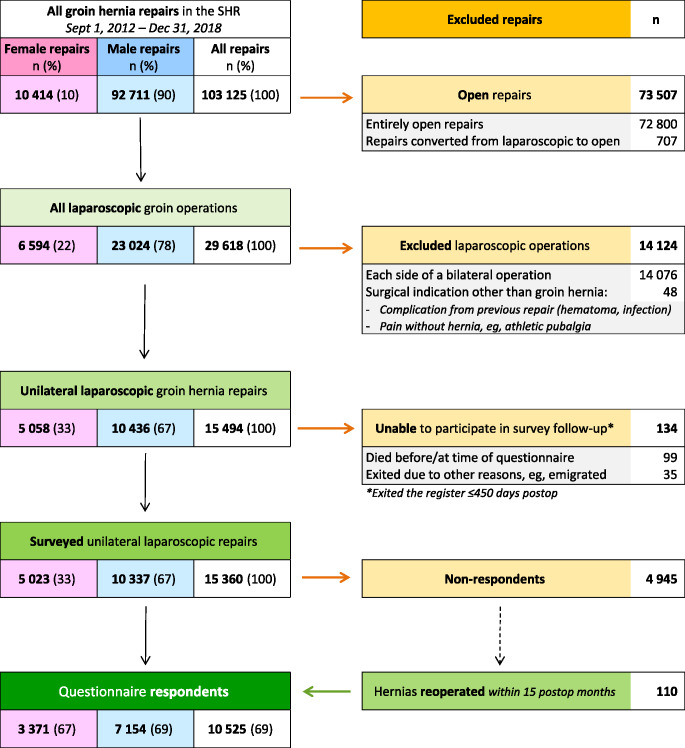 Figure 1
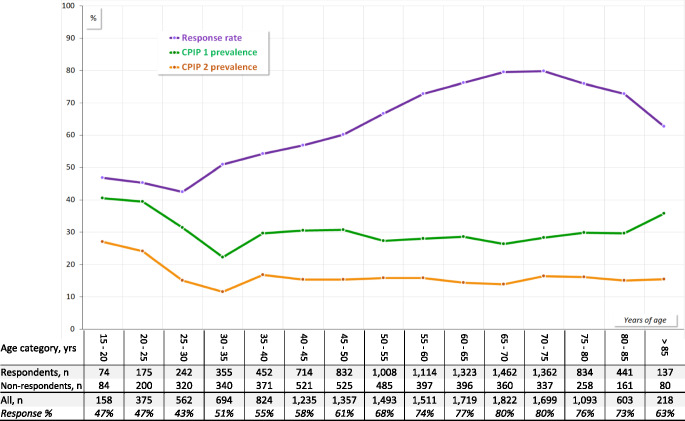 Figure 2
- —Karolinska Institute
Peer Reviews
No public reviews on file for this paper yet. If you reviewed it on a platform where reviews are public (OpenReview, ICLR, NeurIPS, ICML), you can paste yours below so the community can read it here.
Videos
No videos yet. Explain this paper in a talk, walkthrough, or lecture? Add one.
Taxonomy
TopicsHernia repair and management · Pelvic and Acetabular Injuries · Appendicitis Diagnosis and Management
Introduction
Chronic postoperative inguinal pain (CPIP) is the foremost long-term complication after groin (inguinal and femoral) hernia repair. It is typically defined as pain persisting beyond the expected healing period of 3–6 months, with reported prevalence ranging from 0.7% to over 75%, depending on the definition used, measurement tool, and follow-up duration [1–4]. Symptoms vary from mild discomfort to debilitating pain, placing a substantial burden on both patients and society, given the high volume of groin hernia repairs. Despite various treatment strategies, high-quality evidence guiding optimal CPIP management remains limited, leaving many patients with persistent suffering that can last for years [5–8].
Interventions intended to reduce CPIP risk are challenging to evaluate scientifically, for several reasons. A common concern is the poor comparability of patient-reported outcome measurement tools, including hernia-specific questionnaires [9, 10]. Another key issue, which has received less attention in the design and interpretation of CPIP research, is the lack of consensus on which effect modifiers and confounders should be recorded and adjusted for.
Laparoendoscopic methods—primarily totally extraperitoneal (TEP) and transabdominal preperitoneal (TAPP) mesh repairs—have steadily gained preference over the past 3 decades. These approaches have been associated with a lower CPIP risk than open procedures [2, 11–19]. Nevertheless, a substantial proportion of patients undergoing laparoendoscopic repair still develop CPIP [20, 21]. Thus, comprehensive studies using robust real-world data to identify CPIP predictors in laparoendoscopic surgery are warranted [22].
Previous CPIP studies—mostly focused on open repairs—have identified several preoperative factors, including preoperative pain, female sex, younger age, higher American Society of Anesthesiologists (ASA) physical status grade, elevated body mass index (BMI), recurrent hernia, femoral hernia, and small hernia defect size [2, 3, 17, 20, 23–25]. However, many of these studies were statistically underpowered or included only a limited number of candidate variables, potentially resulting in imprecise multivariable adjustment or inflated risk estimates. The relative contributions of multiple preoperative risk factors remain unclear. Moreover, potential sources and effects of bias have rarely been adequately addressed.
The aim of this study was to identify and quantify preoperative predictors for CPIP 1 year after unilateral laparoendoscopic hernia repair. To this end, we investigated a broad set of potential risk factors, using over 6 years of detailed data from the Swedish Hernia Registry (SHR). Potential sources of bias and uncertainty were also critically assessed.
Methods
The study was approved by the Regional Ethics Review Board in Stockholm, Sweden (EPN 2008/1082-31/2; amendments EPN 2014/2176-32 and EPN 2018/2050-32), and is registered at ClinicalTrials.gov (ID: NCT04838028). It adheres to the Strengthening the Reporting of Observational Studies in Epidemiology (STROBE) guidelines and the REporting of studies Conducted using Observational Routinely-collected health Data (RECORD) extension [26, 27].
Study design and setting
Swedish healthcare is primarily tax-funded, with negligible patient co-payment, ensuring that surgery is accessible to virtually all residents.
This nationwide study included a consecutive, unselected cohort of patients who underwent laparoendoscopic groin hernia repairs over 76 months (> 6 years). Data were obtained from the SHR, a government-funded, non-profit registry that captures more than 95% of all groin hernia repairs in Sweden. The SHR provides systematic, continuously updated follow-up, refreshed weekly, until death, emigration, or patient opt-out [28]. Detailed descriptions of SHR data collection and validation processes have been published previously [29–33].
Cohort
The study was based on a prospective follow-up project that included all groin hernia repairs registered in the SHR between September 1, 2012, and December 31, 2018. All surviving patients were invited to complete a brief, patient-reported outcome questionnaire 1 year postoperatively [34]. To assess CPIP, it included the first item of the validated Short-form Inguinal Pain Questionnaire (sf-IPQ) [35]. Nearly all returned questionnaires were received by the SHR 12–15 months postoperatively.
This analysis used a comprehensive SHR dataset containing detailed patient and surgical information from September 1, 2012, with follow-up data (questionnaire responses and reoperations) through November 6, 2020. Patients who underwent bilateral repairs were excluded, as the single questionnaire did not distinguish between left- and right-sided pain. Consequently, only unilateral repairs were included.
Variables
The study endpoint, CPIP, was based on the patient’s reported maximum pain in the operated groin during the preceding week [35]. The 7-point Likert scale was dichotomized to classify outcomes as CPIP-positive or CPIP-negative (Table 1). A broader definition (CPIP-1) was used for the primary outcome to maximize statistical power, while a narrower definition (CPIP-2) served for sensitivity analysis.
Table 1. The first item of the Short-Form inguinal pain questionnaire (sf-IPQ)Rate the worst pain you have felt in the operated groin during the recent week:1.No pain2.Pain, could easily be ignored3.Pain, could not be ignored, but did not affect daily activities4.Pain, could not be ignored and interfered with concentration on chores/activities5.Pain, prevented most activities6.Pain, required bed rest7.Pain, prompted seeking immediate medical helpPrimary outcome (CPIP-1) = Levels 3–7Secondary outcome (CPIP-2) = Levels 4–7
Primary outcome (CPIP-1)
The primary outcome defined CPIP as any of the 5 highest pain levels on the sf-IPQ, starting with “Pain that could not be ignored but did not affect daily activities,” in line with some prior studies [30, 36–39]. The 2 lowest levels—“No pain” and “Pain,* could easily be ignored*”—were classified as CPIP-negative.
Additionally, patients who underwent reoperation within 15 months postoperatively were classified as CPIP-positive. This period comprised the postoperative interval during which most questionnaires were returned. This pragmatic decision assumed that virtually all such reoperations, including those for recurrence, were performed for painful conditions, thereby reducing underestimation of CPIP. It also addressed cases where questionnaires completed after a second operation failed to capture the index repair outcome. While this strategy may slightly overestimate CPIP incidence, we considered overestimation preferable to underestimation, given that most groin hernia patients experience some degree of preoperative pain [40].
Respondents were defined as patients who either completed the questionnaire and/or underwent new ipsilateral repair within 15 months. All others were classified as non-respondents. Patients reoperated for early complications (e.g., hematoma or infection) not requiring new hernioplasty were excluded due to insufficient procedural detail.
Secondary outcome (CPIP-2)
The secondary outcome used a stricter CPIP definition, requiring pain that at least “interfered with concentration on chores/activities.” Reoperations were disregarded in this definition. This narrower criterion aligns with most previous studies using the same sf-IPQ item [17, 30, 34, 41–44]. The two CPIP definitions were compared in a sensitivity analysis to assess the robustness of the findings.
Predictors of CPIP
Eighteen—15 preoperative and 3 intraoperative—candidate variables were evaluated as potential predictors (Tables 2 and 3).
Sex was treated as a binary biological variable. Age and BMI were recorded as continuous variables but categorized post hoc to enhance analysis and interpretation. Smoking was defined as current use at the time of surgery, including temporary perioperative abstinence. Comorbidities were not mandatory SHR fields and were Likely underreported. Bleeding diathesis and immunosuppression included both pathological and iatrogenic causes. Emergency repair was defined as surgery performed within 24 h of seeking acute care. Hernia anatomy and defect size were categorized according to the European Hernia Society (EHS) classification [3, 45].
In addition, 3 intraoperative variables were evaluated: repair type (TEP vs. TAPP), surgeon level, and surgical center.
Data access and cleaning
The first author (BN) retrieved a complete, unrestricted, and unfiltered dataset from the SHR, including all recorded repairs and variables without prior selection or filtering. The data were manually reviewed for inconsistencies and implausible entries. Obvious errors were corrected when the true value could be confidently inferred; otherwise, values were recoded as missing.
Statistical methods
Independent samples t-tests were used to compare baseline variables between respondents and non-respondents. For these comparisons, categorical variables with more than 2 levels were dichotomized.
The main analysis of CPIP risk factors employed multivariable logistic regression to estimate adjusted odds ratios (AORs) with 2-tailed 95% confidence intervals. All 18 candidate predicting variables were initially included, and backward stepwise selection was used to refine the model, retaining variables with P < 0.10. In the subsequent final model, statistical significance was set at P < 0.05.
Calculations were conducted using IBM^®^ SPSS^®^ Statistics, version 28 (IBM, Armonk, New York, USA).
Results
Participants and CPIP prevalence
During the inclusion period, the SHR recorded more than 100 000 hernia repairs in 87 668 patients [35].
Figure 1 shows the subsequent exclusions and the remaining cohort, stratified by sex. In almost all cases, the questionnaires returned were received by the SHR within 15 months.
A total of 82 centers contributed at least 1 repair that met the inclusion criteria, yielding 15 360 patients eligible for this study. Among these, 110 non-respondents who underwent subsequent ipsilateral repair within 15 months of surgery were reclassified as CPIP-positive respondents per study protocol and included in the main analysis. Including them, 10,525 (69%) were classified as questionnaire respondents and qualified for CPIP analysis.
Tables 2 and 3 compare the demographic and clinical features of respondents and non-respondents. Response rates varied significantly across 11 patient and surgical characteristics. Women, younger patients, those otherwise healthy (ASA 1), and smokers were less likely to respond. Lower response rates were also observed among patients who had primary repairs, emergency procedures, femoral hernias, small hernia defects, or treatment at low-volume surgical centers.
Fig. 1. Flowchart of included and excluded repairs
Table 2. Baseline patient characteristics, with respondent vs. non-respondent comparison All patientsRespondentsNon-respondentsVariableCategory N (%) N (%) N (%) P
All
15 360 (100)10 525(69)4 835(31) SexMale10 337(67)7 154(68)3 183(66)Female5 023(33)3 371(32)1 652(34) 0.009 Age (years)Range, min ─ max15 ─ 9515 ─ 9415 ─ 95Mean (SD)56.7 (16.2)58.9 (15.1)51.6 (17.2)< 0.001BMI (kg/m^2^)Range, min ─ max14.5 ─ 60.514.9 ─ 60.514.5 ─ 54.6Mean (SD)24.8 (3.4)24.8 (3.2)25.0 (3.6) 0.001 ASA gradeASA 18 271(54)5 498(52)2 773(57)ASA 2–47 089(46)5 027(48)2 062(43)<** 0.00**1 SmokingNo9 146(95)6 095(96)3 051(93)Yes452(5)238(4)214(7)< 0.001 Missing data
5 762
4 192
1 570 Diabetes mellitusNo9 311(97)6 132(97)3 179(97)Yes288(3.0)202(3.2)86(2.6)0.12 Missing data
5 761
4 191
1 570 Collagen disorderNo9 556(99.6)6 304(99.5)3 252(99.6)Yes43(0.4)30(0.5)13(0.4)0.59 Missing data
5 761
4 191
1 570 COPD/asthmaNo9 221(96)6 095(96)3 126(96)Yes378(3.9)239(3.8)139(4.4)0.26 Missing data
5 761
4 191
1 570 Bleeding diathesisNo9 172(96)6 034(95)3 138(96)Yes427(4.4)300(4.7)127(3.9) 0.050
Missing data
5 761
4 191
1 570 Immuno-suppressionNo9 489(99)6 258(99)3 231(99)Yes110(1.1)76(1.2)34(1.0)0.48 Missing data
5 761
4 191
1 570 In parentheses are percentages, except for Age and BMI where SD = standard deviationBMI = Body mass indexASA = American Society of AnesthesiologistsCOPD = Chronic obstructive pulmonary diseaseP-values (2-tailed, α = 0.05) regard the difference in distribution between respondents and non-respondents within each variable categoryMissing data were excluded from each significance analysis
Table 3. Baseline hernia and surgery data, with respondent vs. non-respondent comparisonAll patientsRespondentsNon-respondentsVariableCategory N (%) N (%) N (%) P All15 360(100)10 525(69)4 835(31) Indication Primary hernia12 036(78)8 122(77)3 914(81)Recurrent hernia3 324(22)2 403(23)921(19)< 0.001 UrgencyElective repair14 966(97)10 287(98)4 679(97)Emergency394(2.6)238(2.3)156(3.2)< 0.001 LateralityRight groin8 950(58)6 146(58)2 804(58)Left groin6 410(42)4 379(42)2 031(42)0.64 Hernia anatomy (EHS classification)Inguinal13 691(93)9 451(93)4 240(91)Femoral only1 078(7)676(7)401(9)<** 0.00**1 Other/Unspecified
592
398
194 Hernia defect size (EHS classification)I (small)4 289(28)2 783(26)1 506(31)II/III (medium/large)11 063(72)7 734(74)3 329(69)<** 0.001**Missing data880 Type of repairTEP12 884(84)8 864(85)4 020(84)TAPP2 372(16)1 589(15)783(16)0.085 Other/Unspecified
104
72
32 Surgeon levelResident401(2.7)282(2.7)119(2.5)Certified surgeon14 627(97)10 073(97)4 554(97)0.53 Missing data
332
170
162 Surgical centerHigh volume11 315(74)7 900(75)3 415(71)Low volume4 045(26)2 625(25)1 420(29)<** 0.001**EHS = European Hernia Society. Inguinal = Lateral and/or MedialDefect size (Ø): I < 1.5 cm); II = 1.5–3 cm; III > 3 cmTEP = Totally extra-peritoneal repair. TAPP = Trans-abdominal preperitoneal repairSurgical center: High volume = A center that conducted > 200 laparoendoscopic groin hernia repairs during the inclusion period, also comprising those—mainly bilateral—that were excluded in this study. Low volume = All other centersP-values (2-tailed, α = 0.05) regard the difference in distribution between responders and non-responders within each variable categoryMissing data were excluded from the significance analyses
Figure 2 illustrates age-related response variability (top curve), and CPIP prevalence using both definitions: 3 027 of 10 525 (29%) for the primary definition (middle curve), and 1 614 of 10 415 (15%) for the secondary definition (bottom curve).Fig. 2. Response rate and CPIP prevalences, by age category. Overall questionnaire response rate = 68%. CPIP = Chronic postoperative inguinal pain prevalence at 1 year. CPIP-1 (primary definition) overall prevalence = 29%. CPIP-2 (secondary definition) overall prevalence = 15%
Main analysis
An initial stepwise selection process eliminated 8 preoperative variables (smoking, diabetes, chronic obstructive pulmonary disease/asthma, bleeding diathesis, immunosuppression, collagen disorder, urgency, and groin side), and 1 intraoperative variable (surgeon level), none of which met the P < 0.10 inclusion threshold (Table 4).
Table 4. Insignificant CPIP predictor candidates, stepwise eliminatedVariableCategory N %AOR95% CI P All survey respondents 10 525 (100%)Bleeding diathesisNo bleeding diathesis6 034(95%) 1 ReferenceBleeding diathesis300(5%) 1.1 0.87 ─ 1.50.38 Sum 6 334 (61%)Immuno- suppressionNo immuno-suppression6 258(99%) 1 ReferenceImmuno-suppression76(1%) 0.90 0.54 ─ 1.50.67 Sum 6 334 (61%)Collagen diseaseNo collagen disease6 304(99,5%) 1 ReferenceCollagen disease30(0,5%) 1.1 0.50 ─ 2.30.86 Sum 6 334 (60%)COPD/asthmaNo COPD/asthma6 095(96%) 1 ReferenceCOPD/asthma239(4%) 1.0 0.78 ─ 1.40.77 Sum 6 334 (60%)Diabetes mellitusNo diabetes6 132(97%) 1 ReferenceDiabetes202(3%) 0.79 0.57 ─ 1.10.16 Sum 6 334 (60%)SmokingNo smoker6 095(96%) 1 ReferenceSmoker238(4%) 1.2 0.90 ─ 1.60.21 Sum 6 333 (60%)LateralityRight groin6 146(58%) 1 ReferenceLeft groin4 379(42%) 1.0 0.93 ─ 1.10.72 Sum 10 525 (100%)EmergencyElective10 287(98%) 1 ReferenceEmergency238((2%) 1.2 0.89 ─ 1.60.24 Sum 10 525 (100%)Surgeon levelResident282(3%) 1 ReferenceCertified surgeon10 073(97%) 0.85 0.65 ─ 1.10.20 Sum 10 355 (98%)CPIP = Chronic postoperative inguinal painAOR = adjusted odds ratio of experiencing CPIP, and/or having been reoperated at 15 months postop.COPD = chronic obstructive pulmonary disease.
The final model included 7 preoperative and 2 intraoperative risk factors (Table 5).
Female sex was associated with modestly increased risk.
Table 5. Main analysis: Proportionate risks of chronic inguinal pain at 1 year postoperativelyVariableCategory N (%)AOR95% CI P SexMale7 154(68) 1 referenceFemale3 371(32) 1.15 1.03 ─ 1.28 0.010 Age (years)15–30491(4.7) 1.94 1.54 ─ 2.44<** 0.00130–451 521(14) 1.28 1.08 ─ 1.52 0.004 45–551 840(17) 1.25 1.07 ─ 1.47 0.006 55–652 437(23) 1.17 1.01 ─ 1.36 0.034 65–701 462(14) 1 reference70–751 362(13) 1.06 0.90 ─ 1.260.48> 751 412(13) 1.11 0.94 ─ 1.310.24BMI (kg/m^2^)< 20500(4.8) 1.14 0.92 ─ 1.390.2320–255 255(50) 1 reference25–303 757(36) 1.36 1.24 ─ 1.50< 0.00130–35508(4.8) 1.57 1.29 ─ 1.90< 0.001**> 3566(0.6) 1.86 1.13 ─ 3.07 0.015
Missing value
439
(4.2) ASA gradeASA 15 498(52) 1 referenceASA 24 266(41) 1.19 1.07 ─ 1.31<** 0.001ASA 3750(7.1) 1.51 1.26 ─ 1.81< 0.001**ASA 411(0.1) 2.49 0.75 ─ 8.290.14IndicationPrimary hernia8 122(77) 1 referenceRecurrent hernia2 403(23) 1.33 1.19 ─ 1.49< 0.001Hernia anatomy (EHS classification)Inguinal^a^9 451(90) 1 referenceFemoral676(6.4) 1.20 1.002 ─ 1.43 0.047 Femoral combinations^b^327(3.1) 1.16 0.91 ─ 1.480.23 Other/Unspecified
71
(0.7) Hernia defect size (EHS classification)^c^I – small Ø2 783(26) 1.18 1.06 ─ 1.31 0.002 II/III – medium or large Ø7 734(73) 1 referenceMissing value8(0.1)Repair methodTEP8 864(84) 1 referenceTAPP1 589(15) 1.16 1.03 ─ 1.31 0.012
Other/Unspecified
72
(0.7) Surgical centerAll 82 centers10 525(100) 1.004 1.001 ─ 1.007 0.008 AOR Multivariable adjusted odds ratioBMI =Body mass index. ASA = American Society of Anesthesiologists. EHS = European Hernia Society^a^Inguinal: Lateral, Medial, or Lateral + Medial^b^Femoral combinations: Lateral + Femoral, Medial + Femoral, or Lateral + Medial + Femoral^c^Hernia defect size: I < 1.5 cm; II = 1.5–3 cm; III > 3 cmTEP = Totally extra-peritoneal repair. TAPP = Trans-abdominal preperitoneal repair
Age, treated as a continuous variable, showed a weak inverse correlation with likelihood of CPIP (AOR 0.990, CI 0.988–0.993; P < 0.001). Due to non-linearity, age was analyzed post hoc in categories. Compared to patients 65 years or older, those younger than 45 years (AOR 1.36, CI 1.25–1.49, P < 0.001), and 45–64 years (AOR 1.34, CI 1.08–1.65, P = 0.008), were associated with higher CPIP risk. For more detailed analysis, the final model comprised 7 discrete age categories (Table 5).
Higher ASA grade and increasing BMI above normal weight (> 25 kg/m^2^), were each associated with progressively higher CPIP risks.
Recurrence repairs comprised 3 324 (22%) of the index procedures and were linked to an increased CPIP risk. Some may argue that including recurrent repairs would confound the results, and thereby disturb interpretation. To address this, we added a Supplementary Table where the outcomes are stratified by primary vs. recurrent repairs, demonstrating only minor differences in AORs (except for categories with very low numbers).
Given the similar risks associated with lateral (AOR 1.01, CI 0.91–1.13) and combined medial-lateral hernias (AOR 0.99, CI 0.80–1.22), these categories were merged with medial hernias as the reference group. Using this combined group as the reference, femoral hernias were associated with elevated risk.
Similarly, medium-size (EHS II) defects (AOR 0.99, CI 0.86–1.13) and large (EHS III) defects had comparable risk and were therefore merged for analysis. In comparison, small (EHS I) defects were associated with an increased CPIP risk.
Sensitivity analysis
Applying the stricter CPIP-2 definition (secondary outcome) reduced the overall prevalence by nearly half, attenuating statistical power. Nonetheless, the relative risk pattern remained consistent, as illustrated in Table 6 and the lower two curves of Fig. 2. No major discrepancies were observed between the main and sensitivity analyses.
Table 6. Sensitivity analysis: secondary outcome (CPIP-2) versus primary outcome (CPIP-1)CPIP-2CPIP-1CPIP-2 vs. CPIP-1VariableCategory N %AOR 295% CI P AOR 1AOR 2
- divided by* AOR 1AOR 2 minusAOR 1SexMale7 06468% 1 referenceFemale3 35132% 1.14 0.997─1.300.055 1.15 1.00.0Age (years)15–304835% 1.91 1.44─2.54< 0.001
1.95 1.00.030–451 50214% 1.27 1.02─1.57 0.034
1.29 1.00.045–551 81317% 1.29 1.05─1.58 0.015
1.25 1.00.055–652 41023% 1.18 0.975─1.420.090 1.17 1.00.065–701 44914% 1 reference70–751 35513% 1.16 0.94─1.430.16 1.06 1.10.1> 751 40313% 1.03 0.83─1.270.80 1.11 0.9−0.1BMI (kg/m^2^)< 204955% 1.27 0.99─1.630.055 1.13 1.10.120–255 22550% 1 reference25–303 70236% 1.25 1.11─1.41<** 0.001** 1.36 0.9−0.130–354995% 1.52 1.20─1.92< 0.001 1.57 1.0−0.1> 35650.6% 1.62 0.91─2.870.10 1.86 0.9−0.2 Missing value 4294% 1.33
1.35 1.00.0ASA gradeASA 15 43652% 1 referenceASA 24 22341% 1.24 1.09─1.41< 0.001 1.19 1.00.1ASA 37457% 1.71 1.38─2.12< 0.001 1.51 1.10.2ASA 4110.1% 2.50 0.65─9.580.18 2.42 1.00.1 IndicationPrimary hernia 8 05377% 1 referenceRecurrent hernia 2 36223% 1.25 1.09─1.44 0.001
1.32 0.9−0.1Hernia anatomyMedial and/or Lateral2 66226% 1 referenceFemoral6726% 1.15 0.92─1.430.21 1.20 1.00.0Femoral combinations2052% 1.30 0.98─1.740.072 1.16 1.10.1 Other or Missing value
69
0.7%
2.11 1.24─3.58 0.006
1.96 1.10.1Hernia defect ØEHS I: < 1.5 cm2 75826% 1.26 1.11─1.42< 0.001 1.18 1.10.1EHS II-III: ≥ 1.5 cm7 64973% 1 reference Missing value 80.1% 1.54
1.21 1.30.3Surgical methodTEP8 76684% 1 referenceTAPP1 58015% 1.13 0.98─1.310.092 1.16 1.00.0 Other or Unspecified
69
0.7%
1.34
1.16
1.2
0.2 Surgical center10 415100% 1.002 0.998─1.0050.38 1.004 1.00.0AOR 2 = Adjusted odds ratio of CPIP 2 (secondary outcome)AOR 1 = Adjusted odds ratio of CPIP 1 (primary outcome)EHS = European Hernia Society
Discussion
This is the largest study to date on preoperative predictors of CPIP following consecutive, unselected, unilateral laparoendoscopic groin hernia repairs, with surgeons also unselected and without influence on follow-up. The use of an extensive, population-based cohort enhanced statistical power, improved precision, and strengthened generalizability. We analyzed data from 15 360 unilateral laparoendoscopic groin hernia repairs recorded in the SHR over a period exceeding 6 years. The postoperative survey after 1 year reached a 69% response rate.
Three key findings emerged. First, 7 preoperative predictors independently associated with CPIP: female sex, younger age, ASA > 1, increasing BMI above normal, recurrence repair, femoral hernia, and small hernia defects. Second, despite the broad primary CPIP definition, sensitivity analysis using a stricter threshold yielded consistent odds ratios, indicating that risk estimates remain stable across different definitions. Third, response rates varied significantly across most variables—especially age—implying potential non-response bias, an issue rarely addressed in prior studies.
The identified risk factors align with previous CPIP studies— primarily on open repairs—while refining risk assessment by quantifying the multivariable-adjusted contribution of each risk factor in the context of laparoendoscopic repair. Our findings suggest that preoperative CPIP predictors are largely consistent across surgical approaches.
Strengths
The SHR, alongside the Danish Hernia Database, are worldwide the only registries of groin hernia repair with true nationwide coverage and lifelong individual follow-up, minimizing selection and attrition bias [31]. Sweden’s healthcare system ensures all residents have access to hernia repair, allowing the SHR data to reflect the entire adult population. The cohort analyzed comprised at least 95% of all unilateral laparoendoscopic groin hernia repairs performed in Sweden during the inclusion period. Annual validation of SHR data mitigates misclassification and supports internal validity [28]. The use of a validated patient-reported outcome measure, a fixed 1-year follow-up, and high response rate further enhance the robustness and generalizability of the results. A major advantage in this study was that the questionnaires were mailed, collected, registered, and assessed independently of the surgical centers. This minimized observer and input bias, thereby enhancing validity [31]. Additionally, the retrieved study database underwent thorough scrutiny to minimize data entry errors.
Limitations
Despite these advantages, selection bias cannot be entirely excluded. The overall response rate (69%) was higher than in comparable registry-based studies [24, 38]. Yet, non-response bias remains a concern. Response rates varied across most variables. Younger and very elderly patients, women, those with higher BMI, and ASA 1, smokers, primary hernia, emergency repair, femoral hernia, and small (EHS I) defects were less likely to respond. While age- and sex-related response biases have been noted in a few previous studies, they are often only briefly mentioned [46, 47]. In a prior SHR study based on a different subset of the same larger cohort from which the present sample was drawn, telephone interviews with a random test sample of 119/8 005 (1.5%) non-respondents revealed a sixfold lower CPIP prevalence compared to respondents [34]. If generalizable, this suggests that both the present and previously reported risk estimates in, e.g., younger patients, may be exaggerated.
Although we adjusted for multiple covariates, some potentially relevant predictors—such as preoperative pain, socioeconomic status, and psychiatric history—were not recorded in the SHR during the study period [5, 12, 48]. While these factors may influence CPIP risk, they are unlikely to systematically vary across the included 18 variables in a way that would materially alter the findings.
It is important to differentiate selection bias inherent to study design from the clinical selection that occurs in routine practice. This distinction is particularly relevant when interpreting results related to preoperative groin pain, BMI, and ASA. Preoperative groin pain, a known risk factor for CPIP, is also a primary indication for hernia repair [2, 3, 5, 12, 40, 46, 49]. While hernia surgery aims to alleviate discomfort, it may not always accomplish that and can sometimes even inflict new pain [50]. Because preoperative symptoms were not recorded, distinguishing between pre-existing and surgery-induced pain was not feasible [51]. However, we presume that preoperative pain prevalence was evenly distributed across most subgroups, and therefore minimally impacted the estimated AORs, except for categories where the level of preoperative pain could have been a major determinant when selecting patients for surgery. Since groin hernias are rarely incapacitating or life-threatening, surgical indications are typically relative and based on shared decision-making. For example, obese or frail individuals face increased anesthetic and surgical risks [52–55]. Among such patients, physicians may be more likely to recommend conservative management for those with negligible discomfort and offer surgery to those with more intense pain [3, 50]. Consequently, CPIP estimates for overweight, obese, and high-ASA patients may potentially be overestimated in non-randomized studies, warranting cautious interpretation of CPIP risk in these categories.
In contrast to many healthcare systems where residence, ethnicity, or socioeconomic status influence access to surgical care, Sweden’s universal healthcare minimizes such disparities. Accordingly, these variables are unlikely to confound the findings, and are not collected in the SHR.
Assessed variables
The seemingly high CPIP prevalence in this study should not be interpreted as inherent to the laparoendoscopic approach but rather reflects the chosen CPIP definition and its purpose. Multivariable models with numerous predictors can result in small subgroups and an increased risk of type II errors. To maximize power, we used a broad CPIP definition, yielding a 29% prevalence at 1 year. While about half of these cases involved fairly mild pain (IPQ level 3), the primary focus was not on prevalence but on relative differences in risk, expressed as odds ratios. Sensitivity analysis using a stricter CPIP definition confirmed the robustness of these risk estimates, although confidence intervals widened due to reduced statistical power.
The results confirm previous observations that women are at higher CPIP risk, extending this finding to laparoendoscopic repair [12, 17, 30]. This aligns with modern pain research, which highlights sex-related biological differences in pain perception. Historically, medical and biological research has been male-centric—focusing on male cells, animals, and humans— leaving female pain mechanisms underexplored. However, contemporary studies have established that female sex per se is an independent risk factor for chronic pain in general, likely due to genetic and biological influences [56, 57]. In this context, the modest increase in CPIP risk among women (AOR 1.15) is perhaps within or even below expected ranges, and not implying inferior surgical care.
The finding that younger age was associated with higher CPIP risk corroborates several previous studies [2, 3, 12, 20, 24, 25, 30, 46]. However, age also influenced response rates, potentially confounding the results—an issue rarely addressed in CPIP research. In contrast, a Dutch TEP study with near-complete follow-up at 1 year found no significant CPIP difference between young (18–30 years) vs. older (≥ 31 years) patients [49]. Moreover, we used an IPQ item, which—like many patient-reported outcome measures—assesses pain severity by using limitations in physical activity as proxy. Aasvang and Kehlet hypothesized that interpretations of “daily activities” vary by age. Younger individuals, engaging in more strenuous activities, may experience greater functional impairment from equivalent pain [2]. The above reflections imply a need for cautious interpretation of CPIP risk in younger populations.
The strong positive association between higher BMI and CPIP is consistent with previous research [20, 24, 25, 30]. How BMI affects CPIP risk may be multi-factorial. Adiposity increases surgical complexity and chances of complications [53–55]. Reasonably, an elevated CPIP risk follows. Conversely, patient selection may exaggerate the CPIP risk in overweight and obese individuals. Despite a higher hernia and recurrence risk, obese individuals are under-represented among surgical patients [58]. Excess subcutaneous inguinal fat can obscure symptoms and delay diagnosis of hernia [53, 54]. In addition, surgeons may be more reluctant to recommend repair for obese individuals with mild symptoms, due to the added surgical challenge [53]. Consequently, obese patients who undergo surgery likely have more severe preoperative symptoms on average than their non-operated counterparts, which introduces confounding by indication.
The high percentage (22%) of index repairs being recurrent reflects international guidelines recommending laparoscopic reoperation after open repair [3]. Recurrent repairs were associated with increased CPIP risk, which is reasonable and consistent with previous studies [2, 5, 25, 46].
Finally, small defects (EHS I) were associated with higher CPIP risk, mirroring reports from the Herniamed registry [20, 24]. However, patients with small hernias are more likely to undergo surgery if they experience pain, whereas those with minimal or no discomfort may not seek medical attention until the defect enlarges to an EHS II or III [50]. This selection effect may, at least partially, explain the observed association
Although surgical method and center volume influenced CPIP risk, these variables were primarily included to optimize model adjustment and are therefore beyond the scope of this discussion.
Conclusions
In this large nationwide cohort, 7 key preoperative predictors of CPIP after laparoscopic unilateral groin hernia repair were identified and their relative impact quantified. The study also highlights selection bias as a major but under-recognized challenge in CPIP research. These real-world data may help refine future study protocols and improve outcome interpretation.
Although most of the identified predictors cannot be modified, the findings may enhance individualized patient counseling by helping to identify and prepare patients at increased CPIP risk.
Future studies should incorporate strategies to mitigate selection bias, including preoperative pain assessment, efforts to improve response rates among younger patients, and robust non-respondent analyses.
The findings from this study will inform the next phase of our research evaluating CPIP risks according to various mesh and fixation combinations.
Electronic supplementary material
Below is the link to the electronic supplementary material.Supplementary file 1 (PDF 208KB)