Decitabine suppresses tumor growth by activating mouse mammary tumor virus and interferon-β pathways
Ryan Johnson, Andrew Brola, Cade Wycoff, William Wycoff, Seth Neumeyer, Richard Tuttle, Sarah Light, Jiayi Li, Stephen Christensen, Yingguang Liu

TL;DR
Decitabine fights tumors by activating MMTV and IFN-β pathways, which mimic viral responses and boost the immune system.
Contribution
Demonstrates in vivo roles of MMTV and IFN-β in DAC's antitumor effects and their reciprocal regulation.
Findings
DAC treatment suppressed tumor growth and metastasis in murine models.
MMTV and IFN-β are functionally required for DAC's antineoplastic effects.
DAC upregulates IRF7, but its effect diminishes with prolonged treatment.
Abstract
Decitabine (DAC), a DNA methyltransferase inhibitor (DNMTi), is clinically effective in hematological malignancies such as myelodysplastic syndrome and acute myeloid leukemia, but its precise antineoplastic mechanisms remain incompletely understood. Beyond promoter demethylation, DAC is known to activate endogenous retroviruses (ERVs) and trigger type I interferon (IFN-I) responses, a phenomenon known as viral mimicry. The aim of this study was to investigate the roles of the mouse mammary tumor virus (MMTV) and interferon-β (IFN-β) in DAC-mediated tumor suppression. We employed two murine tumor models—4T1 mammary carcinoma and MC38 colon adenocarcinoma—in syngeneic immunocompetent mice, immunodeficient nude mice, and in vitro cultures. RNA and protein expression were assessed by quantitative PCR and immunoblotting, while functional contributions of MMTV and IFN-β were tested using…
Genes, proteins, chemicals, diseases, species, mutations and cell lines named across the full text — each resolved to its canonical identifier and authoritative record.
Click any figure to enlarge with its caption.
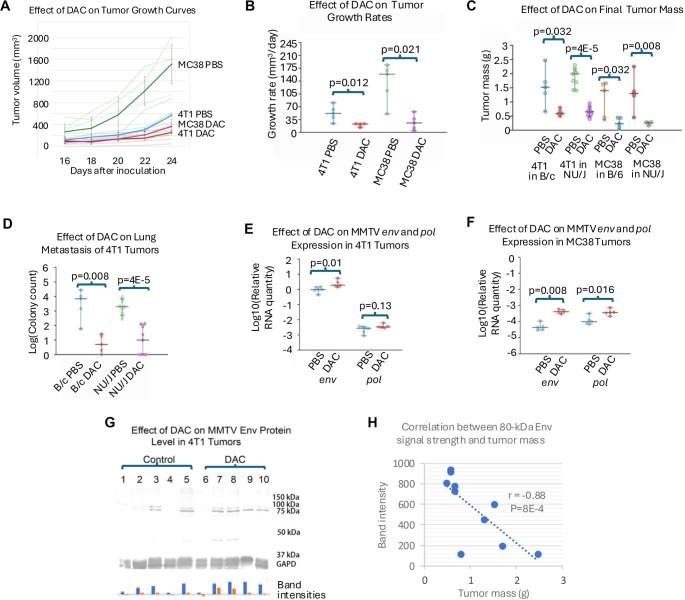 Figure 1
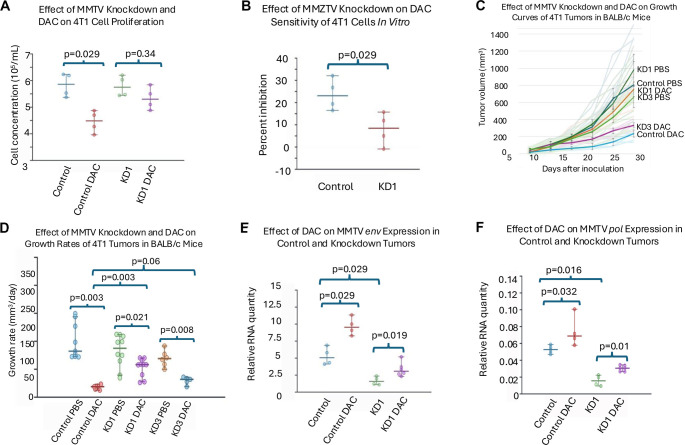 Figure 2
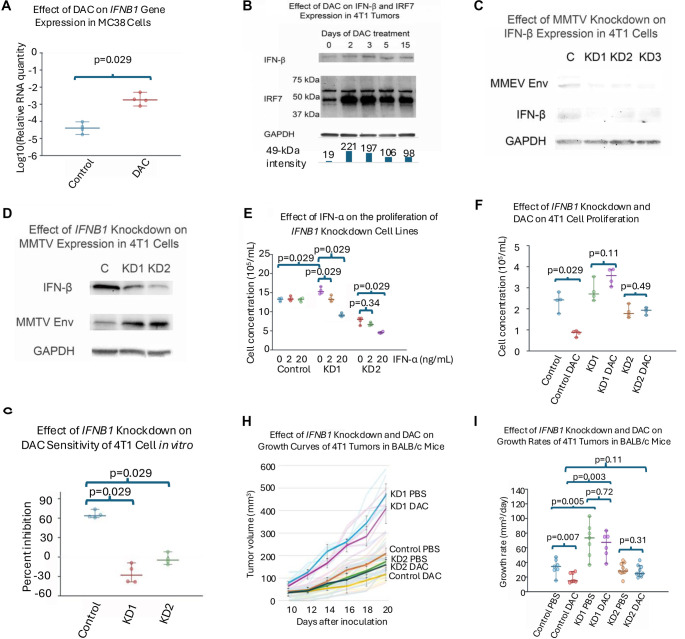 Figure 3
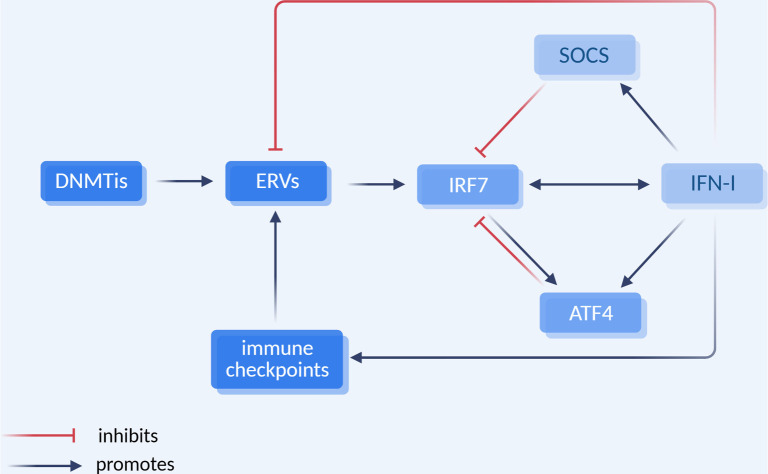 Figure 4
|
|
|
|
|---|---|---|
| MMTV KD1 | 81.6 | 83 |
| MMTV KD3 | 76 | 69.8 |
| 79.4 | 69.1 | |
| 84.7 | 80.1 |
|
|
|
|---|---|
| 2A for DAC treatment of control samples | 0.94 |
| 2A for DAC treatment of KD1 samples | 0.27 |
| 2B for percent inhibition difference | 0.71 |
| 3E for control and KD1 cell growth | 1 |
| 3E for IFN-α on KD1 at 2 ng/mL | 0.91 |
| 3E for IFN-α on KD1 at 20 ng/mL | 1 |
| 3E for IFN-α on KD2 at 2 ng/mL | 0.34 |
| 3E for IFN-α on KD12 at 20 ng/mL | 0.99 |
| 3F for DAC treatment of control samples | 0.9 |
| 3G for percent inhibition differences | 1 |
Peer Reviews
No public reviews on file for this paper yet. If you reviewed it on a platform where reviews are public (OpenReview, ICLR, NeurIPS, ICML), you can paste yours below so the community can read it here.
Videos
No videos yet. Explain this paper in a talk, walkthrough, or lecture? Add one.
Taxonomy
TopicsCalcium signaling and nucleotide metabolism
Introduction
DNA methyltransferase inhibitors (DNMTis), such as azacitidine (AZA) and decitabine (DAC), are effective treatments for specific hematological malignancies, including myelodysplastic syndrome (MDS) and acute myeloid leukemia (AML). Despite their clinical efficacy, the mechanisms underlying their action are not fully understood. Although these drugs are known to alter the expression of numerous genes by demethylating their promoters [1, 2], studies have not identified any drug-specific DNA methylation patterns or canonical target genes modified by DAC in AML cells [3]. Evidence suggests that hypomethylation may reactivate tumor-suppressor genes and induce apoptosis; however, the precise mechanisms by which DNMTis exert their effects in patients remain poorly defined [4, 5].
Beyond the direct effects of DNA hypomethylation on cell proliferation and apoptosis, DNMTis are known to modulate the immune environment in cancer patients and tumor-bearing mice [6]. Specifically, DAC has been demonstrated to suppress the expansion and function of myeloid-derived suppressor cells (MDSCs), activate CD4+ T cells, and enhance the expression of major histocompatibility complex (MHC) molecules and tumor-specific antigens, thereby synergizing with cytotoxic T lymphocytes [7–10]. Furthermore, DNMTis stimulate the expression of endogenous retroviruses (ERVs), which induce antineoplastic type I interferons (IFN-I), supporting the viral mimicry hypothesis [11]. Key sensors of double-stranded RNA (dsRNA) involved in the interferon response include Toll-like receptor 3, mitochondrial antiviral-signaling protein (MAVS), and Staufen1. Additionally, interferon regulatory factor 3 and the long noncoding RNA TINCR contribute to this process [11, 12]. The viral mimicry effect of DNMTis has rekindled interest in interferon-oriented cancer therapies and the mechanisms of interferon regulation within the tumor microenvironment [13]. However, much of the evidence supporting the viral mimicry hypothesis has been derived from in vitro studies, with a notable lack of in vivo mechanistic research.
The objective of this study was to investigate the phenomenon of DAC-induced viral mimicry in murine tumor models. We utilized two murine tumor cell lines: 4T1, a mouse mammary tumor cell line derived from the BALB/c strain, and MC38, a colon adenocarcinoma cell line originating from C57BL/6 mice. Both cell lines efficiently form solid tumors in their respective syngeneic host strains. The genomes of these cell lines contain endogenous proviruses of the Mouse mammary tumor virus (MMTV, referred to as Mtv for endogenous variants), which can be transmitted both endogenously through Mendelian inheritance and exogenously via maternal milk [14]. MMTV is a significant contributor to the development of mouse mammary tumors [15]. Our investigation focused on the roles of MMTV and interferon-β (IFN-β) in the antineoplastic effects of DAC. We found that DAC treatment activates MMTV expression, which subsequently induces IFN-β expression in tumor cells, ultimately resulting in reduced cell proliferation and delayed tumor growth. Notably, we observed a rapid initial upregulation of interferon regulatory factor 7 (IRF7), which gradually declined over the course of DAC treatment.
Materials and methods
Cell lines, culturing, and in vitro drug treatment
The 4T1 murine mammary cancer cell line (American Type Culture Collection; STR authenticated) was cultured in RPMI 1640 supplemented with 10% fetal bovine serum (FBS). The MC38 cell line, provided by Dr. Anthony Bauer and also STR authenticated, was maintained in Dulbecco’s Modified Eagle Medium (DMEM) with 10% FBS. All cell cultures were incubated at 37 °C in a 5% CO_2_ atmosphere.
DAC (MedChemExpress) was prepared by dissolving it in dimethyl sulfoxide (DMSO) and subsequently added to the culture media at a concentration of 100 nM. Recombinant mouse interferon-α2 (VWR) was dissolved in water and incorporated into the culture media at concentrations of 2 ng/mL and 20 ng/mL. After a treatment period of 3–4 days, cells were trypsinized and counted using a NucleoCounter NC-3000 (Chemometec), following the manufacturer’s protocols. Additionally, the cell lines were treated with BM-Cyclin to eliminate any potential mycoplasma contamination.
Extraction of RNA, reverse transcription, and quantitative PCR
RNA extraction, reverse transcription, and real-time PCR were performed as previously described [16], using the same primers for MMTV and the reference gene Pgk1. Candidate housekeeping genes from the Mouse Housekeeping Gene Primer Set (RealTimePrimers) were evaluated with NormFinder [17], which identified Pgk1 as the most stable. Primers for the Ifnb1 gene (RealTimePrimers.com), which encodes IFN-β, were used at 200 nM. The annealing temperature for Ifnb1 was 61 ^∘^C. All samples were quantified in triplicate wells. All quantities were calculated using the ΔΔCt method. All primer pairs had amplification efficiencies above 90%, producing a single band upon agarose gel electrophoresis and a single peak in melting point analyses.
Plasmids, lentiviral packaging and transduction
MMTV short hairpin RNA (shRNA) plasmids were custom-designed and constructed by OriGene. Two of these plasmids targeted the env gene: KD1 targeted nucleotides 6394–6422, and KD3 targeted nucleotides 6720–6748, as referenced in GenBank AF033807.1. Additionally, KD2 targeted the pol gene, specifically nucleotides 5186–5214. Mouse Ifnb1 shRNA plasmids were also obtained from OriGene. In both cases, 29-mer shRNA constructs were expressed using the pGFP-C-ShLenti lentiviral vector. For the control, the same vector was used to express a scrambled 29-mer shRNA. The procedures for lentiviral packaging and transduction followed the methods described in [16]. To select transduced 4T1 cells, the concentration of puromycin was gradually increased from 0.5 µg/mL to 10 µg/mL.
Immunoblotting
Immunoblotting was conducted as outlined in [16]. Tissue samples or cultured cells were lysed using radioimmunoprecipitation assay (RIPA) buffer. The Invitrogen iBlot 2 Gel Transfer Device facilitated the transfer of proteins onto polyvinylidene difluoride (PVDF) membranes. The following primary antibodies were employed: polyclonal rabbit anti-MMTV Env (Bosterbio A30410) at a dilution of 1:2000, polyclonal rabbit anti-IFNB (MyBioSource MBS9607127) at 1:3000, polyclonal rabbit anti-IRF7 at 1:1000, and monoclonal mouse anti-glyceraldehyde-3-phosphate dehydrogenase (GAPDH) (Bosterbio M00227-6) at 1:3000. All primary antibodies were incubated overnight at 4 ^∘^C. Secondary antibodies included horseradish peroxidase (HRP)-conjugated goat anti-rabbit IgG (Bosterbio) and IRDye800CW-labeled donkey anti-mouse (LI-COR), both used at a dilution of 1:10,000. Reactions with secondary antibodies were performed at room temperature for one hour. Enhanced chemiluminescence (Bosterbio) and infrared fluorescence were captured using the ChemiDoc MP (Bio-Rad) or scanned with the Odyssey CLx Infrared Imaging System (LI-COR). Band intensities were quantified using Image Studio (LI-COR) and Image Lab (Bio-Rad) software. The quantities of target proteins were normalized to GAPDH levels to produce densitograms.
Mouse models
Female BALB/c, C57BL/6, and NU/J mice (7–8 weeks old, with body weights of 19.2 ± 1.6 g, 18.7 ± 1.0 g, and 23.8 ± 1.4 g, respectively) were inoculated subcutaneously with 30,000 4T1 cells or 200,000 MC38 cells suspended in 50–100 µL of Versene solution (ThermoFisher), using a 30½-gauge needle at nipple number 4. Following the development of palpable tumors, typically within one week post-inoculation, the mice were stratified into treatment groups based on tumor size and body weight using the minimization method [18]. DAC was administered via subcutaneous injection every other day at doses of 0.42 mg/kg for BALB/c and NU/J mice (with the exception of the MMTV knockdown experiment, where a dose of 0.78 mg/kg was used) and 0.53 mg/kg for C57BL/6 mice. The drug was initially dissolved in DMSO, stored at –80 ^∘^C, and subsequently diluted 100-fold in phosphate-buffered saline (PBS) for injection on the back. Control mice received an equivalent volume of PBS containing 1% DMSO. Mice were weighed biweekly, and tumor volume was calculated using the formula 0.5 × length × width^2^. Experiments were concluded before tumors reached 20% of body weight or when mice exhibited signs of morbidity. Tumor mass was measured post-euthanasia. The metastatic colony count was conducted as previously described [16]. The students responsible for measuring tumors and counting colonies were blinded to group allocations during the assessments. The use of mice in this study was approved by the Institutional Animal Care and Use Committee of Liberty University (protocol numbers 70, 75, 81, 89, 96, 98).
Statistical analysis
The two-tailed exact Mann–Whitney U test was employed to compare two sets of quantitative data. In instances involving multiple groups, pairwise comparisons were preplanned. Statistical significance was determined at P < 0.05. Correlation coefficients were calculated and assessed using the Spearman’s Rho Calculator [19]. A two-tailed post hoc power analysis was conducted with G*Power, utilizing Cohen’s d to evaluate effect sizes [20].
Results
DAC inhibited tumor growth and metastasis in both immunocompetent mice and nude mice
We inoculated both 4T1 and MC38 cells into the subcutaneous tissue of syngeneic mice (BALB/c and C57BL/6, respectively) and nude mice, specifically under the nipple number 4. Once the tumors became palpable, DAC was administered via subcutaneous injection every other day for a duration of 3–4 weeks. The pulmonary metastasis of 4T1 tumors was assessed by counting colonies in cell cultures following the sacrifice of the mice.
DAC significantly inhibited the overall growth of both 4T1 and MC38 tumors in syngeneic and nude mice, as illustrated in Figure 1A–1C. However, the rate of primary tumor growth accelerated after 2–3 weeks of DAC treatment. Additionally, DAC effectively reduced pulmonary metastasis of the 4T1 tumor in both BALB/c and nude mice, as shown in Figure 1D.
DAC treatment, tumor growth/metastasis assessments, and MMTV expression readouts in murine tumor models. (A) Tumor growth curves for 4T1 (BALB/c) and MC38 (C57BL/6) tumors treated with decitabine (DAC) or vehicle (PBS); n ═ 5 mice per group. Individual trajectories are shown with group medians overlaid (x-axis: Days after inoculation; y-axis: Tumor volume, mm3); (B) Tumor growth rates derived as linear-regression slopes of the curves in (A). Points indicate group medians with 95% CIs; P values are annotated; (C) Final tumor mass across strains and treatments: 4T1 in BALB/c and NU/J; MC38 in C57BL/6 and NU/J. n ═ 5 per group except 4T1 in NU/J (n ═ 9). Medians with 95% CIs; (D) Lung metastasis of 4T1 tumors quantified as log10 colony counts from lung cell cultures. n ═ 5 for BALB/c; n ═ 9 for NU/J. Medians with 95% CIs; (E) MMTV env and pol RNA in 4T1 tumors (BALB/c) measured by qRT-PCR and displayed as log10 relative quantity (PBS n ═ 6; DAC n ═ 5); (F) MMTV env and pol RNA in MC38 tumors (C57BL/6) measured by qRT-PCR (n ═ 5 per group); (G) Immunoblot of MMTV Env in 4T1 tumors: Lanes 1–5 PBS; lanes 6–10 DAC. Bands near ∼80 kDa and ∼45 kDa are shown; GAPDH (37 kDa) is the loading control. Bar plot summarizes band intensities per lane; (H) Scatter plot of tumor mass versus Env band intensity for the 10 4T1 tumors in (G); five PBS and five DAC samples. Spearman correlation statistics are annotated in the panel. Abbreviations: DAC: Decitabine (5-aza-2ʹ-deoxycytidine); PBS: Phosphate-buffered saline; MMTV: Mousemammary tumor virus; env/pol: MMTV genes; qRT-PCR: Quantitative reverse-transcription PCR; kDa: Kilodalton; CI: Confidence interval; BALB/c = B/c; C57BL/6 = B/6; NU/J: Nude mice; n: Number of mice.
DAC enhanced expression of MMTV which is correlated with tumor suppression
DAC treatment of mice significantly increased the RNA expression of the env and pol genes of MMTV in both 4T1 and MC38 tumors, as determined by quantitative reverse transcription PCR (qRT-PCR) (Figure 1E and 1F). The expression levels of the MMTV Env protein varied between treated and untreated mice. A 70–80 kDa Env precursor was observed in both groups, exhibiting greater intensity in DAC-treated tumors, while a prominent 40–45 kDa band was identified exclusively in the treated group (Figure 1G). Notably, a significant negative correlation was found between Env quantity and tumor mass, with a Spearman correlation coefficient of –0.88 (Figure 1H).
MMTV knockdown conferred resistance to DAC
To investigate the role of MMTV in DAC-mediated tumor suppression, we constructed lentiviral plasmids expressing shRNA that targeted the MMTV env and pol genes, which were then transduced into 4T1 cells. The knockdown of MMTV resulted in increased resistance of 4T1 cells to DAC in vitro, as evidenced by a higher number of surviving cells in the presence of DAC compared to the control, as indicated by viable cell counts using the NucleoCounter (Figure 2A and 2B). This trend was also observed in vivo (Figure 2C and 2D). Among the knockdown cell lines, KD1 exhibited a more efficient MMTV knockdown than KD3 (see Table 1 for knockdown efficiencies; KD2 was excluded due to low efficiency). Correspondingly, tumors from the KD1 cell line demonstrated greater resistance to DAC (Figure 2C and 2D).
MMTV knockdown reduces sensitivity of 4T1 cells and tumors to DAC treatment. (A) Effect of MMTV knockdown and DAC treatment on proliferation of 4T1 cells. Cell viability was determined by NucleoCounter analysis after DAC exposure; (B) Effect of MMTV knockdown on DAC-mediated growth inhibition of 4T1 cells in vitro. Percent inhibition was calculated relative to untreated controls; (C) Impact of MMTV knockdown and DAC on tumor growth kinetics of 4T1 tumors in BALB/c mice. Tumor volumes were monitored over time following inoculation and treatment with PBS or DAC; (D) Growth rate analysis of 4T1 tumors in BALB/c mice after MMTV knockdown and DAC treatment. Pairwise comparisons were performed between PBS- and DAC-treated groups, as well as between control and knockdown tumors; (E) Quantification of MMTV env transcript levels in control and knockdown tumors with or without DAC treatment. Relative expression was determined by qRT-PCR; (F) Quantification of MMTV pol transcript levels in control and knockdown tumors with or without DAC treatment. Relative expression was determined by qRT-PCR. Values represent group medians with 95% confidence intervals. n ═ 4 for in vitro assays (A and B); n ═ 9 for control tumors, n ═ 10 for KD1, and n ═ 5 for KD3 in vivo experiments (C and D); n ═ 4–6 for transcript quantification (E and F). Abbreviations: MMTV: Mouse mammary tumor virus; DAC: Decitabine; PBS: Phosphate-buffered saline; KD: Knockdown; qRT-PCR: Quantitative reverse transcription polymerase chain reaction.
To further elucidate the role of MMTV in DAC treatment, we quantified env and pol transcripts in knockdown cell lines both in the presence and absence of DAC (Figure 2E and 2F). The RNA expression levels of env and pol were significantly diminished in the knockdown cell lines compared to the control groups. Notably, the DAC-induced upregulation of MMTV transcription was limited in the knockdown cells.
DAC upregulated expression of IFN-β in tumor cells
DAC treatment significantly enhanced the expression of IFN-β in mouse tumor cell lines at both the RNA and protein levels (Figure 3A and 3B). This increase was accompanied by a rapid rise in IRF7 expression immediately following DAC treatment, which subsequently declined over the treatment period (Figure 3B). A Mann–Kendall test confirms the downward trend in IRF7 protein levels from day 2 to day 15 with 96% confidence. Additionally, the knockdown of MMTV in 4T1 cells resulted in a corresponding decrease in IFN-β expression (Figure 3C), while knockdown of IFN-β led to an accumulation of MMTV Env (Figure 3D). These findings underscore a critical reciprocal relationship between MMTV and IFN-β expression.
IFN-β mediates the antitumor effect of DAC and reciprocally regulates MMTV expression. (A) DAC induces transcriptional upregulation of Ifnb1 in MC38 cells. Expression was quantified by qRT-PCR; (B) DAC treatment increases IFN-β and IRF7 protein levels in 4T1 tumors. BALB/c mice were treated daily for 5 days and every other day thereafter. Protein abundance was analyzed by immunoblotting. Normalized band intensities are shown below the blots; (C) MMTV knockdown reduces IFN-β protein expression in 4T1 cells. Western blot analysis of KD1–KD3 knockdown lines compared with control; (D) Knockdown of Ifnb1 increases MMTV Env expression in 4T1 cells. Western blot showing reciprocal regulation of IFN-β and MMTV Env; (E) Effect of IFN-α on the proliferation of Ifnb1 knockdown cell lines; (F) Effect of Ifnb1 knockdown and DAC treatment on 4T1 cell proliferation. Viable cell counts were determined by NucleoCounter; (G) Ifnb1 knockdown reduces sensitivity of 4T1 cells to DAC in vitro. Percent inhibition was calculated relative to untreated controls; (H) Tumor growth kinetics of control and Ifnb1 knockdown 4T1 tumors in BALB/c mice treated with PBS or DAC. Tumor volumes were measured longitudinally after inoculation; (I) Growth rate analysis of 4T1 tumors following Ifnb1 knockdown and DAC treatment. Pairwise comparisons included untreated and DAC-treated groups, as well as untreated tumors from control vs KD1. Values represent medians with 95% confidence intervals. n ═ 4 for in vitro proliferation assays (A, E–G); n ═ 6–7 for control and KD1, and n ═ 10 for KD2 in vivo studies (H and I). Abbreviations: DAC: Decitabine; IFN: Interferon; IFN-β: Interferon beta; IFN-α: Interferon alpha; IRF7: Interferon regulatory factor 7; GAPDH: Glyceraldehyde 3-phosphate dehydrogenase; MMTV: Mouse mammary tumor virus; Env: Envelope protein; KD: Knockdown; PBS: Phosphate-buffered saline; qRT-PCR: Quantitative reverse transcription polymerase chain reaction.
IFN-β knockdown conferred resistance to DAC
Lentiviral plasmids expressing shRNA to target various splice variants of the Ifnb1 gene were employed to knock down Ifnb1 in 4T1 cells (see Table 1 for the knockdown efficiencies of the KD1 and KD2 cell lines utilized in subsequent experiments). The knockdown of IFN-β increased the resistance of 4T1 cells to DAC in vitro and in vivo (Figure 3F–3I). Notably, untreated KD1 tumors exhibited accelerated growth compared to untreated control tumors, suggesting a tumor-suppressive role for IFN-β. To verify that the enhanced growth of KD1 tumors was attributable to the knockdown of an IFN-I, we treated both control and knockdown cell lines in vitro with recombinant interferon-α2 (IFN-α2). The growth of both knockdown cell lines significantly decreased in the presence of low concentrations of IFN-α2, while the control cell line remained unaffected (Figure 3E). These findings indicate that Ifnb1 knockdown heightened the sensitivity of 4T1 cells to exogenous IFN-α2. The reduced growth of KD2 is likely a consequence of off-target effects from the lentiviral insertions.
Discussion
This study represents the first examination of the viral mimicry hypothesis within murine tumor models. Our findings indicate that DAC effectively suppresses tumor growth and metastasis in mice, with this effect being at least partially mediated by MMTV and IFN-β.
Role of viral RNA and proteins
The expression of viral RNA, particularly dsRNA, can elicit an antiviral response through interferon signaling [21]. Consistent with prior research on human ERVs [11], treatment with DAC resulted in significantly greater increases in MMTV RNA transcription compared to MMTV protein production. This discrepancy between RNA transcripts and protein synthesis is likely attributed to interferon-stimulated genes, such as the Zinc Finger Antiviral Protein (ZAP) and RNA-activated protein kinase (PKR), which inhibit retroviral translation [22]. Notably, we observed a correlation between the quantity of MMTV Env protein and the antineoplastic effects of DAC. This finding suggests that MMTV protein may play a role in tumor suppression as a neoantigen [9].
Role of IFN-β in controlling viruses and tumors
While IFN-α and IFN-γ are predominantly produced by specialized immune cells, IFN-β is synthesized by nearly all nucleated cells during viral infections. This study demonstrates that knockdown of IFN-β results in the accumulation of the MMTV Env protein, thereby underscoring the antiviral function of IFN-β. Furthermore, IFN-β seems to inhibit tumor growth even without DAC stimulation, as one of the IFN-β knockdown cell lines (KD1) formed tumors more rapidly than the control cells.
The relationship between IFN-β and IRF7
Upregulation of IRF7 expression has been recently documented in cell cultures treated with DAC as well as in tumor tissues from DAC-treated patients [23, 24]. Our findings corroborate these observations. Mice are known to exhibit high levels of IRF7, which enhances the production of various proinflammatory cytokines [25]. IRF7 serves as a critical transcription factor that mediates the downstream effects of pattern-recognition receptor signaling, facilitating the production of IFN-I [24, 26]. Notably, IFN-I also activates IRF7 expression via the JAK-STAT pathway, thereby establishing a positive feedback loop [27–29]. Consistent with this reciprocal stimulation, we observed a simultaneous increase in IFN-β and IRF7 in DAC-treated cells and tumors. Given that IRF7 is expressed by multiple cell types within the tumor microenvironment, including plasmacytoid dendritic cells, monocytes, B cells, and fibroblasts [29–31], it is likely that the tumor mesenchyme plays a significant role in this positive feedback loop.
Downregulation of interferon response in prolonged treatment
The observed downregulation of IRF7 during prolonged DAC therapy may elucidate the diminished effects of DAC after several weeks of treatment (Figures 1A, 2C, and 3H). Several potential mechanisms may suppress responses to IFN-I, including the downregulation of the interferon receptor (IFNAR), the induction of negative regulators, and the expression of miRNAs [32]. Additionally, certain molecules can significantly downregulate IRF7. For instance, both IFN-I and IRF7 stimulate the expression of activating transcription factor 4 (ATF4), which subsequently binds to and inactivates IRF7 [33] (Figure 4). Furthermore, IFN-I induces the expression of suppressor of cytokine signaling (SOCS) proteins that promote the degradation of IRF7 [34]. While the modulation of interferon responses is essential for preventing interferon-mediated autoimmunity, it may also compromise the efficacy of DAC therapy and other cancer treatments that depend on functional interferon responses. Conversely, in the Ifnb1 knockdown cell lines, the interferon response system, including IFNAR, may be upregulated as a compensatory mechanism, which may explain their increased sensitivity to exogenous IFN-α (Figure 3E).
The interplay between DNMTis, ERVs, IFN-I, and immune checkpoints. DNMTis activate ERVs which, in turn, activate IRF7 and IFN-I. The latter two mutually stimulate each other. IFN-I inhibits both ERV expression and tumor growth. SOCS and ATF4 serve as mediators of negative feedback for the interferon system. Chronic expression of IFN-I activates immune checkpoints, leading to uncontrolled ERV expression and tumor growth. Abbreviations: DNMTis: DNA methyltransferase inhibitors; ERVs: Endogenous retroviruses; IRF7: Interferon regulatory factor 7; IFN-I: Type I interferons; SOCS: Suppressors of cytokine signaling; ATF4: Activating transcription factor 4. [Created in BioRender. Liu (2025) https://BioRender.com/tx85roj].
DAC, interferons, and T cells
IFN-I inhibits tumor growth through both direct antiproliferative and immunomodulatory effects. Mechanistically, interferons downregulate oncogene expression, induce tumor suppressor genes, promote tumor cell apoptosis, enhance the expression of MHC molecules, inhibit angiogenesis, activate T lymphocytes and natural killer (NK) cells, stimulate dendritic cells, and facilitate other tumor-suppressive functions [35]. Notably, the efficacy of DAC in nude mice, which lack T lymphocytes, compared to immunocompetent mice indicates that T lymphocytes do not play a primary role in its mechanisms of action. However, the observed synergy between DAC treatment and adoptive T cell immunotherapy in mice suggests a T cell-activating effect of DAC in immunocompetent hosts [7].
Other transposable elements and direct upregulation of IFN
Beyond ERVs, DAC activates other transposable elements such as LINE-1 in human cells [36]. Additionally, it directly demethylates the promoter region of the IFNB1 gene [37]. These mechanisms are likely present in murine cancer cells; however, the marked decrease in IFN-β observed with MMTV knockdown (Figure 3C) underscores the critical role of MMTV in regulating IFN production within the 4T1 cell line.
The paradoxical role of ERVs in cancer
MMTV has homologues in the human genome, specifically the human ERV type K (HERV-K) family; however, these are more degraded and incapable of horizontal transmission [38]. Driven by sex hormones, HERV-Ks are upregulated in breast cancer cells [39], with expression levels positively correlated with disease progression and unfavorable prognosis [40]. Consequently, the antineoplastic effect of DAC, which stimulates ERV expression, appears paradoxical. This paradox may be explained by negative feedback mechanisms and immune checkpoint regulation (Figure 4). DNMTi-activated viral mimicry induces the production of antineoplastic interferon type I (IFN-I). However, the duration of virus-induced interferon production is limited due to negative feedback [41]. While DAC may prolong interferon production through direct demethylation of the IRF7 promoter [24], chronic interferon production in cancer patients can lead to the upregulation of immune checkpoint molecules, such as programmed death-ligand 1 (PD-L1) [42]. Once the interferon system is exhausted or the patient develops immunotolerance, the tumor-promoting effects of ERVs may prevail. It is plausible that high levels of ERV expression and tumor progression are both outcomes of immunotolerance. Therefore, combining interferon-based therapies with immune checkpoint blockade has demonstrated promising results [43], a strategy that may also be effective when applied to DNMTis [44].
Limitations of the study
Some quantitative analyses may lack sufficient power to detect statistical differences due to small sample sizes (Table 2). Although DAC likely increases MMTV pol gene expression in 4T1 cells, similar to its effects in MC38 cells, the results for 4T1 cells did not achieve statistical significance (Figure 1E and 1F). Furthermore, 4T1 cells with MMTV knockdown (KD1) may retain some sensitivity to DAC in vitro, as observed in vivo. The discrepancy between Figure 2A and Figure 2D is likely attributable to the smaller in vitro sample size and the shorter duration of in vitro treatment (3 days in vitro compared to 4 weeks in vivo). Conversely, statistical differences observed in low-power experiments suggest large effect sizes.
Conclusion
In agreement with the viral mimicry hypothesis, our studies demonstrate the involvement of the MMTV and IFN-β in mediating the antineoplastic action of DAC. There is also an upregulation of IRF7 by DAC in the murine model. A subsequent decline in IRF7 expression suggests negative feedback in the action of IFN-β and provides an explanation for the eventual failure of DAC in cancer treatment. Because interferons are known to activate immune checkpoint control, this study strengthens the theoretical basis for combining DNMTis with immune checkpoint blockers.
The reference list from the paper itself. Each links out to its DOI / PubMed record.
- 1Bohl SR Claus R Dolnik A Schlenk RFDöhner K Hackanson B Decitabine response associated gene expression patterns in acute myeloid leukemia (AML)Blood 2013122213756 https://doi.org/10.1182/blood.V 122.21.3756.3756
- 2Yan P Frankhouser D Murphy M Tam HH Rodriguez B Curfman J Genome-wide methylation profiling in decitabine-treated patients with acute myeloid leukemia Blood 201212012246674 https://doi.org/10.1182/blood-2012-05-4291752278688210.1182/blood-2012-05-429175 PMC 3448258 · doi ↗ · pubmed ↗
- 3Klco JM Spencer DH Lamprecht TL Sarkaria SM Wylie T Magrini V Genomic impact of transient low-dose decitabine treatment on primary AML cells Blood 20131219163343 https://doi.org/10.1182/blood-2012-09-4593132329713310.1182/blood-2012-09-459313 PMC 3587326 · doi ↗ · pubmed ↗
- 4Stresemann C Lyko F Modes of action of the DNA methyltransferase inhibitors azacytidine and decitabine Int J Cancer 20081231813 https://doi.org/10.1002/ijc.236071842581810.1002/ijc.23607 · doi ↗ · pubmed ↗
- 5Mpakou V Spathis A Bouhla A Mpazani E Papageorgiou S Gkontopoulos K Synergistic inhibitory effects of low-dose decitabine in combination with bortezomib in the AML cell line Kasumi-1Exp Ther Med 2021213195 https://doi.org/10.3892/etm.2021.96283348880410.3892/etm.2021.9628 PMC 7812574 · doi ↗ · pubmed ↗
- 6Vatapalli R Rossi AP Chan HM Zhang J Cancer epigenetic therapy: recent advances, challenges, and emerging opportunities Epigenomics 20251715974 https://doi.org/10.1080/17501911.2024.24301693960137410.1080/17501911.2024.2430169 PMC 11702999 · doi ↗ · pubmed ↗
- 7Terracina KP Graham LJ Payne KK Manjili MH Baek A Damle SRDNA methyltransferase inhibition increases efficacy of adoptive cellular immunotherapy of murine breast cancer Cancer Immunol Immunother 2016659106173 https://doi.org/10.1007/s 00262-016-1868-82741683110.1007/s 00262-016-1868-8PMC 4996686 · doi ↗ · pubmed ↗
- 8Li X Dong L Liu J Wang C Zhang Y Mei Q Low-dose decitabine augments the activation and anti-tumor immune response of IFN-γ+ CD 4+ T cells through enhancing IκBα degradation and NF-κB activation Front Cell Dev Biol 20219647713 https://doi.org/10.3389/fcell.2021.6477133379130610.3389/fcell.2021.647713 PMC 8005576 · doi ↗ · pubmed ↗