Equal survival for Black Americans with multiple myeloma when appropriately matched to White Americans
David E. Mery, Guido Tricot, Samer Al Hadidi, Yihao Zhan, Cody Ashby, Clyde Bailey, Eric R. Siegel, Daisy V. Alapat, Hongwei Xu, Sandra Mattox, Caroline Schinke, Maurizio Zangari, Sharmilan Thanendrarajan, Qing Yi, Robert Z. Orlowski, Frits van Rhee, John D. Shaughnessy

Abstract
Genes, proteins, chemicals, diseases, species, mutations and cell lines named across the full text — each resolved to its canonical identifier and authoritative record.
Click any figure to enlarge with its caption.
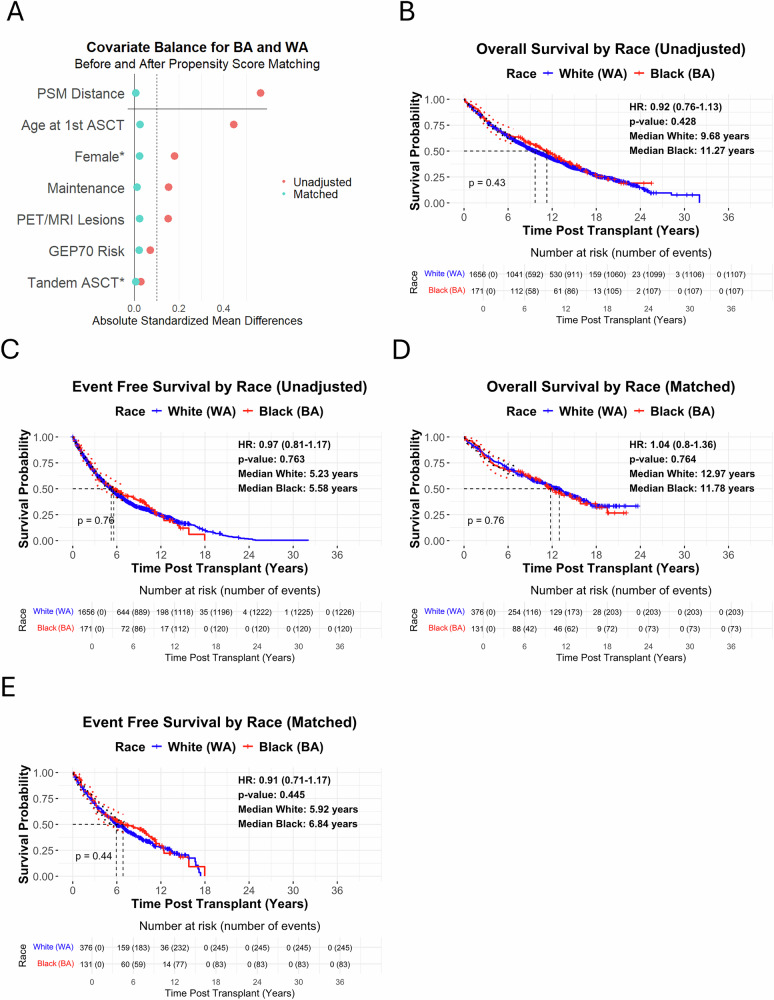 Figure 1
- —https://doi.org/10.13039/100000054U.S. Department of Health & Human Services | NIH | National Cancer Institute (NCI)
- —https://doi.org/10.13039/100005189Leukemia and Lymphoma Society (Leukemia & Lymphoma Society)
- —https://doi.org/10.13039/100006812Center for Integrated Healthcare, U.S. Department of Veterans Affairs (VISN 2 Center for Integrated Healthcare)
- —UAMS Winthrop P. Rockefeller Cancer Institute (WPRCI) Fund Myeloma Solutions Fund Paula and Rodger Riney Foundation
Peer Reviews
No public reviews on file for this paper yet. If you reviewed it on a platform where reviews are public (OpenReview, ICLR, NeurIPS, ICML), you can paste yours below so the community can read it here.
Videos
No videos yet. Explain this paper in a talk, walkthrough, or lecture? Add one.
Taxonomy
TopicsMultiple Myeloma Research and Treatments · Myeloproliferative Neoplasms: Diagnosis and Treatment · Amyloidosis: Diagnosis, Treatment, Outcomes
To the Editor,
Multiple myeloma (MM) is a malignant plasma cell disorder with marked racial disparities in incidence and mortality. In the United States, Black Americans (BA) have roughly twice the incidence and mortality rates of White Americans (WA), making MM the most common hematologic malignancy among BA [1]. Inequities in access to timely, optimal treatment are well documented [2], but the contribution of biological or genetic factors to survival differences remains uncertain [3]. Some studies have reported better or equivalent survival when treatment access was more equitable [4–6], though treatment intensity, sequencing, and timing from diagnosis were not strictly matched between racial groups, leaving the possibility of unmeasured biological or molecular risk. Notably, one major study observed worse outcomes for BA despite adjustment for clinical and molecular risk, though treatment matching was imbalanced [7]. To address gaps in earlier work, we combined comprehensive risk assessment with meticulous treatment matching, allowing for a more accurate evaluation of racial outcomes.
Although our institutional database at the University of Arkansas for Medical Sciences (UARK) included 1024 BA and 6941 WA patients with a myeloma diagnosis, only 1827 (171 BA; 1656 WA) met strict inclusion criteria for this analysis: newly diagnosed MM (NDMM), ≤1 cycle of prior therapy, autologous stem cell transplantation (ASCT) within 12 months of induction, and standardized follow-up between 1989 and 2018 with at least seven years of post-transplant observation. This smaller, uniformly treated cohort, referred to as unadjusted UARK-NDMM, allowed us to evaluate racial differences independent of access and treatment disparities.
Within the unadjusted UARK-NDMM cohort, BA were younger than WA, with fewer patients ≥65 years old (10% vs. 16%) and more ≤50 years old (38% vs. 30%), consistent with national data (S1) [1]. A higher proportion of BA were women (52% vs. 37%). Although referral patterns may contribute, national data show BA women have a 3.4-fold higher incidence of myeloma than WA women. Age-adjusted incidence among BA women has risen 2% annually between 2017 and 2021, while rates in WA women have remained stable (S1) [1].
Baseline clinical differences included higher rates of obesity, elevated diastolic blood pressure, and lower total iron-binding capacity among BA, with trends toward lower hemoglobin and higher lactate dehydrogenase (S1). However, key prognostic factors—extent of disease by advanced imaging (positron emission tomography [PET] and magnetic resonance imaging [MRI]), molecular risk by 70-gene expression profiling (GEP70) [8], and high-risk cytogenetics—were comparable between groups (S1). Maintenance therapy differed, with BA more frequently receiving an immunomodulatory drug [IMiD] and proteasome inhibitor [PI] (S1), reflecting evolving treatment practices and the increasing representation of older and non-White patients at our institution in more recent eras.
Because the BA cohort was relatively small compared with WA and imbalanced across key demographic and treatment variables, we emphasized rigorous matching to reduce bias and address limitations of the small BA sample size. Propensity Score Matching (PSM) in a 1:3 ratio was performed to align BA and WA patients on critical prognostic factors, including age at ASCT, sex, molecular risk by GEP70, extent of disease by advanced imaging (PET/MRI), receipt of tandem-ASCT, and type of maintenance therapy (no PI/IMiD, IMiD-only, or PI+IMiD). This ensured that comparisons were made between clinically similar patients treated under uniform conditions. GEP70 was selected as the molecular risk score since it has repeatedly been shown to be the strongest predictor of outcome in newly diagnosed and relapsed myeloma, independent of age, stage, and treatment [8]. Survival outcomes were analyzed using Kaplan–Meier and Cox proportional hazards models, with proportionality assumptions tested. Detailed eligibility criteria, variable definitions, and statistical methods are provided in the Supplementary Appendix.
Of the 1827 eligible patients, 1290 had complete data available for matching. Among these, 131 BA were matched 1:3 without replacement to 376 WA using a propensity score algorithm. The model incorporated continuous variables for age at ASCT, GEP70 molecular risk score, and highest focal lesion count by PET/MRI, along with categorical treatment variables. Given the concern that the small number of high-risk BA patients could weaken conclusions, we modeled GEP70 as a continuous variable before reporting results at the canonical ≥0.66 cutoff (Table 1). This allowed us to capture the full spectrum of molecular risk rather than focusing only on the “high-risk” subset and confirmed that BA and WA were comparably distributed across the risk continuum, mitigating the impact of small numbers. Extent of disease was handled similarly, with PET/MRI focal lesions matched as a continuous variable to ensure comparable disease burden. Age, an established poor prognostic factor [8], at the time of ASCT was also included as a continuous variable in matching.Table 1. Comparison of clinical and genetic characteristics between BA and WA matched UARK—NDMM Patients.FactorsAll, % (n/N)BA, % (n/N)WA, % (n/N)OR (95% CI)pDemographics Age ≤ 5031% (157/507)30% (39/131)31% (118/376)0.93 (0.60–1.43)0.815 51 < Age < 6554% (276/507)56% (73/131)54% (203/376)1.07 (0.72–1.60)0.809 Age ≥ 6515% (74/507)15% (19/131)15% (55/376)0.99 (0.56–1.74)1.000 Female52% (266/507)55% (72/131)52% (194/376)1.14 (0.77–1.71)0.574Myeloma Risk Factors Calcium >10.5 mmol/L10% (50/502)9% (12/128)10% (38/374)0.91 (0.46–1.81)0.932 LDH high20% (102/501)26% (33/128)18% (69/373)1.53 (0.95–2.46)0.101 Creatine ≥ 2 mg/L9% (43/503)7% (9/129)9% (34/374)0.75 (0.35–1.61)0.577 CRP ≥ 8 mg/L32% (158/497)33% (41/126)32% (117/371)1.05 (0.68–1.61)0.922 Albumin < 3.5 g/dL36% (181/502)38% (49/128)35% (132/374)1.14 (0.75–1.72)0.616 B2M ≥ 3.5 mg/dL47% (235/500)41% (52/127)49% (183/373)0.72 (0.48–1.08)0.139 B2M > 5.5 mg/dL23% (114/500)24% (30/127)23% (84/373)1.06 (0.66–1.71)0.894 HGB – low g/dL42% (215/506)50% (66/131)40% (149/375)1.54 (1.03–2.30)0.043 Platelets < 150 (K/uL)14% (73/506)18% (24/131)13% (49/375)1.49 (0.87–2.55)0.184 PC % > 60%34% (164/484)35% (43/122)33% (121/362)1.08 (0.70–1.67)0.797 > 7 MRI lesions54% (272/502)53% (69/131)55% (203/371)0.92 (0.62–1.37)0.763 > 3 PET lesions47% (213/458)45% (54/119)47% (159/339)0.94 (0.62–1.43)0.857Light Chain Urine M ≥ 500 mg/24 hr32% (151/479)32% (40/125)31% (111/354)1.03 (0.66–1.60)0.983 κ64% (319/502)65% (84/130)63% (235/372)1.06 (0.70–1.61)0.850 κ Ulight60% (123/206)56% (28/50)61% (95/156)0.82 (0.43–1.56)0.654 Log(κ) > median33% (144/439)33% (36/110)33% (108/329)1.00 (0.63–1.58)1.000 Log(λ) > median48% (211/439)45% (50/110)49% (161/329)0.87 (0.56–1.34)0.601Iron Metabolism Iron – low (ug/dL)5% (22/425)6% (6/109)5% (16/316)1.09 (0.42–2.87)1.000 Transferrin < 200 mg/dL44% (109/246)48% (33/69)43% (76/177)1.22 (0.70–2.13)0.582 Ferritin–high (ng/mL)32% (134/418)38% (42/110)30% (92/308)1.45 (0.92–2.29)0.138 TIBC < 250 ug/dL31% (130/422)38% (41/108)28% (89/314)1.55 (0.98–2.45)0.081General BMI > 3031% (128/415)45% (43/96)27% (85/319)2.23 (1.39–3.58)0.001 HDL – low (mg/dL)68% (84/124)70% (26/37)67% (58/87)1.18 (0.51–2.72)0.855 BP Syst. > 140 mm Hg30% (127/424)35% (37/105)28% (90/319)1.38 (0.87–2.21)0.215 BP Diast. > 90 mm Hg10% (43/424)15% (16/105)8% (27/319)1.94 (1.00–3.77)0.071Metaphase Cytogenetics CA32% (145/457)33% (35/106)31% (110/351)1.08 (0.68–1.72)0.836FISH 1p del19% (74/390)21% (21/101)18% (53/289)1.17 (0.66–2.06)0.694 1q gain42% (170/407)39% (41/105)43% (129/302)0.86 (0.55–1.35)0.588 13q del46% (165/357)37% (37/99)50% (128/258)0.61 (0.38–0.97)0.050 17p del11% (38/352)9% (9/95)11% (29/257)0.82 (0.37–1.81)0.770GEP Groups t(11;14)23% (118/507)18% (23/131)25% (95/376)0.63 (0.38–1.05)0.093 Hyperdiploid43% (217/507)45% (59/131)42% (158/376)1.13 (0.76–1.69)0.618 t(4;14)7% (37/507)10% (13/131)6% (24/376)1.62 (0.80–3.27)0.251 t(14;16)/t(14;20)14% (70/507)15% (19/131)14% (51/376)1.08 (0.61–1.91)0.903 PR13% (65/507)13% (17/131)13% (48/376)1.02 (0.56–1.84)1.000 SRCA66% (335/507)63% (82/131)67% (253/376)0.81 (0.54–1.23)0.385 HRCA34% (172/507)37% (49/131)33% (123/376)1.23 (0.81–1.86)0.385Risk Scores ISS stage I45% (208/465)50% (60/119)43% (148/346)1.36 (0.90–2.07)0.180 ISS stage II29% (136/465)25% (30/119)31% (106/346)0.76 (0.48–1.22)0.315 ISS stage III26% (121/465)24% (29/119)27% (92/346)0.89 (0.55–1.44)0.723 GEP70 ≥ 0.6616% (82/507)17% (22/131)16% (60/376)1.06 (0.62–1.81)0.931Tandem Transplant Tandem ASCT83% (421/507)84% (110/131)83% (311/376)1.09 (0.64–1.87)0.845Maintenance No PI/IMiD13% (66/507)11% (15/131)14% (51/376)0.82 (0.45–1.52)0.640 IMiD–Based13% (67/507)15% (19/131)13% (48/376)1.16 (0.65–2.06)0.722 PI +IMiD74% (374/507)74% (97/131)74% (277/376)1.02 (0.65–1.60)1.000Analysis of clinical and genetic parameters for all (All), Black (BA), and White (WA) matched patients in UARK-NDMM (n = 507). Age indicates age at first ASCT. LDH, lactate dehydrogenase; LDH-high indicates >190 U/L before October 7, 2009 or >248 U/L after October 7, 2009; CRP,C-reactive protein; B2M, beta-2-microglobulin. HGB, hemoglobin; HGB-low indicates <10 g/dL (female) or < 12 g/dL (male). PC %, plasma cell percentage; MRI, magnetic resonance imaging; PET, positron emission tomography; Urine M, urine M-protein; Iron–low indicates <35 µg/dL (female) or <50 µg/dL (male); ferritin–high indicates >306 ng/mL (female) or >336 ng/mL (male); TIBC, total iron-binding capacity; BMI, body mass index; HDL, high-density lipoprotein < 50 mg/dL (female) or < 40 mg/dL (male). BP Syst. and BP Diast. represent systolic and diastolic blood pressure, respectively. Clinical features were compared between BA and WA using chi-square tests. Odds ratios (ORs) and 95% confidence intervals (CIs) were calculated using the Wald method for 2 × 2 tables. P-values with three significant figures. OR represents the odds of the clinical feature being present in BA compared to WA. CA indicates any cytogenetic abnormality on metaphase cytogenetics. FISH refers to fluorescence in-situ hybridization. 1p del, 1q gain, 13q del, and 17p del indicate deletion or gain/amplification of chromosomes 1p, 1q, 13q, and 17p, respectively. GEP, gene expression profiles. SRCA denotes standard risk cytogenetic abnormalities: t(11;14) groups (CD-1 and CD-2) and hyperdiploid groups (LB and HY). HRCA denotes high-risk cytogenetic abnormalities: t(4;14) group (MS), t(14;16)/t(14;20) group (MF) and the proliferation group (PR). ISS represents the International Staging System. Tandem ASCT, second transplant. Clinical features were compared between BA and WA using chi-square tests. Odds ratios (ORs) and 95% confidence intervals (CIs) were calculated using the Wald method for 2 × 2 tables. P-values with three significant figures. OR represents the odds of the genetic feature being present in BA compared to WA.PI proteasome inhibitor, IMiD immunomodulatory drug.
Tandem ASCT was coded as 0 (no) or 1 (yes), and maintenance therapy as 0 (no PI/IMiD), 1 (IMiD only), or 2 (PI+IMiD). To minimize treatment-related confounding, we prioritized balancing tandem-ASCT and maintenance therapy rather than induction regimens. This strategy reflects evidence that induction type has a minimal long-term impact once patients proceed to transplant, whereas lack of post-transplant therapy is strongly associated with inferior outcomes. In a large analysis, Cornell et al. reported that PFS and OS did not differ by induction regimen, but patients who did not receive post-transplant therapy had significantly worse 3-year progression-free survival (39% vs 55%, p = 0.0001) and higher relapse risk [9].
Matching reduced standardized mean differences (SMD) for all covariates to <0.05 in UARK-NDMM (Fig. 1A, S2–S3), effectively neutralizing demographic, molecular risk, extent of disease, and treatment imbalances. Notably, the continuous GEP70 molecular risk distribution was nearly identical between groups (SMD = 0.013, S3). While most clinical factors were balanced after matching, two differences remained statistically significant (Table 1). BA were more likely to have lower hemoglobin (50% vs. 40%, OR 1.54, 95% CI 1.03–2.30, p = 0.043), a finding likely reflecting physiological variation, as healthy BA have lower mean hemoglobin than WA even after adjustment for iron deficiency and α-thalassemia [10]. BA were also more likely to be obese (45% vs. 27%; OR 2.23, 95% CI 1.39–3.58, p = 0.001), consistent with Centers for Disease Control and Prevention (CDC) data showing a higher obesity prevalence among non-Hispanic Black adults—particularly Black women—compared with non-Hispanic White adults [1].Fig. 1. Survival and Covariate Balance Analyses for BA and WA Patients from UARK-NDMM.Kaplan-Meier (KM) overall survival (OS) (A) and event free survival (EFS) (B) curves of BA and WA patients from the UARK-NDMM cohort. C Love plot depicting covariate balance before and after propensity score matching, comparing unadjusted and matched patient characteristics. KM OS (D) and EFS (E) curves for BA and WA patients from the matched UARK-NDMM cohort with complete data on, sex, age, GEP70 risk, extent of disease (MRI/PET focal lesions), tandem ASCT and maintenance therapy. Hazard ratios (HRs) and p-values were calculated using Cox proportional hazards models. The Love plot was generated to demonstrate covariate balance before and after propensity score matching, performed using nearest-neighbor matching with a 1:3 ratio of BA to WA and a caliper of 0.2. All survival analyses and covariate matching were performed using R version 4.4.1, with the survival, survminer, MatchIt, and cobalt packages. 95% CI for KM curves were displayed up to 7 years post-transplantation. 95% CI were represented as black dotted lines around the blue survival curve for WA and red dotted lines around the red survival curve for BA.
Matched cytogenetic differences were modest. In Table 1, the presence of t(11;14) was less frequent in BA (18% vs. 25%) while t(14;16)/t(14;20) and del(17p) rates were similar. Only del(13q) by FISH was significantly lower in BA (37% vs. 50%; OR 0.61, 95% CI 0.38–0.97, p = 0.050). While earlier reports have described lower frequencies of high-risk cytogenetic lesions in Black patients [11], Baughn et al. noted no difference in t(4;14) but observed higher odds of t(11;14), t(14;16), and t(14;20) in those with ≥80% African ancestry [12]. In contrast, our analysis showed a nonsignificant trend toward lower t(11;14) prevalence in Black patients. These differences may reflect variations in African ancestry, sample size, or referral patterns between studies. The lower del(13q) prevalence should be interpreted cautiously, as its prognostic value by FISH detection is limited and often diminishes after adjusting for co-occurring lesions [13].
Unadjusted UARK-NDMM median OS was 11.27 years for BA vs. 9.68 years for WA (HR 0.92, p = 0.428) and median event-free survival (EFS) was 5.58 for BA vs. 5.23 years for WA (HR 0.97, p = 0.763) (Fig. 1B–C). Matched UARK-NDMM median OS was 11.78 for BA vs. 12.97 years for WA (HR 1.04, p = 0.764) and median EFS was 6.84 for BA vs. 5.92 years for WA (HR 0.91, p = 0.445) (Fig. 1D–E). No significant racial differences in OS or EFS were observed before or after matching. Matching resulted in a younger WA cohort with improved survival metrics compared to the overall WA population, which is an expected outcome of the matching process rather than a limitation. The matching procedure specifically aims to create comparable groups to isolate the effect of race, even if this means selecting a WA subpopulation that differs from the overall WA cohort.
The key strengths of our study are the breadth of patient data and the rigor of cohort selection and treatment matching. We compared patients with comprehensive baseline profiles, encompassing detailed clinical and molecular parameters and applied strict inclusion criteria to ensure equitable treatment for BA and WA patients. All patients were treated at a tertiary academic center, reflecting access to healthcare insurance and specialized care, which is associated with improved outcomes in multiple myeloma [14, 15]. Our single-center design minimizes inter-institutional variability and access-related disparities seen in multisite cohorts [4, 5, 7], but captures only patients with access to specialized care and does not encompass broader social determinants of health.
By prioritizing rigor in matching over sample size, we isolated race as an independent variable under equivalent care. In this context, racial disparities in MM outcomes were negligible. Although our matched analysis may not represent the broader population, these findings underscore the need for systemic strategies that integrate clinical and socioeconomic factors and highlight the critical role of advanced diagnostics—such as molecular profiling and PET/MRI—in accurate risk stratification. Future multicenter efforts should adopt similar approaches to ensure all patients, regardless of race, receive optimal care and outcomes.
Supplementary information
Supplemental Index