Surface Structure Modulation of La0.6Sr0.4CoO3 Films on SrTiO3 (001) Substrate under Electrochemical Conditions
Atsuro Fujisawa, Xuhui Xu, Yuta Ishii, Hidekazu Shimotani, Yuta Inoue, Yuto Miyahara, Kohei Miyazaki, Yusuke Wakabayashi

TL;DR
This study investigates how the surface structure of a water-splitting catalyst changes under electrochemical conditions, affecting its performance.
Contribution
The paper reveals reversible structural changes in La0.6Sr0.4CoO3 films under electric potential, linking them to catalytic activity.
Findings
Electrochemical treatment adds an edge-shared CoO6 double layer to the surface.
Polarization in the SrCoO3 region decreases significantly after treatment.
Structural changes correlate with increased electrode current and catalytic activity.
Abstract
The surface structure of the La0.6Sr0.4CoO3 film, a typical model water-splitting catalyst, is examined under vacuum and electrochemical conditions using surface X-ray diffraction. The pristine sample has a two-unit-cell-thick strongly polarized SrCoO3 layer at the surface, and the surface termination is predominantly a CoO2 layer with apical oxygen atoms. After electrochemical treatment, the surface was covered with an additional edge-shared CoO6 double layer. The polarization in the SrCoO3 region was greatly reduced. These structural changes were accompanied by an increase in the working electrode current, suggesting a strong relationship between surface structure modulation and catalytic activity. Reversible structural modulation induced by the film’s electric potential was observed and was qualitatively understood as atomic displacements caused by the local electric field and change…
Genes, proteins, chemicals, diseases, species, mutations and cell lines named across the full text — each resolved to its canonical identifier and authoritative record.
Click any figure to enlarge with its caption.
 1
1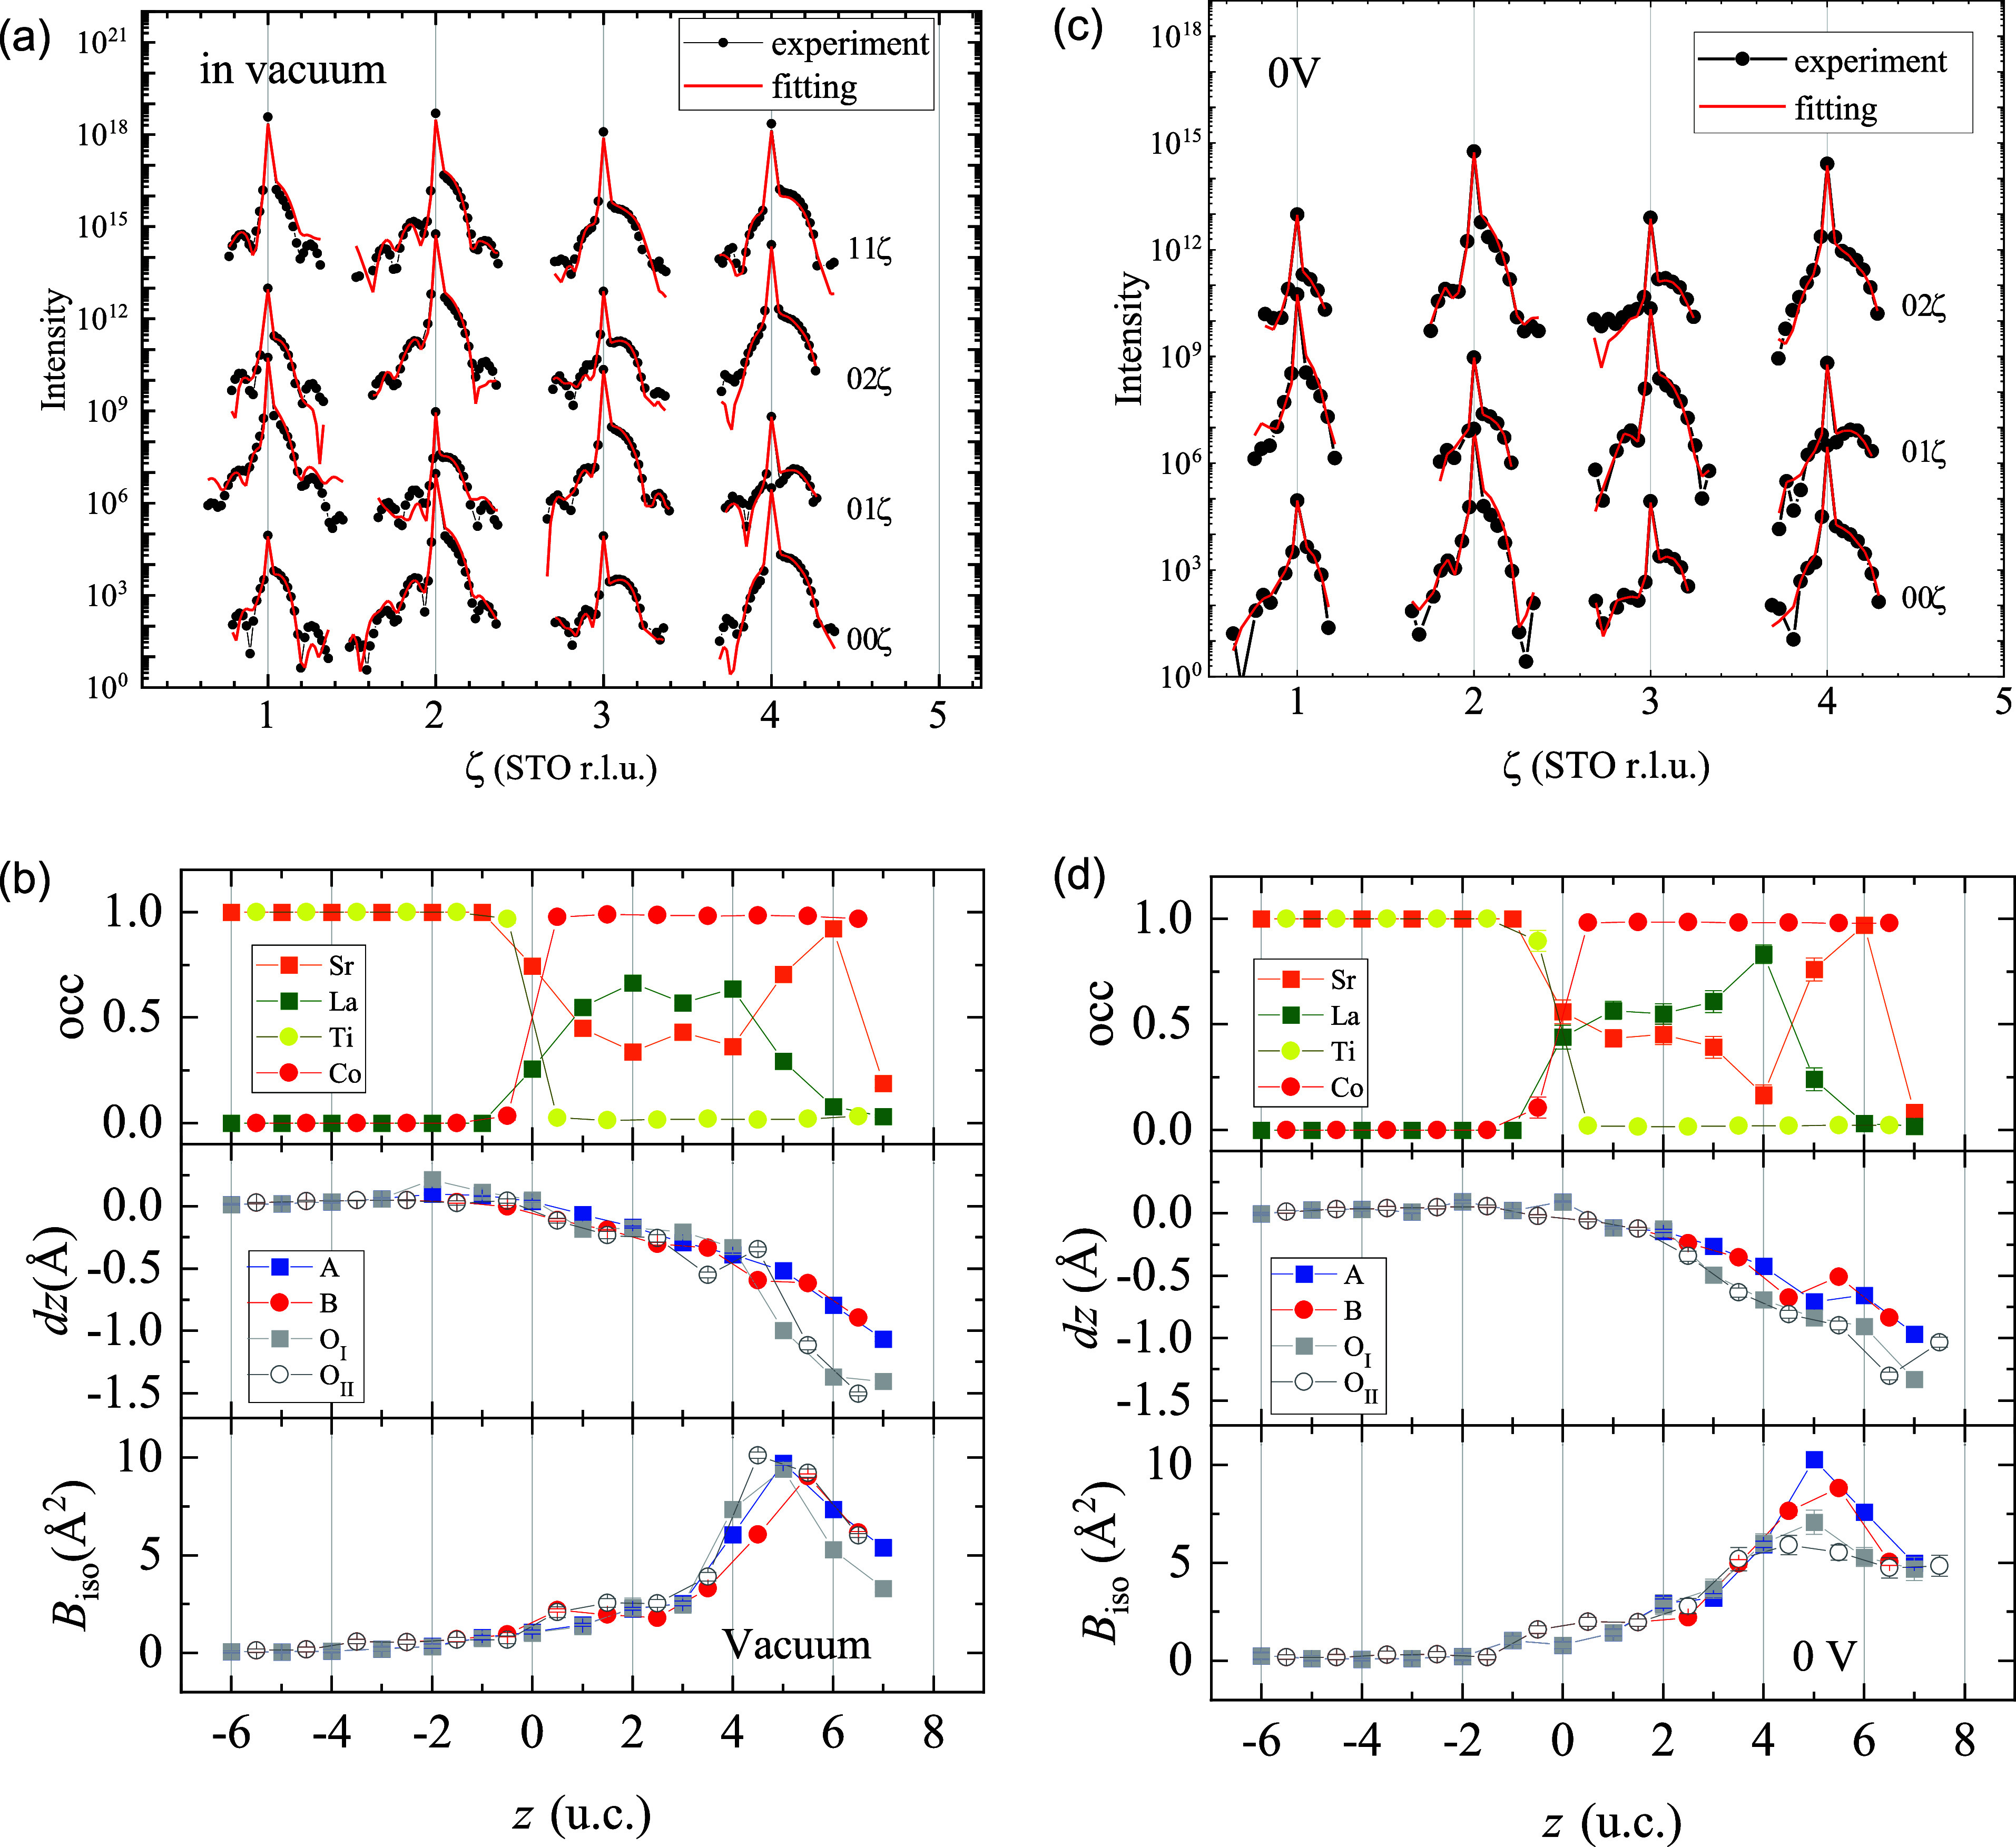 2
2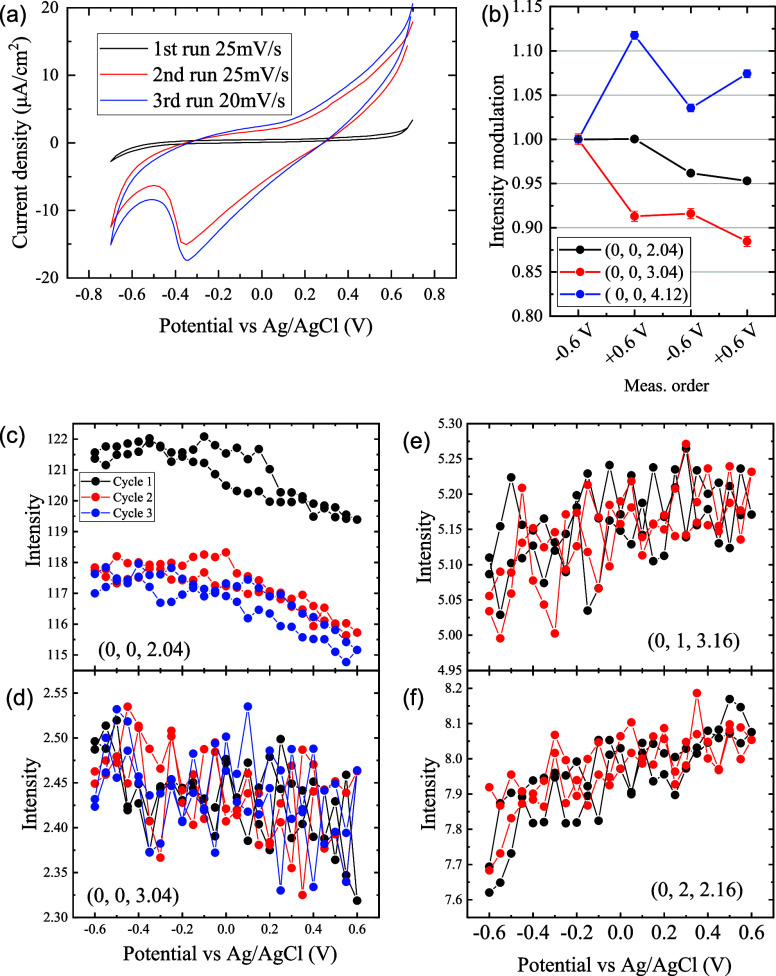 3
3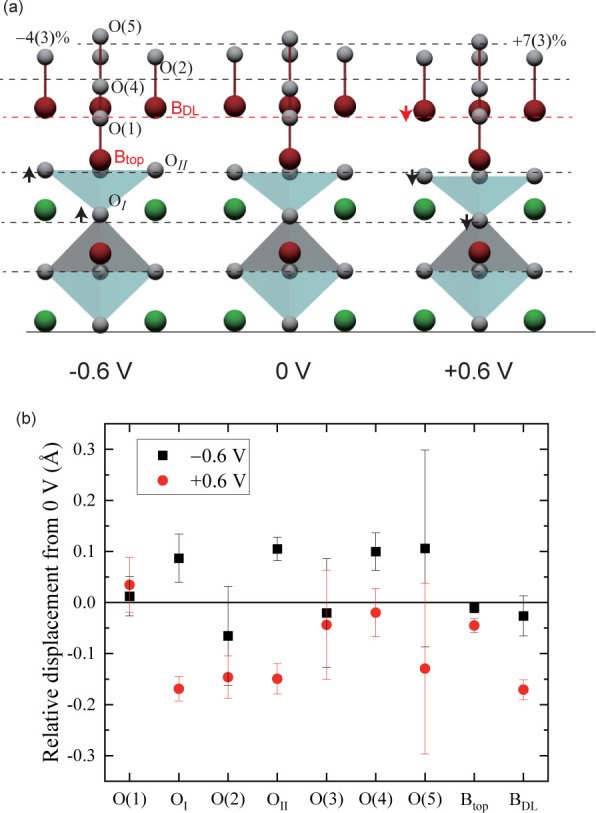 4
4| Parameter | vacuum | 0 V | –0.6 V | +0.6 V |
|---|---|---|---|---|
| occ O(1) | 0.99(1) | 0.93(5) | –0.02(2) | +0.03(2) |
| occ O(2) | – | 0.19(4) | –0.04(3) | +0.07(3) |
| occ O(4) | – | 0.65(8) | –0.10(8) | +0.04(6) |
| occ O(5) | – | 0.24(7) | +0.08(8) | –0.02(6) |
| occ BDL | 0.03(1) | 0.22(2) | +0.00(1) | +0.00(1) |
| occ As | 0.22(2) | 0.11(3) | +0.00(1) | +0.00(1) |
| Btop–BDL (Å) | – | 1.87(4) | –0.02(4) | –0.13(2) |
| Btop–O(1) (Å) | 1.44(4) | 1.46(4) | +0.02(4) | +0.08(6) |
| Btop–O
| 2.43(5) | 2.02(5) | –0.09(6) | +0.13(4) |
| BDL–O(2) (Å) | – | 1.84(7) | –0.04(14) | +0.02(6) |
| BDL–O
| – | 2.34(6) | –0.13(6) | –0.02(5) |
| O(1)–O(4) (Å) | – | 1.04(5) | +0.09(5) | –0.05(7) |
| O(1)–O(5) (Å) | – | 2.80(6) | +0.1(2) | –0.16(18) |
- —Japan Society for the Promotion of Science10.13039/501100001691
- —Japan Society for the Promotion of Science10.13039/501100001691
Peer Reviews
No public reviews on file for this paper yet. If you reviewed it on a platform where reviews are public (OpenReview, ICLR, NeurIPS, ICML), you can paste yours below so the community can read it here.
Videos
No videos yet. Explain this paper in a talk, walkthrough, or lecture? Add one.
Taxonomy
TopicsElectronic and Structural Properties of Oxides · Magnetic and transport properties of perovskites and related materials · Electrocatalysts for Energy Conversion
Introduction
1
Spontaneous mass transport sometimes plays a significant role in the properties of heterogeneous systems such as at surfaces and grain boundaries. Phase separation and proton conduction are typical examples of mass transport inside a material. In iron passivation, a classical example of chemical reactions at an interface, oxygen vacancies in the iron oxide layer flow toward the surface to make the passive layer thicker. ?−? ? ? Mass transport in the environment often controls the rate of various chemical reactions at solid–liquid interfaces by limiting the amount of reactant at the interfaces.
In water electrolysis in an alkaline environment, O_2_ is formed from abundant OH^–^, and therefore, the mass transport in the water side is completed immediately. In contrast, mass transport in the electrode side causes the widely observed activation and degradation of electrocatalysts. ?−? ? ? The surface structure is one of the important factors affecting the oxygen evolution reaction (OER) activity. ?−? ? ? ? The importance of the structural information is enhanced for oxides because the oxide structure reflects the electronic states, such as the bonding nature, valency, and orbital and spin states of cations. Oxide catalysts have been extensively studied because of their high environmental stability, including at high temperature, and high degree of freedom to control the chemical and electronic structures. ?,?,?−? ? ? ? Spontaneous mass transport causes unintended structural modulation. In addition, the OER at the oxide surface is assumed to involve lattice oxygen in the so-called lattice oxygen-mediated mechanism (LOM)? in which spontaneous mass flow plays an important role. Therefore, in situ structural measurements of oxide catalysts are required.
High-resolution surface structure analysis in controlled environments can be achieved using the crystal truncation rod (CTR) scattering method, a surface X-ray diffraction technique. ?,? Using this technique, the catalytic reactions have been examined at gas–noble metal ?−? ? and liquid–noble metal interfaces. ?−? ? Regarding oxide catalysts, rutile-type oxides have been studied in detail ?,?−? ? because part of the CTR signal from the rutile structure is solely from oxygen, ?,? which makes detailed structural analysis of the oxygen sublattice easier. However, perovskite (001) surfaces do not provide such a signal solely originating from oxygen, which hampers the detailed examination of surface oxygen positions in perovskite oxides under electrochemical conditions.
Recent advances in analytical methods have led to many reports of detailed structures of perovskite surfaces under vacuum conditions. ?−? ? ? ? ? ? Here, we report the surface structure of La_1–x Sr x CoO_3, an active water-splitting catalyst, before and during electrochemical treatment. For this compound, transmission electron microscopy at a vapor pressure of H_2_O of a few Pa, ex situ measurements of lattice parameters? and surface structure analysis based on CTR measurements under vacuum without any electrochemical treatment? have been reported. However, an in situ surface structure analysis is yet to be reported. We prepared an atomically flat thin film grown on an SrTiO_3_ (001) surface. Under vacuum, the surface was predominantly terminated by CoO_2_ planes with apical oxygen atoms on top of the Co sites. Time evolution of the surface structure was reported in the early stage of the electrochemical process, and once saturated, nearly half of the surface was covered with an additional CoO_2_ layer, i.e., CoO_2_ double-layer termination. The observed CoO_2_ double-layer structure has edge-shared CoO_6_ octahedra, and this favors oxy-hydroxide formation.? Additionally, the electric potential reversibly controls the surface structure, and this process involves surface polarization from oxygen displacement.
Methods
2
La_1–x Sr x CoO_3 epitaxial films were grown on Nb-doped SrTiO_3_ (001) substrates (10 × 10 × 0.5 mm) using pulsed laser deposition with an Nd:YAG laser. The wavelength, laser power, and repetition rate were 266 nm, 20 mJ, and 2 Hz, respectively. During deposition, the substrate temperature was kept at 600 °C.
The sample was mounted in a vacuum chamber or a sealed electrochemical cell (a schematic view of the cell is shown in Figure S6) filled with 0.1 mol/L KOH aqueous solution. Prior to the cell preparation, the solution was purged with N_2_ gas bubbled for 15 min. The electric potential V of the sample was controlled by a potentiostat relative to the Ag/AgCl reference electrode with 3 mol/L KCl aqueous solution. Throughout this paper, all potentials are quoted relative to the Ag/AgCl electrode.
CTR scattering measurements were performed at BL-4C at the Photon Factory, KEK, Japan. A synchrotron X-ray beam was monochromatized by a Si (111) double-crystal monochromator and focused on the sample by a bent cylindrical mirror. A standard four-circle diffractometer was installed on the beamline, and a small two-dimensional pixel array detector (XPAD-S70, imXpad, France) was attached on the 2θ-arm with double-slit optics. The measurements were carefully performed to minimize radiation damage under the electrochemical conditions. All measurements were performed at room temperature.
Quantitative analysis of the CTR intensity profiles was performed using the Bayesian analysis software CTR-structure. ?,? In this study, we took the topmost CoO_2_ plane as the origin of the phasing and assumed a Gaussian distribution of the surface height so that the detailed surface structure could be discriminated from the surface roughness (see Section of the Supporting Information for more details on the diffraction theory). The sample structure was characterized under vacuum with a standard procedure reported elsewhere.? Only a subtle modulation of the surface structure was expected to be induced by the applied potential. Therefore, quantitative analysis was performed on the ratio of the intensity modulation caused by the potential; the idea is similar to that for the observation of the electric double layer based on the X-ray reflectivity measurement.?
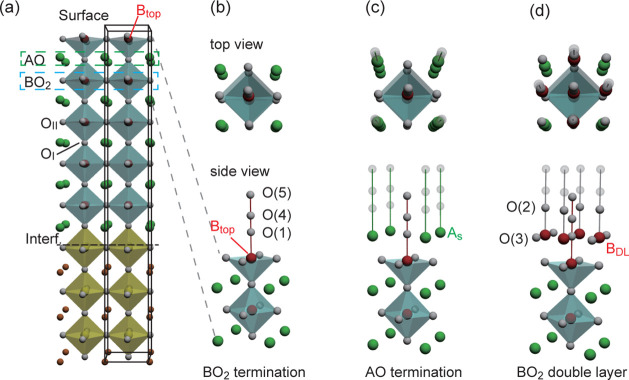
The surface structure model that we constructed is presented in Figure. The (001) surface of the perovskite structure can have BO_2_ termination or AO termination. The occupancy parameters of the atoms up to the surface BO_2_ layer (the atoms presented in Figurea) are fixed to unity. The topmost Co site among the fully occupied sites is labeled B_top_ as shown in Figure. Oxygen sites in the AO plane and BO_2_ plane are called the O_ I _ and the O_ II _ sites, respectively. The surface structure models are presented in (b)–(d). On top of the B_top_O_2_ layer, we assumed there was an AO plane (O(1) and A_s_ in (c)), a BO_2_ double-layer structure (O(3) and B_DL_ in (d)), and additional oxygen with reduced occupancy parameters. The surface model structure shown in (d), the BO_2_ double-layer model was constructed based on the reported surface structure of SrTiO_3_;? only half of B_DL_ and O(2), which is the apical oxygen to the B_DL_ site, are occupied to maintain the stoichiometry in the ideal BO_2_ double-layer termination structure (see Section and Figure S1 of the Supporting Information). The distances of O(1)–O(4) and O(1)–O(5) are ∼1.2 Å and ∼2.7 Å, which are the covalent bond length of O–O and the hydrogen bond length of OH–O, respectively. The other transparent spheres in Figurec,d show the assumed oxygen atom positions, and their occupancy was less than 10% under any conditions in this study. The O(3) position overlaps A_s_, thus, quantitative discussion on the O(3) site is impossible.
Surface structure model used in this study. Yellow and blue octahedra show TiO6 and CoO6 octahedra. Green, red, and white spheres in (b)–(d) show the A-site, B-site, and oxygen atoms, respectively. The occupancy parameters of the atoms up to the BtopO5 pyramid are unity. (a) Overall structure of the film. The structural parameters for the atoms within the pillar shown by the black frame are refined: (b) BO2 termination, (c) AO termination, and (d) BO2 double-layer termination models. Transparent spheres show the assumed oxygen atom positions, and their occupancy was less than 10%.
The measurements were carried out in the order (i) under-vacuum CTR (Figurea), (ii) cyclic voltammetry (CV) first run (Figurea), (iii) time evolution of CTR (Figureb), (iv) potential dependence measurements of CTR at several selected scattering vectors (Figurec–f), (v) CV second run (Figurea), (vi) in situ CTR for surface structure analysis (Figurec), and (vii) CV third run (Figurea). The time dependence of the potential and working electrode current is presented in Figure S5.
(a) CTR intensity profiles measured under vacuum together with the result of fitting. (b) Depth profile of the obtained structural parameters in the pillar (Figure a). z = 7 shows the parameters for the A s and O(1) sites. (c) CTR intensity profiles in the KOH aqueous solution at 0 V. (d) Obtained structural parameters in the pillar for 0 V data. Structural parameters at the surface (Figure b–d) are listed in Table .
(a) Results of the CV measurements. Initial (1 st run), 1.5 days later (2 nd run), and 2.3 days later (3 rd run). (b) Time evolution of the intensity with switching potential. (c)–(f) XCV profiles measured at (0, 0, 2.04), (0, 0, 3.04), (0, 1, 3.16), and (0, 2, 2.16).
Results and Analysis
3
Under-Vacuum Structure
3.1
The CTR intensity profiles measured on hkζ-lines under vacuum are presented in Figurea together with the results of Bayesian analysis. The obtained structural parameters are presented in Figureb. The horizontal axis shows the depth, and the vertical axes show the occupancy, atomic displacement with respect to the substrate lattice dz, and isotropic atomic displacement parameter B iso. The thickness of the film is nearly 7 unit cells, and the Sr concentration for the A-site is 0.4 in the middle of the film, and nearly 1 at the surface. The Sr segregation at the surface was also confirmed by the analysis using the Sr K-absorption edge (see Section of the Supporting Information). In the Sr-concentrated region (z ≥ 5), the cations are displaced outward from the oxygen atoms as shown in the dz profiles in Figureb, meaning that there is electric polarization (or an electric field) at the surface. In the middle of the film, in the La_0.6_Sr_0.4_CoO_3_ region, the relative displacement of the cations and anions disappears, indicating that the inside of the film is metallic. The parameter B iso is a measure of the positional fluctuation of each atom from the in-plane lattice-averaged position. In defect-free crystalline samples, B iso represents the amplitude of thermal vibrations and its typical value at room temperature is 0.5 Å^2^. In thin-film specimens, it often primarily reflects disorder arising from lattice defects and atomic intermixing and can reach relatively large values, on the order of 5 Å^2^. ?,? The B iso parameters greatly increase around z = 5, which coincides with the interface between La_0.6_Sr_0.4_CoO_3_ and SrCoO_3_ formed by the Sr segregation.
Other structural parameters for the atoms close to the surface are given in Table. The A_s_ and B_DL_ occupancies were 22(2)% and 3(1)%, respectively, which means that 72(4)% of the as-grown surface is BO_2_ termination (Figureb). The O(1) occupancy is 99(1)%, meaning that the Co at the surface is octahedrally coordinated.
1: Selected Surface Structure Parameters for Vacuum and 0 V Conditions
Potential Dependence of the Surface Structure
3.2
The CV results are listed in Figurea. The potential range of the CV measurement was carefully selected to avoid bubble formation caused by the large currents. If bubbles form on the electrode surface due to water electrolysis, they remain on the surface because the cell is sealed. This alters the amount of water in the X-ray path, leading to changes in absorption and a significant increase in signal intensity. These variations would not only prevent reliable data analysis but also make it difficult to maintain liquid contact with the sample surface. Note that the vertical axis in the voltammogram spans a very narrow range. For the pristine sample, the voltammogram shows few features except for an increase in the current at +0.7 V, on the OER side, and −0.7 V, on the oxygen reduction reaction (ORR) side. Based on this profile, we examined the surface structure at 0 V and ± 0.6 V. After 1.5 days of X-ray measurements, CV was recorded again, and the current was greatly increased. A similar change in CV caused by electrochemical operation was also reported in ref. ?; they attributed the increase in current as a formation of an active electrode surface under OER conditions. Quantitatively, it was reported that the working electrode current is suppressed in ultrathin films.? The overall feature of the CV remains unchanged until the end of the experiment (2.3 days from the first CV measurement, third run). The time evolution of the working electrode current during the experiment is presented in Figure S5. There was no detectable change in the working electrode current caused by X-ray irradiation in these measurements, indicating that the photochemical reaction is negligible
Figureb shows the time evolution of the CTR intensity measured at (0, 0, 2.04), (0, 0, 3.04), and (0, 0, 4.12). The measurement was done in the order of −0.6, + 0.6, −0.6, and +0.6 V. The intensity depends on both the time and potential, and the dependency varies as a function of the scattering vector. The potential dependence is further examined by measuring the intensity as a function of potential at a fixed scattering vector; we call such measurements as XCV measurements. XCV profiles measured at (0, 0, 2.04), (0, 0, 3.04), (0, 1, 3.16), and (0, 2, 2.16) are presented in Figurec–f. Reproducible potential dependence of the intensity and, therefore, the surface structure was observed. Only the first XCV cycle at (0, 0, 2.04) differs from the second and third cycles, showing that the time evolution of the surface structure stops during this XCV measurement.
We performed surface structure analysis on the 0 V data measured after the XCV measurements. The second run of the CV measurement shown in Figurea was conducted just before the CTR measurement at 0 V. The results are presented in Figurec,d and Table. The overall feature of the film structure shown in Figured is similar to that of the under-vacuum structure (Figureb). There is no observable change in the c-lattice spacing within the film region. This stands in contrast to previous ex situ lattice spacing measurements of thick films before and after electrochemical treatment,? which reported clear lattice expansion. In that study, long-term operation was carried out until the end of the electrode’s lifetime, and lattice parameter changes were observed in the deactivated sample. The slight change in lattice spacing in the present case suggests that the damage responsible for catalytic deactivation is minor. The z positions of oxygen in the Sr-concentrated region are close to those of the cations at 0 V, meaning that the surface polarization observed under vacuum is reduced. This structural change is shown in Figureb,d and in Table (B_top_–O_ I _ of the Supporting Information). The occupancy of A_s_ and B_DL_ was 11(3)% and 22(2)%, respectively. This result means that BO_2_ double-layer termination, which was effectively not found in the under-vacuum measurement, covers 44% of the surface (note that the maximum occupancy parameters of B_DL_ and O(2) sites in the BO_2_ double-layer surface are 0.5, see Section). The occupancy of O(2) was comparable to that of B_DL_, meaning that most B_DL_ sites are octahedrally coordinated.
The observed intensity modulation induced by the applied potential is typically smaller than 5% (see Figure S4) and therefore, when we plot the intensity measured at ± 0.6 V on the log scale, the results completely overlap with the 0 V result shown in Figurec. It should be noted that the typical uncertainty of the CTR intensity distribution is 20%,? which is mainly caused by optical misalignment. This uncertainty is apparent when comparing the intensity between two distant Q points. The uncertainty for the intensity measured at the same Q point is much smaller, as shown in the XCV measurements. To derive the structural modulation caused by the applied potential, we calculated corrected intensity :
where denotes the measured intensity at potential V, and denotes the calculated intensity based on the obtained 0 V structure. The prefactor corrects the -dependent error caused by the optical misalignment; is free from the uncertainty caused by optical misalignment, which allows us to examine the effect of the potential on the film structure. The results of the Bayesian analysis performed for are nearly the same as those for the 0 V structure except for the top surface region. The relative change in the surface structure parameters from the 0 V structure is given in Table. Because the potential dependence of the CTR intensity is very small, the observed surface structural modulation induced by the potential is also minute.
The potential dependence of the surface structure is schematically presented in Figure. The oxygen displaces inward as the potential increases. In addition, B_DL_ ions also displace inward and the B_DL_–O(2) distance is unchanged. The O(2) occupancy increases. The structural parameters for the atoms inside are nearly independent of the potential.
(a) Schematic view of the potential (V vs Ag/AgCl electrode) dependence of the surface structure. Horizontal dashed lines are to guide the eye. (b) Relative atomic displacement with respect to the 0 V structure.
Discussion
4
First, the reliability of the analyzed structure is examined. The uncertainty of all structural parameters reported in this paper was estimated from the probability density distributions obtained via Bayesian inference based on the experimentally measured intensity profiles. As shown in Figurea, the CTR intensity profiles measured in vacuum span nearly the entire range along the rod direction. Although the signal near , where n is an integer, is generally too weak to detect, the intensity around (00ζ) with is observed almost continuously. Consequently, depth-sensitive structural information was obtained for all wavevectors within the Brillouin zone, allowing the Bayesian analysis to yield probability distributions for each structural parameter. In contrast, the CTR profiles measured at 0 V (Figurec) exhibit wide gaps near , resulting from X-ray absorption and increased background from the solution. These gaps lead to a loss of information associated with 2-fold periodic structures. Although this affects the reliability of the depth profile of the lattice spacings, the average spacing over two or more unit cells remains robust. The surface termination structure model is well localized in real space, and its corresponding information in reciprocal space is broadly distributed across a wide ζ range. Therefore, the derived surface termination structure is considered reliable. Potential-dependent structural changes were analyzed based on subtle intensity variations shown in Figure S4, where the gaps are wider than those in Figurec. These wide gaps result in the large parameter uncertainties shown in Figureb.
Next, we compare our result with the previously reported La_1–x Sr x CoO_3 film structure? (x = 0.2, under-vacuum measurement without any electrochemical treatment). Ref. ? reported Sr segregation at the surface, the formation of a LaCoO_3_ layer underneath the dense Sr layer, SrCoO_3_ particles on the surface, and surface polarization. The Sr segregation at the surface is observed in our work, meaning that Sr segregation is quite common in La_1–x Sr x CoO_3 film growth in the pulsed laser deposition process. Similar Sr segregation was also reported for La_1–x Sr x MnO_3 film.? The orientation of the surface polarization reported in ref. ? is opposite to what we observed. We found short B–O_ I _ on the surface side as shown in Figureb, while they reported this on the bulk side.
Local polarization at the oxide interface is controlled by the spatial distribution of the chemical species. For example, the local electric field at the interface between LaMnO_3_ and LaNiO_3_ points to LaNiO_3_.? In the present case, our sample and that reported in ref. ? have different spatial distribution of Sr. Our sample does not have a LaCoO_3_ layer underneath or SrCoO_3_ particles on top, which cause different local electric fields. There is no apparent polarization inside our film, which suggests metallic behavior in the middle of the film electrode.
In this study, a BO_2_ double-layer structure (Figured) was developed after 1.5 days of electrochemical treatment. B_DL_O_6_ octahedra are edge-shared with neighboring B_top_O_6_ octahedra.
Edge-shared structures have also been suggested in the electrochemically formed amorphous layer grown on the surface of the highly active catalyst Ba_0.5_Sr_0.5_Co_1–x _ . ?,? Thus, the catalytic activity of La_1–x Sr x CoO_3 may also be enhanced by the formation of this structure. The formation of the edge-shared BO_6_ octahedra structure affects the electronic energy levels and the degree of steric hindrance, which alters the catalytic activity.? With a support of noble metals, it favors oxy-hydroxide formation,? which helps OER at the surface. In the present case, the CV results show a considerable increase in the electric current (Figurea) after developing the BO_2_ double layer at the surface. A similar change in CV was also reported in ref. ?, in which redox activity was increased by forming an active surface under OER conditions. They attributed this increase in activity to the formation of CoO(OH) primarily based on the observation of two kinds of Co and O in the X-ray photoelectron spectra. Our observation exhibits the coexistence of edge-shared and corner-shared CoO_6_ octahedra, which involve two kinds of Co and O sites. It should also be noted that our results do not exclude the formation of Co–OH bonds, as X-ray diffraction is insensitive to hydrogen atoms.
The potential dependence of the atomic displacement presented in Figure is moderate. Increased potential causes inward atomic displacement. This tendency is in accordance with a simple view that a higher potential makes the electric field point outward, which results in the inward displacement of oxygen. The volume of B_top_O_6_ octahedra is increased by 8(±6)% when the potential is increased from −0.6 to +0.6 V. This volumetric change suggests that the Co ion valency is reduced ?,? or a higher spin state is stabilized? with applied potential. We expect a similar potential dependence for the B_DL_ site, but the large uncertainty in the obtained structural parameter does not allow us to confirm this.
Based on the CV results in Figurea, the BO_2_ double-layer termination surface has a larger double-layer capacity and an ORR peak at −0.3 V. The peak was attributed to oxygen intercalation.? Although oxygen intercalation may be observed through the structure, there was no detectable change in structure around −0.3 V; this is because of the tiny total amount of charge. The increase in capacity is usually attributed to an increase in surface area. However, this change in double-layer capacity is not caused by the increase in the surface area because the CTR results show little change in the surface roughness. The increase in the capacity corresponds to the space charge of ∼2 electrons per unit cell area around the interface. Some of this space charge is explained by the change in the B_top_ site valency and the O(2) occupancy discussed above. In addition, there is an expected change in the B_DL_ site valency and proton addition/removal should contribute, but this is not directly observed in our X-ray investigation. The voltammogram shows a positive slope after electrochemical treatments, which implies that the conductivity of the film increased. This change in conductivity was reflected in the structure, as evidenced by reduced polarization in the very surface region (5≤ z ≤ 7 in Figureb,d).
Enhanced B iso parameters around the surface (Figureb,d) can result from a random electric field caused by the local arrangement of La/Sr or vacancies. However, a large B iso parameter sometimes implies a reduced occupancy through the parameter coupling. If so, the enhanced B iso of O_ I _ and O_ II _ seen in Figureb suggests a large number of oxygen vacancies around the surface, which are filled during the electrochemical treatment. Such a migration of oxygen vacancies at the surface under electrochemical conditions suggests that the reaction process involves lattice oxygen at the surface, in accordance with the LOM. The reduction of surface polarization and oxygen B iso around the surface suggests active atomic flow around the surface in a 1 nm range induced by the electrochemical conditions. This finding gives an idea of the range and magnitude of the mass flow around the surface under electrochemical conditions.
Conclusion
5
The surface structure of the CoO_2_-terminated La_1–x Sr x CoO_3 film grown on SrTiO_3_ was examined under vacuum and electrochemical conditions. Sr segregation was found at the first two AO planes, forming an ultrathin SrCoO_3_ layer at the surface. This Sr segregation was stable under electrochemical treatment. The surface structure was modulated during the electrochemical treatment to form BO_2_ double-layer termination, which involves edge-shared CoO_6_ octahedra. Strong electric polarization was observed in the pristine sample and it was reduced under electrochemical conditions. The isotropic atomic displacement parameters B iso of the atoms in the range of 1 nm from the surface are considerably larger than those in the interior. This tendency is unchanged for cations under electrochemical treatment. For oxygen, in contrast, the increase in B iso at the surface is reduced after the formation of the BO_2_ double-layer surface. The reduction of surface polarization and oxygen B iso around the surface suggests active atomic flow in the range around 1 nm from the surface, induced by the electrochemical conditions.
Supplementary Material
The reference list from the paper itself. Each links out to its DOI / PubMed record.
- 1Chao C.Lin L.Macdonald D.A Point Defect Model for Anodic Passive Films I. Film Growth Kinetics J. Electrochem. Soc.19811281187119410.1149/1.2127591 · doi ↗
- 2Macdonald D. D.Urquidi-Macdonald M.Theory of Steady-State Passive Films J. Electrochem. Soc.19901372395240210.1149/1.2086949 · doi ↗
- 3Macdonald D.The history of the Point Defect Model for the passive state: A brief review of film growth aspects Electrochim. Acta 2011561761177210.1016/j.electacta.2010.11.005 · doi ↗
- 4Fujii H.Wakabayashi Y.Doi T.Early stages of iron anodic oxidation: Defective growth and density increase of oxide layer Phys. Rev. Mater.2020403340110.1103/Phys Rev Materials.4.033401 · doi ↗
- 5May K. J.Carlton C. E.Stoerzinger K. A.Risch M.Suntivich J.Lee Y.-L.Grimaud A.Shao-Horn Y.Influence of oxygen evolution during water oxidation on the surface of perovskite oxide catalysts J. Phys. Chem. Lett.201233264327010.1021/jz 301414 z · doi ↗
- 6Risch M.Grimaud A.May K. J.Stoerzinger K. A.Chen T. J.Mansour A. N.Shao-Horn Y.Structural changes of cobalt-based perovskites upon water oxidation investigated by EXAFSJ. Phys. Chem. C 20131178628863510.1021/jp 3126768 · doi ↗
- 7Samira S.Hong J.Camayang J. C. A.Sun K.Hoffman A. S.Bare S. R.Nikolla E.Dynamic Surface Reconstruction Unifies the Electrocatalytic Oxygen Evolution Performance of Nonstoichiometric Mixed Metal Oxides JACS Au 202112224224110.1021/jacsau.1c 0035934977894 PMC 8715492 · doi ↗ · pubmed ↗
- 8Weber M. L.Lole G.Kormanyos A.Schwiers A.Heymann L.Speck F. D.Meyer T.Dittmann R.Cherevko S.Jooss C.Baeumer C.Gunkel F.Atomistic Insights into Activation and Degradation of Electrocatalysts under Oxygen Evolution Conditions J. Am. Chem. Soc.2022144179661797910.1021/jacs.2c 0722636130265 PMC 9545157 · doi ↗ · pubmed ↗