The roles of serum Th1, Th2, and Th17 cytokines in patients with chronic urticaria: a systematic review and meta-analysis
Jingwen Xue, Chinghsuan Sun, Mai Shi, Bingyu Li, Yi Zhao

TL;DR
This study identifies elevated TNF-α and IL-17 cytokine levels in chronic urticaria patients, suggesting their potential use in diagnosing and assessing disease activity.
Contribution
The study is the first to systematically review and meta-analyze Th1, Th2, and Th17 cytokines in chronic urticaria, identifying TNF-α and IL-17 as significant biomarkers.
Findings
Serum TNF-α and IL-17 levels are significantly higher in chronic urticaria patients compared to healthy controls.
The meta-analysis included 50 studies reporting 22 cytokines related to Th1, Th2, and Th17 pathways.
Abstract
To conduct a systematic review and meta-analysis to identify Th1-, Th2, and Th17 related serum biomarkers that reflect disease activity in chronic urticaria (CU), thereby enhancing the assessment of disease activity in both trials and clinical practice. Systematic searches of PubMed, EMBASE, and Web of Science were conducted through November 2024 to identify articles reporting the associations between CU and serum biomarkers. Serum Th1, Th2, and Th17 related biomarkers were identified in CU patients and correlated with disease severity and patient characteristics (ex. Age, sex, and comorbidities). The study quality was assessed using the National Heart, Lung, and Blood Institute Quality Assessment Tool for case-control studies. Meta-analysis was performed using the random-effects model with Hedges' g to pool standardized mean differences (SMDs). For meta-analysis, data were included…
Genes, proteins, chemicals, diseases, species, mutations and cell lines named across the full text — each resolved to its canonical identifier and authoritative record.
Click any figure to enlarge with its caption.
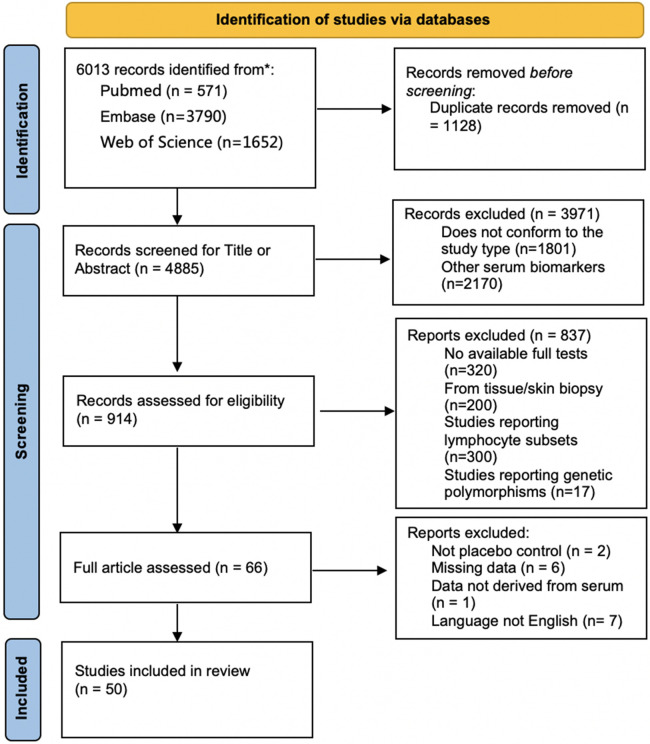 Figure 1
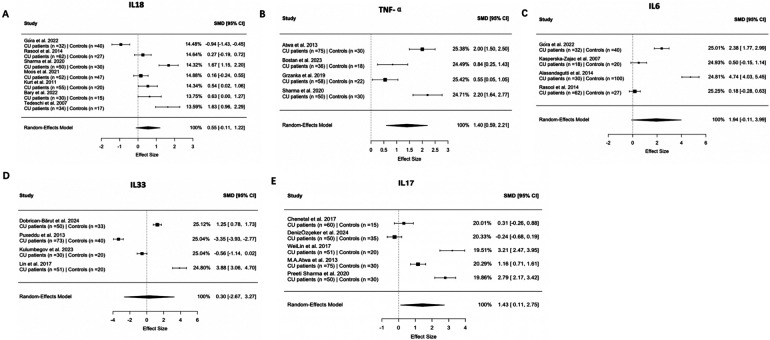 Figure 2
| Th1 Cytokines | Study (author-yr) | Overall association | Sample size of CU patients | Sample size of controls | Value in CU patients (mean ± SD) pg/ml/ | Value in controls (mean ± SD) pg/ml | Age of CU patients (mean ± SD, yrs) | Age of controls (mean ± SD, yrs) | Country |
|---|---|---|---|---|---|---|---|---|---|
| IL-1β | Santos et al. ( | Increased | 29 | 33 | NA( | NA | 42.5 (20–66) | 35.5 (23–57) | Brazil |
| IL-2 | Piconi et al. ( | No association | 19 | 15 | NA | NA | 39.15 (23–61) | 38.7 (23–54) | Italy |
| IL-2 | Chen et al. ( | Increased | 15 | 747.4 (414.2–1,205.7)/0.001 | 424.7 (218.3–545.2) | NA | 24.6 (22–29) | China | |
| IL-2 | Grieco et al. ( | No association | 8 | 4 | 4.8/NA | NA | 57 ± 4 | 40 ± 8 | Italy |
| IL-12 | Petrola et al. ( | Increased | 20 | 30 | 17.7 pgr/ml, | 0 pgr/ml | 33.0 (6 14.8) | NA | Venezuela |
| IL-12 | Ene et al. ( | Increased | 42 | 40 | 38.0 ± 14.1( | 17.9 ± 4.7 | 31.3 | 29.8 | Romania |
| IL-12 | Santos et al. ( | Increased | 29 | 33 | NA( | NA | 42.5 (20–66) | 35.5 (23–57) | Brazil |
| IL-18 | Gora et al. ( | Decreased | 32 | 40 | 115.8 (102.5–129.5)/<0.001 (115.9424 ± 20.9529) | 133.25 (122.95–142.15) (132.7532 ± 14.7635) | 11.21 (8–14.42) | 11 (7–14) | Poland |
| IL-18 | Rasool et al. ( | No association | 62 | 27 | 62.95 ± 36.09/0.24 | 54.35 ± 18.45 | 28 (7–65) | NA | India |
| IL-18 | Sharma et al. ( | Increased | 50 | 30 | 501.41 ± 208.98, | 218.39 ± 39.83 | 33.84 ± 6.816 | 33.20 ± 7.014 | India |
| IL-18 | Moos et al. ( | No association | 52 | 47 | 33.68 (30.92–38.47), | 32.72 (31.13–36.76) (33.5877 ± 4.3055) | 40.6 ± 12.4 (19–68) | 41.6 ± 12.1 (19–64) | Poland |
| IL-18 | Varghese et al. ( | Increased | 45 | 45 | 144.3 (118.4–197.3), | 104.3 (89.0–115.8) | 35.91 (9.30), | 35.04 (9.20) | India |
| IL-18 | Kurt et al. ( | Increased | 55 | 20 | 290.0 ± 178.2, | 202.2 ± 96.8 | 40.3 ± 12.3 | 37.7 ± 9.8 | Turkey |
| IL-18 | Bary et al. ( | Increased | 30 | 15 | 214.9 ± 167.3 pg/ml, | 115.6 ± 121.1 pg/ml | 35.70 ± 13.87 (16–81) | NA | Egypt |
| IL-18 | Tedeschi et al. ( | No association | 34 | 17 | 246.47 ± 18.40 pg⁄ml, NS | 213.88 ± 22.24 pg⁄ml | 45.9 ± 2.6 years | 43.9 ± 3.3 | Italy |
| IL-18 | Puxeddu et al. ( | Increased | 73 | 40 | NA ( | NA | 41 ± 16, (14–89) | 50 ± 5, (25–89) | Italy |
| TNF-α | Chen et al. ( | Increased | 60 | 15 | 1.6 (0.8–99.1)/0.004 | 0.0 (0.0–0.0) | NA | 24.6 (22–29) | China |
| TNF-α | Tekin et al. ( | No association | 31 | 56 | 59.57 (35.51–500.46)/NA | 64.83 (32.84–613.41) | NA | NA | Turkey |
| TNF-α | Trinh et al. ( | Increased | 191 | 89 | NA | NA | 40 (19–60) | 38 (26–54) | Korea |
| TNF-α | Grieco et al. ( | No association | 8 | 4 | 9.11/NA | NA | 57 ± 4 | 40 ± 8 | Italy |
| TNF-α | Atwa et al. ( | Increased | 75 | 30 | 17.93 ± 6.05, | 6.87 ± 3.73 | 31.8 ± 10.3 | 29.7 ± 9.1 | Egypt |
| TNF-α | Bostan et al. ( | Increased | 36 | 18 | 156.7 (33.08–392), | 1.8 (1.5–2.91) (2.0923 ± 1.1343) | 38.5 ± 11.9 | 38 (30–47) | Turkey |
| TNF-α | Tedeschi et al. ( | No association | 40 | 12 | NA | NA | NA | NA | Italy |
| TNF-α | Grzanka et al. ( | Increased | 58 | 22 | 18.25 (17.04–19.62), | 16.89 (16.45–18.40) (17.274 ± 1.5454) | 39 (21–45) | NA | Poland |
| TNF-α | Sharma et al. ( | Increased | 50 | 30 | 455.54 ± 253.54, | 8.498 ± 3.644 | 33.84 ± 6.816 | 33.20 ± 7.014 | India |
| TNF-α | Santos et al. ( | Increased | 29 | 33 | NA( | NA | 42.5 (20–66) | 35.5 (23–57) | Brazil |
| TNF-α | Piconi et al. ( | Increased | 19 | 15 | NA(CIU vs. HCs, | NA | 39.15 (23–61) | 38.7 (23–54) | Italy |
| IFN-γ | Chen et al. ( | Increased | 60 | 15 | 368.9 (223.5–433.5)/0.004 | 250.8 (19.6–404.8) | NA | 24.6 (22–29) | China |
| IFN-γ | Caproni et al. ( | No association | 68 | 20 | NA | 2.4 ± 2.2 | 43 (19–81) | 39 (21–74) | Italy |
| IFN-γ | Grieco et al. ( | Increased | 8 | 4 | 8.37/<0.05 | NA | 57 ± 4 | 40 ± 8 | Italy |
| IFN-γ | Piconi et al. ( | No association | 19 | 15 | NA | NA | 39.15 (23–61) | 38.7 (23–54) | Italy |
| IFN-γ | Alasandagutti et al. ( | Increased | 30 | 100 | 80.762 ± 62.056/<0.0001 | 24.79 ± 21.84 | 34.1 | NA | India |
| Th2 Cytokines | Study (author-yr) | Overall association | Sample size of CU patients | Sample size of controls | Value in CU patients(mean ± SD) pg/ml/ | Value in controls(mean ± SD) pg/ml | Age of CU patients(mean ± SD, yrs) | Age of controls(mean ± SD, yrs) | Country |
|---|---|---|---|---|---|---|---|---|---|
| IL-4 | Degirmenci et al. ( | Decreased | 40 | 20 | NA/0.04 | NA | 38.2 ± 10.4 | 36.5 ± 5.45 | Turkey |
| IL-4 | Chen et al. ( | No association | 60 | 15 | 3.1 (1.5–7.6)/0.021 | 2.2 (0.5–3.9) | NA | 24.6 (22–29) | China |
| IL-4 | Hoşgören-Tekin et al. ( | Decreased | 31 | 56 | 101.1 (57.8–418.6)/0.001 | 138.85 (70.5–508.4) | NA | NA | Turkey |
| IL-4 | Ferrer et al. ( | Increased | 60 | 25 | 1.03/0.028 | 0.2 | 44.39 ± 2.91 | 40 ± 6.49 | USA |
| IL-4 | Caproni et al. ( | No association | 68 | 20 | NA | 0.01 ± 0.06 | 43 (19–81) | 39 (21–74) | Italy |
| IL-4 | Grieco et al. ( | No association | 8 | 4 | 0.04/NA | NA | 57 ± 4 | 40 ± 8 | Italy |
| IL-4 | Mohamed et al. ( | Increased | 25 | 10 | 18,300 ± 14,700/0.008 | 5,100 ± 4,100 | NA | NA | Egypt |
| IL-4 | Zheng et al. ( | No association | 28 | 28 | NA/>0.05 | NA | 35.6 ± 6.1 | 35.8 ± 7.9 | China |
| IL-5 | Chen et al. ( | Increased | 60 | 15 | 8.5 (5.6–18.6)/0.018 | 5.6 (2.6–9.5) | NA | 24.6 (22–29) | China |
| IL-5 | Hoşgören-Tekin et al. ( | No association | 31 | 56 | 61.65 (34.1–471.4)/NA | 73.1 (30.9–660.3) | NA | NA | Turkey |
| IL-6 | Chen et al. ( | Increased | 60 | 15 | 167.0 (126.6–261.2)/0.004 | 107.8 (29.4–171.6) | NA | 24.6 (22–29) | China |
| IL-6 | Trinh et al. ( | Increased | 191 | 89 | NA | NA | 40 (19–60) | 38 (26–54) | Korea |
| IL-6 | ´Gora et al. ( | Increased | 32 | 40 | 13.91 (11.32–15.71)/<0.001(13.6,287 ± 3.4068) | 7.42 (6.21–8.45)(7.3561 ± 1.7224) | 11.21 (8–14.42) | 11 (7–14) | Poland |
| IL-6 | Ucmak et al. ( | Increased | 50 | 33 | 46.57/<0.001 | 20.34 | 35 (18–55) | 36 (20–60) | Turkey |
| IL-6 | Amin et al. ( | Increased | 40 | 40 | NA/<0.001 | NA | NA | NA | Egypt |
| IL-6 | Grieco et al. ( | Increased | 8 | 4 | 6.2/<0.05 | NA | 57 ± 4 | 40 ± 8 | Italy |
| IL-6 | Kasperska-Zajac et al. ( | Increased | 58 | 22 | 3.32/<0.0001 | 0.69 | 38 (24–52) | NA | Poland |
| IL-6 | Grzanka et al. ( | Increased | 58 | 22 | 3.95 (1.98–9.2)/<0.0001 | 1.0 (0.43–1.58) | 39 (21–45) | NA | Poland |
| IL-6 | Valerieva et al. ( | Increased | 45 | NA | 1.91 ± 0.50/<0.001 | 0.03 ± 0.02 | NA | NA | Bulgaria |
| IL-6 | Kasperska-Zajac et al. ( | Increased | 8 | 20 | NA/0.0026 | NA | 37 (28–43) | NA | Poland |
| IL-6 | Kasperska-Zajac et al. ( | Increased | 18 | 20 | 1 (0.12–2.22)/0.033(1.1227 ± 1.6894) | 0.39 (0.05–0.97)(0.4763 ± 0.734) | 30.5 (19–37) | NA | Poland |
| IL-6 | Kasperska-Zajac et al. ( | Increased | 58 | 30 | 1.85/<0.001 | 1.1 | 40 | NA | Poland |
| IL-6 | Rajappa et al. ( | Increased | 45 | 45 | NA/<0.0001 | NA | NA | NA | India |
| IL-6 | Alasandagutti et al. ( | Increased | 30 | 100 | 39.37 ± 11.06/<0.0001 | 7.175 ± 4.81 | 34.1 | NA | India |
| IL-6 | Rasool et al. ( | No association | 62 | 27 | 0.82 ± 4.6/0.44 | 0.12 ± 1.7 | 28 (7–65) | NA | India |
| IL-6 | Grzanka et al. ( | No association | 17 | 16 | 11.64 (10.34–11.93)/<0.0001 | 4.95 (4.05–5.7) | 42 (29–45) | NA | Poland |
| IL-6 | Bostan et al. ( | No association | 36 | 18 | 1.37 (0.90–3.93) | 1.0 (0.7–1.6) | 38.5 ± 11.9 | 38 (30–47) | Turkey |
| IL-6 | Santos et al. ( | Increased | 29 | 33 | NA( | NA | 42.5 (20–66) | 35.5 (23–57) | Brazil |
| IL-9 | Bhatia et al. ( | No association | 95 | 42 | 1,607 ± 1,182.5/0.082 | 1,838.70 ± 929.89 | 33.77 ± 8.07 | NA | India |
| IL-9 | Zheng et al. ( | No association | 28 | 28 | NA/>0.05 | NA | 35.6 ± 6.1 | 35.8 ± 7.9 | China |
| IL-10 | Degirmenci et al. ( | Decreased | 40 | 20 | NA/0.04 | NA | 38.2 ± 10.4 | 36.5 ± 5.45 | Turkey |
| IL-10 | Chen et al. ( | No association | 60 | 15 | 3.1 (2.4–5.8)/NA | 3.0 (1.2–5.2) | NA | 24.6 (22–29) | China |
| IL-10 | Hoşgören-Tekin et al. ( | No association | 31 | 56 | 113.57 (73.24–738.31)/NA | 119.52 (77.82–782.9) | NA | NA | Turkey |
| IL-10 | Trinh et al. ( | Increased | 191 | 89 | NA | NA | 40 (19–60) | 38 (26–54) | Korea |
| IL-10 | Grieco et al. ( | No association | 8 | 4 | 11.01/NA | NA | 57 ± 4 | 40 ± 8 | Italy |
| IL-10 | Valerieva et al. ( | Increased | 45 | NA | 5.91 ± 0.48/<0.001 | 0.86 ± 0.51 | NA | NA | Bulgaria |
| IL-10 | Moos et al. ( | Increased | 52 | 47 | 4.25 (2.57–5.49), | 3.36 (1.59–4.25) | 40.6 ± 12.4 (19- 68) | 41.6 ± 12.1 (19- 64) | Poland |
| IL-10 | Santos et al. ( | Increased | 29 | 33 | NA( | NA | 42.5 (20–66) | 35.5 (23–57) | Brazil |
| IL-10 | Piconi et al. ( | Increased | 19 | 15 | NA(CIU vs.HCs, | NA | 39.15 (23–61) | 38.7 (23–54) | Italy |
| IL-13 | Chen et al. ( | Increased | 60 | 15 | 19.6 (13.6–31.2)/0.008 | 15.0 (8.1–19.7) | NA | 24.6 (22–29) | China |
| IL-13 | Hoşgören-Tekin et al. ( | No association | 31 | 56 | 9.3 (5.80–58.47)/NA | 9.61 (5.22–55.82) | NA | NA | Turkey |
| IL-13 | Bae et al. ( | Increased | 84 | 43 | 508.5 ± 51.2/0.001 | 200.7 ± 13.3 | 38.2 ± 12.7 | 30.4 ± 9.3 | Korea |
| IL-13 | Caproni et al. ( | Increased | 68 | 20 | NA | 2.4 ± 2.2 | 43 (19–81) | 39 (21–74) | Italy |
| IL-24 | Laurence de Montjoye et al. ( | Increased | 69 | 23 | NA, | NA | NA | NA | Belgium |
| IL-31 | Lin et al. ( | Increased | 51 | 20 | 27.79 ± 3.02 ng/L, | 18.78 ± 1.71 ng/L | 28 ± 13, | 32 ± 14 | China |
| IL-31 | Bostan et al. ( | No association | 36 | 18 | 743.2 (121.3–3,447) | 213.1 (9–633.6) | 38.5 ± 11.9 | 38 (30–47) | Turkey |
| IL-31 | Boyvadoglu et al. ( | Decreased | 30 | 20 | 65.30 (46.39–89.14), | 169.57 (115.8–237.27)(174.5813 ± 96.9144) | 39.83 ± 11.67, | 31.85 ± 6.77 | Turkey |
| IL-31 | Băruta et al. ( | Increased | 50 | 38 | NA, | NA | 50.14 ± 16.10 | 44.32 ± 9.23 | Romania |
| IL-31 | Raap et al. ( | Increased | 46 | 26 | NA, | NA | NA | 43.8 ± 16.5 | Germany |
| IL-31 | Chaowattanapanit et al. ( | Increased | 65 | 31 | (252.4 ± 115.5, | 36.3 ± 10.7 pg/ml | 43 ± 15 | 44 ± 18 | Thailand |
| IL-31 | Hoşgören-Tekin et al. ( | No association | 31 | 56 | 43.69 (18.23–298.67)/NA | 47.33 (24.99–436.21) | NA | NA | Turkey |
| IL-33 | Băruta et al. ( | Increased | 50 | 33 | 220.67 ± 201.17, | 21.70 ± 22.68 | 50.14 ± 16.10 | 44.32 ± 9.23 | Romania |
| IL-33 | Puxeddu et al. ( | No association | 73 | 40 | 575.3 ± 105.6, NS | 1,189 ± 271.5 | 41 ± 16, (14–89) | 50 ± 5,(25–89) | Italy |
| IL-33 | Kulumbegov et al. ( | No association | 30 | 20 | 29.74 ± 5.02, | 33.2 ± 7.43 | 37.6 ± 17.57 | 44.45 ± 14.83 | Israel |
| IL-33 | Lin et al. ( | Increased | 51 | 20 | 45.53 ± 4.32 ng/L, | 30.09 ± 2.69 ng/L | 28 ± 13, | 32 ± 14 | China |
| IL-33 | Hoşgören-Tekin et al. ( | Decreased | 31 | 56 | 154.89 (85.82–1,142.36)/0.038 | 200.53 (108.78–1,381.42) | NA | NA | Turkey |
| IL-33 | Valerieva et al. ( | Decreased | 45 | NA | 0.89 ± 0.41/0.005 | 5.04 ± 1.02 | NA | NA | Bulgaria |
| IL-33 | Zheng et al. ( | No association | 28 | 28 | NA/>0.05 | NA | 35.6 ± 6.1 | 35.8 ± 7.9 | China |
| Th17 Cytokines | Study (author-yr) | Overall association | Sample size of CU patients | Sample size of controls | Value in CU patients(mean ± SD) pg/ml/ | Value in controls(mean ± SD) pg/ml | Age of CU patients(mean ± SD, yrs) | Age of controls(mean ± SD, yrs) | Country |
|---|---|---|---|---|---|---|---|---|---|
| IL-17 | Chen et al. ( | No association | 60 | 15 | 1.3 (0.4–2.7)/NA(1.4766 ± 1.747) | 0.6 (0.0–2.1)(0.9267 ± 1.7176) | NA | 24.6 (22–29) | China |
| IL-17 | Özçeker et al. ( | No association | 50 | 35 | 3.98 ± 3.88/3.1 (2.6–4.6), | 4.85 ± 2.96/3.9 (3.0–6.3) | NA | NA | Turkey |
| IL-17 | Moghadam K et al. ( | Increased | 60 | 30 | NA | 209.47(sd:106.55) | NA | NA | Iran |
| IL-17 | Bostan et al. ( | No association | 36 | 18 | 47.7 (8.2–268.8) | 100 (15.8–639) | 38.5 ± 11.9 | 38 (30–47) | Turkey |
| IL-17 | Lin et al. ( | Increased | 51 | 20 | 256.71 ± 25.07 ng/L, | 181.79 ± 16.62 | 28 ± 13, | 32 ± 14 | China |
| IL-17 | Atwa et al. ( | Increased | 75 | 30 | 35.51 ± 31.14 pg/ml, | 4.60 ± 1.38 | 31.8 ± 10.3 | 29.7 ± 9.1 | Egypt |
| IL-17 | Grzanka et al. ( | Increased | 52 | 21 | 21.97 (20.92–24.98/18.85–62.73) pg/ml, | 19.88 (18.85–20.92/17.82–59.16) pg/ml | 38 (24–50) | NA | Poland |
| IL-17 | Sharma et al. ( | Increased | 50 | 30 | 1.84 ± 0.81, | 0.03 ± 0.02 | 33.84 ± 6.816 | 33.20 ± 7.014 | India |
| IL-17 | Hoşgören-Tekin et al. ( | No association | 31 | 56 | 45.92 (29.37–339.67)/NA | 45.36 (16.69–291.21) | NA | NA | Turkey |
| IL-17A | Gora et al. ( | Increased | 32 | 40 | 41.4 (38.55–48.25)/<0.001 | 27.13 (20.37–36.45) | 11.21 (8–14.42) | 11 (7–14) | Poland |
| IL-17A | Zheng et al. ( | No association | 28 | 28 | NA/>0.05 | NA | 35.6 ± 6.1 | 35.8 ± 7.9 | China |
| IL-17F | Chen et al. ( | No association | 60 | 15 | 17.9 (0.0–55.1)/NA | 106.8 (0.5–229.7) | NA | 24.6 (22–29) | China |
| IL-21 | Chen et al. ( | Increased | 60 | 15 | 1,063.5 (581.9–1,825.2)/0.012 | 562.8 (481.1–1,083.1) | NA | 24.6 (22–29) | China |
| IL-22 | Chen et al. ( | No association | 60 | 15 | 861.6 (503.0–2,085.5)/NA | 589.8 (252.4–1,009.5) | NA | 24.6 (22–29) | China |
| IL-23 | Degirmenci et al. ( | Decreased | 40 | 20 | NA/0.01 | NA | 38.2 ± 10.4 | 36.5 ± 5.45 | Turkey |
| IL-23 | Chen et al. ( | Increased | 60 | 15 | 306.3 (206.4–641.2)/0.038 | 212.1 (47.3–372.0) | NA | 24.6 (22–29) | China |
| IL-23 | Atwa et al. ( | Increased | 75 | 30 | 38.95 ± 27.82, | 9.87 ± 4.62 | 31.8 ± 10.3 | 29.7 ± 9.1 | Egypt |
| IL-23 | Sharma et al. ( | Increased | 50 | 30 | 25.57 ± 10.79, | 0.15 ± 0.14 | |||
| IL-23 | Gora et al. ( | Decreased | 32 | 40 | 361.5 (289.0–364.9)/<0.001 | 603.0 (527.5–674.0) | 11.21 (8–14.42) | 11 (7–14) | Poland |
| IL-25 | Băruta et al. ( | Increased | 50 | 33 | 140.27 ± 100.16, | 105.03 ± 89.21 | 50.14 ± 16.10 | 44.32 ± 9.23 | Romania |
| Number | Quality Assessment: Case. Control studies ( | Abstract (fair) | ||||||||||||
|---|---|---|---|---|---|---|---|---|---|---|---|---|---|---|
| Author year | 1 | 2 | 3 | 4 | 5 | 6 | 7 | 8 | 9 | 10 | 11 | 12 | Overall quality rating - good, fair, and poor | |
| 1 | Degirmenc ( | y | y | NR | y | Y | y | y | NA | NA | y | y | NA | Good |
| 2 | Chen ( | y | y | NR | y | y | y | y | NA | NA | y | y | NA | Good |
| 3 | Hoşgören-Tekin ( | y | y | NR | y | y | y | y | NA | NA | y | y | NA | Good |
| 4 | Bae ( | y | y | NR | y | y | y | y | NA | NA | y | y | NA | Good |
| 5 | Ferrer ( | y | y | NR | y | y | y | y | NA | NA | y | y | NA | Good |
| 6 | Caproni ( | y | y | NR | y | y | y | y | NA | NA | y | y | NA | Good |
| 7 | Trinh ( | y | y | NR | y | y | y | y | NA | NA | y | y | NA | Good |
| 8 | Góra ( | y | y | NR | y | y | y | y | NA | NA | y | y | NA | Good |
| 9 | Ucmak ( | y | y | NR | y | y | y | y | NA | NA | y | y | NA | Good |
| 10 | Najjar ( | y | y | NR | y | n | y | y | NA | NA | y | y | NA | Fair |
| 11 | Grieco ( | y | y | NR | y | y | y | y | NA | NA | y | y | NA | Good |
| 12 | Kasperska-Zajac ( | y | y | NR | y | y | y | y | NA | NA | y | y | NA | Good |
| 13 | Grzanka ( | y | y | NR | y | y | y | y | NA | NA | y | y | NA | Good |
| 14 | Valerieva ( | y | y | NR | y | n | y | y | NA | NA | y | y | NA | Fair |
| 15 | Kasperska-Zajac ( | y | y | NR | y | y | y | y | NA | NA | y | y | NA | Good |
| 16 | Kasperska-Zajac ( | y | y | NR | y | y | y | y | NA | NA | y | y | NA | Good |
| 17 | Kasperska-Zajac ( | y | y | NR | y | y | y | y | NA | NA | y | y | NA | Good |
| 18 | Rajappa ( | y | y | NR | y | y | y | y | NA | NA | y | y | NA | Good |
| 19 | Alasandagutti ( | y | y | NR | y | y | y | y | NA | NA | y | y | NA | Good |
| 20 | Rasool ( | y | y | NR | y | y | y | y | NA | NA | y | y | NA | Good |
| 21 | GRZANKA ( | y | y | NR | y | y | y | y | NA | NA | y | y | NA | Good |
| 22 | Bhatia ( | y | n | NR | y | y | n | y | NA | NA | y | y | NA | Good |
| 23 | ZHENG ( | y | y | NR | y | y | y | y | NA | NA | y | y | NA | Good |
| 24 | Mohamed ( | y | y | NR | y | n | y | y | NA | NA | y | y | NA | Fair |
| 25 | Piconi ( | y | y | NR | y | y | y | y | NA | NA | y | y | NA | Good |
| 26 | Moos ( | y | y | NR | y | y | y | y | NA | NA | y | y | NA | Good |
| 27 | Ene ( | y | y | NR | y | y | y | y | NA | NA | y | y | NA | Good |
| 28 | Petrola ( | y | y | NR | y | n | y | y | NA | NA | y | y | NA | Fair |
| 29 | Özçeker ( | y | y | NR | y | y | y | y | NA | NA | y | y | NA | Good |
| 30 | Moghadam ( | y | y | NR | y | y | y | y | NA | NA | y | y | NA | Good |
| 31 | Santos ( | y | y | NR | y | y | y | y | NA | NA | y | y | NA | Good |
| 32 | Lin ( | y | y | NR | y | y | y | y | NA | NA | y | y | NA | Good |
| 33 | Atwa ( | y | y | NR | y | y | y | y | NA | NA | y | y | NA | Good |
| 34 | Grzanka ( | y | y | NR | y | y | y | y | NA | NA | y | y | NA | Good |
| 35 | Sharma ( | y | y | NR | y | y | y | y | NA | NA | y | y | NA | Good |
| 36 | Varghese ( | y | y | NR | y | y | y | y | NA | NA | y | y | NA | Good |
| 37 | Kurt ( | y | y | NR | y | y | y | y | NA | NA | y | y | NA | Good |
| 38 | Abdel-Bary ( | y | y | NR | y | y | y | y | NA | NA | y | y | NA | Good |
| 39 | Tedeschi ( | y | y | NR | y | y | y | y | NA | NA | y | y | NA | Good |
| 40 | Puxeddu ( | y | y | NR | y | y | y | y | NA | NA | y | y | NA | Good |
| 41 | Montjoye ( | y | y | NR | y | n | y | y | NA | NA | y | y | NA | Fair |
| 42 | Boyvadoglu ( | y | y | NR | y | y | y | y | NA | NA | y | y | NA | Good |
| 43 | Băruta ( | y | y | NR | y | y | y | y | NA | NA | y | y | NA | Good |
| 44 | Raap ( | y | y | NR | y | y | y | y | NA | NA | y | y | NA | Good |
| 45 | Chaowattanapanit ( | y | y | NR | y | y | y | y | NA | NA | y | y | NA | Good |
| 46 | Kulumbegov ( | y | y | NR | y | y | y | y | NA | NA | y | y | NA | Good |
| 47 | Dobrican-Băruta ( | y | y | NR | y | y | y | y | NA | NA | y | y | NA | Good |
| 48 | Bostan ( | y | y | NR | y | y | y | y | NA | NA | y | y | NA | Good |
| 49 | Tedeschi ( | y | y | NR | y | y | y | y | NA | NA | y | y | NA | Good |
| 50 | Grzanka ( | y | y | NR | y | n | y | y | NA | NA | y | y | NA | Fair |
- —Beijing Hospitals Authority’s Ascent Plan
Peer Reviews
No public reviews on file for this paper yet. If you reviewed it on a platform where reviews are public (OpenReview, ICLR, NeurIPS, ICML), you can paste yours below so the community can read it here.
Videos
No videos yet. Explain this paper in a talk, walkthrough, or lecture? Add one.
Taxonomy
TopicsUrticaria and Related Conditions · Asthma and respiratory diseases · Dermatology and Skin Diseases
Introduction
1
Chronic urticaria (CU) is a common and debilitating mast cell-driven skin disease that persists for over 6 weeks, and is characterized by wheals, angioedema, or both (1). The underlying pathophysiology of CU remains poorly understood. While a central role for mast cells has traditionally been proposed, growing evidence suggests that immune dysregulation mediated by T lymphocytes also plays a significant role (2).
The activity of T lymphocytes largely depends on the differentiation of CD4^+^ T cells into distinct functional subsets, such as Th1, Th2, Th17, and T follicular helper (Tfh) cells, mediated by specific cytokine production (3). A complex network of cytokines released by Th cells into the peripheral circulatory microenvironment are thought to influence the immune response in CU (4–7).
Th1 cells produce cytokines such as IL-1β, IL-2, IL-12, IL-18, IFN-γ, and tumor necrosis factor (TNF), and are involved in cell-mediated pro-inflammatory responses (8). Th2 cells secrete cytokines like IL-4, IL-5, IL-6, IL-9, IL-10, IL-13, IL-17E, IL-31, and IL-33, which can inhibit Th1 cytokine production (9). Th2 cytokines are involved in antibody responses, particularly IgE production, and activate eosinophils and mast cells (10, 11). The imbalance between Th1 and Th2 has long been considered a potential mechanism in urticaria (12, 13). Th17 cells, which produce IL-17, IL-17A, IL-17F, IL-21, IL-22, IL-23, IL-25, and transforming growth factor (TGF)-β, are implicated in the pathogenesis of autoimmune and allergic diseases (14, 15).
In this study, we aimed to better characterize the helper T-cell immune phenotype in CU patients. The clinical roles of serum Th1, Th2, and Th17 cytokines in CU patients are discussed in this systematic review.
Methods
2
Literature search strategy
2.1
We systematically searched PubMed, EMBASE, and Web of Science from inception to November 2024. The protocol was registered in PROSPERO (CRD42024608505). Eligible studies quantified serum cytokines in chronic urticaria (CU). The search strategy combined Medical Subject Headings and free-text terms for CU (“Chronic Urticaria”, “Chronic Spontaneous Urticaria”, “Idiopathic Chronic Urticaria”, “Autoimmune Urticaria”, and “Chronic Autoimmune Urticaria”) with terms for biomarkers (“Biomarkers”, “Biologic Markers”, “Clinical Marker”, “Serum Markers”, “Cytokines”, “Chemokines”, and “Inflammation Mediators”).
Eligibility criteria
2.2
We included original research articles that compared serum levels of Th1-, Th2, and Th17 related cytokines between CU patients and healthy controls and examined associations with disease presence, activity, or severity. We excluded case reports, animal studies, editorials, letters, and studies that exclusively measured biomarkers in tissue biopsies, lymphocyte subsets, or genetic polymorphisms.
Study selection and data extraction
2.3
The outcome was the identification and correlation of cytokine levels with CU. Two reviewers (JWX and CHS) independently screened titles, abstracts, and full texts using EndNote. Discrepancies were resolved by a third reviewer (YZ). Data were extracted and verified by JWX and CHS. The author lists and publication years were screened to exclude possible duplicate or overlapping studies. The extracted variables included study characteristics, patient demographics (age and sex), biomarker levels, and reported associations with disease activity or severity, along with p-values. If any data were incomplete or unclear, the corresponding authors of the selected studies were contacted for further detail.
Quality evaluation
2.4
Study quality was assessed using the National Heart, Lung, and Blood Institute (NHLBI) Quality Assessment Tools, which are applicable to cohort, cross-sectional, case-control, and case series studies. This systematic review was conducted in accordance with the Preferred Reporting Items for Systematic Reviews and Meta-Analyses (PRISMA) guidelines. JWX and CHS drafted the manuscript. All authors contributed to the development of the selection criteria and the data extraction protocols. All the authors have read and approved the final manuscript.
Statistical analysis
2.5
Meta-analyses were performed using the random-effects model with Hedges' g to account for small-sample bias and between-study heterogeneity. Pooled standardized mean differences (SMDs) were calculated for biomarkers reported in at least four studies with available means and standard deviations (SDs). Studies were excluded from the meta-analysis if: (1) biomarker levels were reported as undetectable; (2) SDs were not reported or calculable; (3) data were presented only as medians with ranges or interquartile ranges (IQRs) and were determined to be skewed upon inspection. Data skewness was evaluated for studies that reported medians with IQRs or ranges. If not significantly skewed, means and SDs were estimated using validated methods (16). When applicable, 95% confidence intervals or ranges were used to back-calculate the SDs.
Results
3
A total of 6,013 studies were screened, of which 50 were included, reporting 22 serum Th1-, Th2, and Th17 related cytokines (Figure 1: PRISMA flow diagram). Meta-analyses revealed significant pooled SMDs for serum TNF-α and IL-17.
PRISMA (Preferred Reporting of Items in Systematic Reviews and Meta-Analysis) flowchart depicting the identification, screening, and inclusion of the studies included.
Th1 cytokines
3.1
IL-18 was the most frequently assessed Th1-related cytokine in nine studies. Of these, five studies reported elevated IL-18 levels in CU patients compared to controls, one study described a reduction, and three studies found no significant difference. A pooled analysis of seven studies involving 511 participants yielded a standardized mean difference (SMD) of 0.55 (95% CI, −0.11–1.22), indicating considerable variation among study results (Figure 2A). TNF-α levels were examined in 11 studies. Eight studies identified increased serum levels in CU patients, while the remaining three reported no association. Meta-analysis of four studies with 319 participants showed a significant difference, with a pooled SMD of 1.40 (95% CI, 0.59–2.21) (Figure 2B). IFN-γ levels were evaluated in five studies. Three of these studies observed higher levels in CU patients than in healthy controls, and two did not find a statistically significant difference. IL-12 was reported in three studies, all of which documented elevated levels in CU patients relative to the control groups. IL-2 levels were measured in three studies. One study identified increased IL-2 concentrations in CU patients, while two reported no such association (Table 1). IL-1β was included in one study, which observed higher serum levels in the CU group than in the controls (Table 1).
Forest plot for the comparison of (A) serum IL-18, (B) TNF-α, (C) IL-6, (D) IL-33, and (E) IL-17 cytokines in chronic urticaria patients vs. healthy control. The forest plot was generated using the random-effects model with Hedges' g to account for small-sample bias and between-study heterogeneity. SMD = standardized mean difference in the concentrations of serum biomarkers between groups.
Th2 cytokines
3.2
Among the Th2 cytokines, IL-6 was the most frequently studied, as reported in 18 articles. Fifteen studies observed elevated IL-6 levels in CU patients compared to healthy controls, while three studies reported no association. A meta-analysis based on four studies involving 329 participants indicated a pooled SMD of 1.94 (95% CI, −0.11–3.99), suggesting a trend toward elevation without reaching statistical significance (Figure 2C). IL-4 levels were investigated in eight studies. Two studies documented increased IL-4 levels in CU patients, two reported reduced levels, and four found no significant association (Table 2). IL-5 expression was examined in two studies. One study recorded higher levels in CU patients than in controls, and another found no difference (Table 2). IL-10 was reported in nine studies. Among these, five studies observed increased levels in CU patients, one study noted a decrease, and three reported no association (Table 2). IL-13 levels were evaluated in four studies. Three studies reported elevated IL-13 levels in CU patients, and one study showed no statistically significant difference (Table 2). IL-31 was included in seven studies. Four studies identified higher IL-31 levels in CU cases than in controls, one study reported reduced levels, and two studies found no association (Table 2). IL-33 has also been reported in seven studies. Two studies observed increased IL-33 levels in CU patients, two reported lower levels, and three studies did not identify a significant difference (Table 2). A meta-analysis of four studies with 317 participants revealed a pooled SMD of 0.30 (95% CI, −2.67–3.27) (Figure 2D). IL-9 levels were measured in two studies, both of which found no significant differences between CU patients and controls (Table 2). IL-24 was investigated in one study that reported higher levels in the CU group than in the control group (Table 2).
Th17 cytokines
3.3
A meta-analysis of five studies involving 416 participants demonstrated a significant elevation in serum IL-17 levels among patients with chronic urticaria, with a pooled SMD of 1.43 (95% CI, 0.11–2.75) (Figure 2E). IL-17 was evaluated across nine studies; five of them identified increased levels in CU cases compared to controls, while the remaining four studies reported no statistically significant association (Table 3). Two studies investigated IL-17A concentration. Among them, one study documented elevated serum IL-17A levels in CU patients relative to controls, and another study found no significant difference between groups (Table 3). IL-17F was measured in one study, which indicated no notable difference in serum levels between CU and control cohorts (Table 3). IL-21 was reported in one study that observed higher levels in CU patients than in healthy controls (Table 3). IL-22 was included in one publication, with results showing no measurable differences between groups (Table 3). Five studies assessed the IL-23 levels. Of these, three studies observed elevated IL-23 concentrations in CU patients and two studies did not detect a meaningful difference when compared with controls (Table 3). IL-25 was included in one study that reported increased serum levels in the CU group compared to the control group (Table 3).
Quality assessment
3.4
Assessment of study quality using the NHLBI Quality Assessment Tool for Case-Control Studies indicated that 44 of the 50 included studies (88%) were rated as high quality with a low risk of bias, while the remaining 6 studies (12%) were considered to have a moderate risk of bias (Table 4).
Discussion
4
To our knowledge, this systematic review represents the first registered evaluation of serum Th1, Th2, and Th17 cytokines in patients with CU. Our meta-analysis revealed statistically significant pooled SMDs values for serum TNF-α and IL-17 levels. These findings may influence the clinical practice for CU patients, as measurements of serum TNF-α and IL-17 levels are accessible to some clinicians.
Tumor necrosis factor alpha (TNF-α) plays a critical role in inflammation, immune regulation, and apoptosis (36). It is released by human skin mast cells and other inflammatory cells present at urticarial lesion sites (66), making it a candidate mediator in urticaria pathogenesis (34). Our meta-analysis revealed a significant association between CU and elevated serum TNF-α levels, with a pooled SMD of 1.40 (95% CI of 0.59–2.21). This significant link confirms the autoimmune and inflammatory nature of CU, and supports the inclusion of TNF-α in the clinical assessment of CU.
IL-17, produced by T helper (Th) type 17 cells, binds to IL-17 receptors on epithelial, endothelial, and fibroblastic stromal cells (63). IL-17 is associated with many autoimmune disorders, such as psoriasis, multiple sclerosis, inflammatory bowel disease, rheumatoid arthritis, and asthma (67–69). Serum IL-17 levels were significantly elevated in CU patients compared to controls and correlated with urticaria severity (24, 33, 70) Our meta-analysis confirmed this, showing a significant pooled SMD of 1.43 (95% CI of 0.11–2.75). These findings support IL-17 as a valuable biomarker for CU clinical assessment.
A limitation of this systematic review and meta-analysis is the heterogeneity in assay methods. Variability in laboratory methods across studies (e.g., ELISA, multiplex assays) may lead to variations in cytokine measurements. Furthermore, data from some studies could not be pooled because of non-normal data distribution. In addition, owing to the limited number of related studies, we did not differentiate between chronic induced urticaria and chronic spontaneous urticaria in this review despite their distinct pathogenic mechanisms. The lack of subgroup analysis might restrict the clinical applicability of our findings.
Despite these limitations, the results of this review and meta-analysis provide high-quality evidence-based insights into the associations between serum Th1, Th2, and Th17 cytokines and CU. In conclusion, Th1 and Th17-derivated cytokines play crucial roles in the pathogenesis of CU. CU is thus characterized as a chronic inflammatory state mediated by diverse cytokines and autoimmune mechanisms. These findings may help inform clinical guidelines for CU diagnosis by incorporating serum TNF-α and IL-17 levels. However, the clinical cut-off values, sensitivity, specificity, and practical implementation of these biomarkers have not yet been explored. Therefore, well designed and large-scale studies are needed to determine the optimal cutoff levels of TNF-α and IL-17.
The reference list from the paper itself. Each links out to its DOI / PubMed record.
- 1Zuberbier T Ensina LF Giménez-Arnau A Grattan C Kocatürk E Kulthanan K Chronic urticaria: unmet needs, emerging drugs, and new perspectives on personalised treatment. Lancet. (2024) 404(10450):393–404. 10.1016/S 0140-6736(24)00852-339004090 · doi ↗ · pubmed ↗
- 2Moy AP Murali M Nazarian RM. Identification of a Th 2- and Th 17-skewed immune phenotype in chronic urticaria with Th 22 reduction dependent on autoimmunity and thyroid disease markers. J Cutan Pathol. (2016) 43(4):372–8. 10.1111/cup.1267326785710 · doi ↗ · pubmed ↗
- 3Dong C. Cytokine regulation and function in T cells. Annu Rev Immunol. (2021) 39(1):51–76. 10.1146/annurev-immunol-061020-05370233428453 · doi ↗ · pubmed ↗
- 4Chen WC Chiang BL Liu HE Leu SJ Lee YL. Defective functions of circulating CD 4+ CD 25+ and CD 4+ CD 25- T cells in patients with chronic ordinary urticaria. J Dermatol Sci. (2008) 51(2):121–30. 10.1016/j.jdermsci.2008.02.01218440785 · doi ↗ · pubmed ↗
- 5Huilan Z Runxiang L Bihua L Qing G. Role of the subgroups of T, B, natural killer lymphocyte and serum levels of interleukin-15, interleukin-21 and immunoglobulin E in the pathogenesis of urticaria. J Dermatol. (2010) 37(5):441–7. 10.1111/j.1346-8138.2010.00805.x 20536649 · doi ↗ · pubmed ↗
- 6Chen Q Zhong H Chen WC Zhai Z Zhou Z Song Z Different expression patterns of plasma Th 1-, Th 2-, Th 17- and Th 22-related cytokines correlate with serum autoreactivity and allergen sensitivity in chronic spontaneous urticaria. J Eur Acad Dermatol Venereol. (2018) 32(3):441–8. 10.1111/jdv.1454128846158 · doi ↗ · pubmed ↗
- 7Hofmann MA Kiecker F Zuberbier T. A systematic review of the role of interleukin-17 and the interleukin-20 family in inflammatory allergic skin diseases. Curr Opin Allergy Clin Immunol. (2016) 16(5):451–7. 10.1097/ACI.000000000000031027490126 · doi ↗ · pubmed ↗
- 8Dong C Flavell RA. Th 1 and Th 2 cells. Curr Opin Hematol. (2001) 8(1):47–51. 10.1097/00062752-200101000-0000911138626 · doi ↗ · pubmed ↗