Impact of NLRP1 Met1154Val and IL1B variants on gestational malaria: an unexplored role of NLRP1 in inflammasome activation by Plasmodium spp
Vinicius NC Leal, Jessica A Ribeiro, Leticia Girardi Marra, Alexandre TT Rio, Edione C Reis, Gerhard Wunderlich, Jamille G Dombrowski, Claudio RF Marinho, Alessandra Pontillo

TL;DR
This study explores how genetic variations in NLRP1 and IL1B genes affect susceptibility to gestational malaria and identifies a new role for NLRP1 in the immune response to malaria parasites.
Contribution
The study identifies a novel NLRP1 inflammasome pathway in gestational malaria pathogenesis and its protective role against Plasmodium infection.
Findings
The NLRP1 p.Met1154Val variant is associated with protection against Plasmodium infection.
IL1B variants are more common in severe gestational malaria cases.
NLRP1 and caspase-1 mediate pyroptosis in trophoblast cells infected with Plasmodium.
Abstract
We hypothesized that variants in inflammasome‐related genes could influence susceptibility to gestational malaria (GM). To test this, we conducted an association study in a cohort of pregnant women from a malaria‐endemic region in northern Brazil, assessing whether specific functional single nucleotide variants (SNVs) in inflammasome genes affect (1) the response to Plasmodium infection and (2) the development of placental malaria. Our findings revealed that the NLRP1 p.Met1154Val variant was associated with a protective effect against Plasmodium infection. Moreover, IL1B SNVs appeared more prevalent in severe cases. Additionally, multivariate analyses incorporating placental blood cytokines, growth factors, and immunohistochemical features revealed that the NLRP1 p.Met1154Val variant correlated with a healthier placental state, highlighting a potential protective role of the NLRP1…
Genes, proteins, chemicals, diseases, species, mutations and cell lines named across the full text — each resolved to its canonical identifier and authoritative record.
Click any figure to enlarge with its caption.
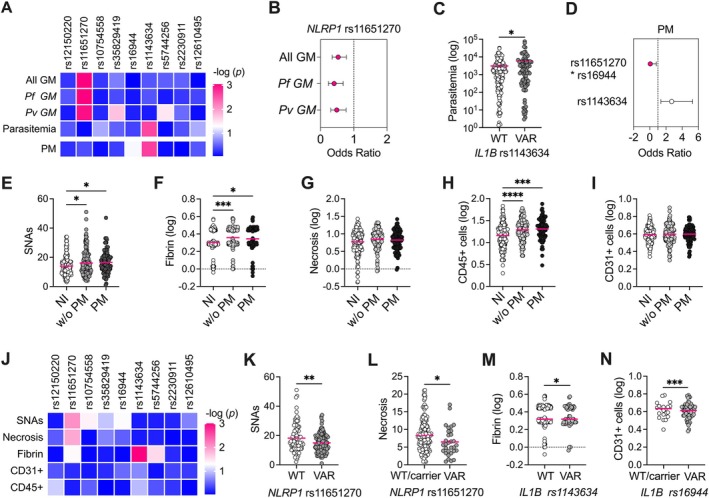 Figure 1
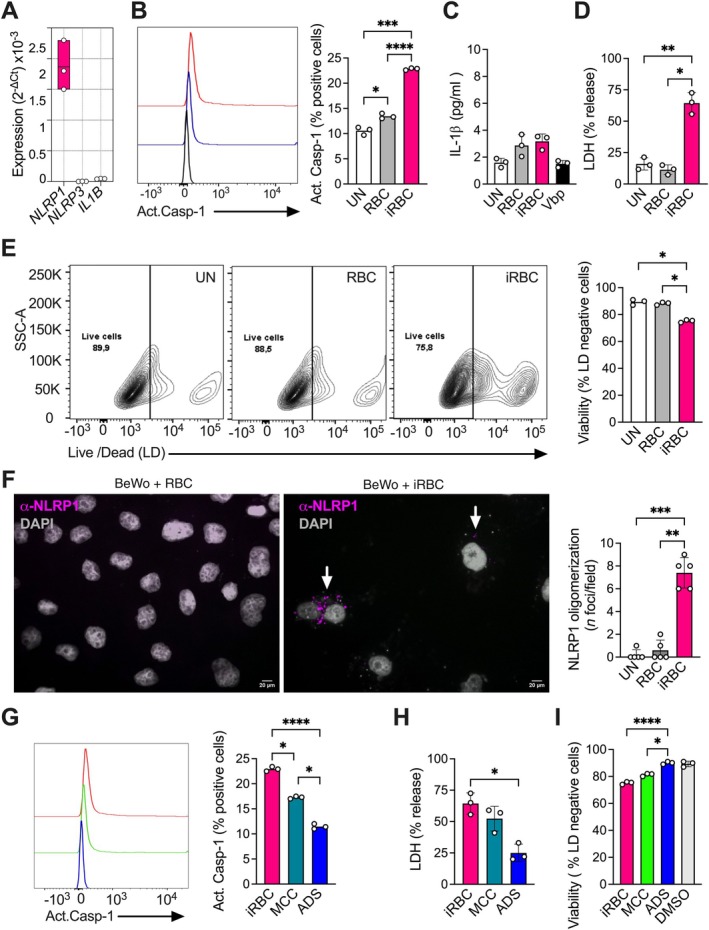 Figure 2
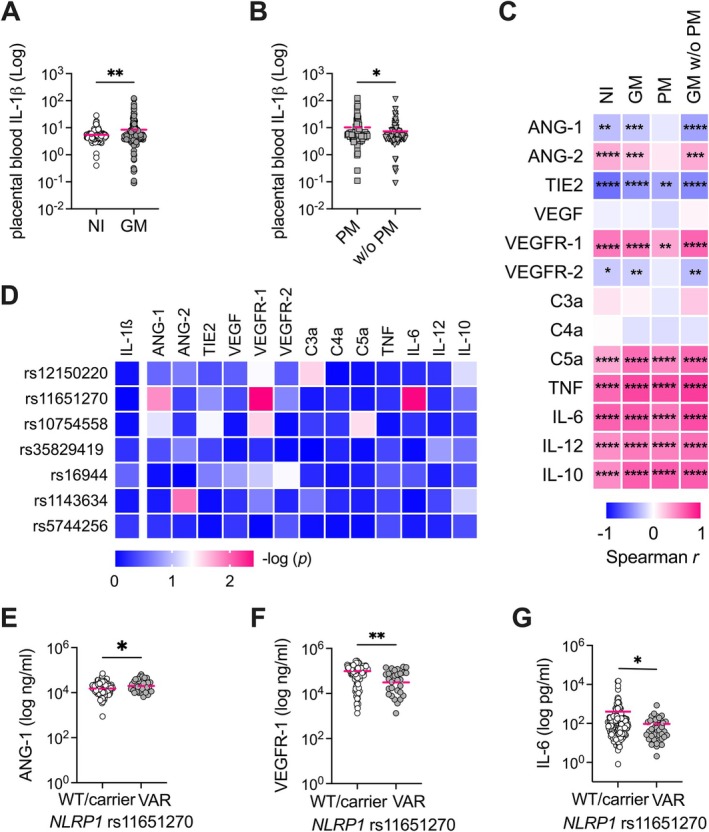 Figure 3
| Gestational malaria (GM) ( | Placental malaria (PM) ( | Non‐infected pregnant women (NI) ( | |
|---|---|---|---|
| Age, years | 21 (17–27) | 22.24 (13.0–38.0) | 23 (19.0–28.0) |
| Ethnicity (W/M/B), | 35/220/27 | 10/74/7 | 22/135/14 |
| Parity (one/more), | 114/168 | 37/54 | 81/90 |
| Leukocytes (cells/μl), mean (min–max) | 13.06 (3–29.6) | 12.56 (5.4–24.2) | 13.1 (5.05–25.60) |
| Platelets (cells/μl), mean (min–max) | 190.97 (42–507) | 170.39 (42.0–275.0) | 205,73 (111–325) |
| Anemia (yes), | 87 (31) | 37 (41) | 28 (16) |
| Hemoglobin (g/dl), mean (min–max) | 11.4 (5–15.3) | 11.23 (5.40–14.10) | 12 (8.7–14.8) |
| Infection | |||
| Parasitemia (parasites/ml), mean (min–max) | 3,879.64 (0.50–75,520.0) | 4,490.12 (1.37–61,120.00) | – |
| Malaria episodes (one/more), | 123/159 | 30/61 | – |
| Fever (>37 °C), | 63 (22) | 19 (21) | – |
| Type ( | 74 (26)/141 (50)/67 (24) | 37 (41)/11 (12)/43 (47) | – |
| Placenta hemozoin (high/low), | 33/51 | 33/50 | – |
| Placental features | |||
| Placental syncytial nuclear aggregates, mean (min–max) | 16.32 (1–51) | 16.4 (1–47) | 13.89 (3.0–34.0) |
| Placental necrosis, mean (min–max) | 8.16 (0.87–26.29) | 8.0 (0.96–26.29) | 7.55 (0.42–26.79) |
| Placental fibrin, mean (min–max) | 2.34 (0.83–3.83) | 2.28 (0.83–3.75) | 2.09 (0.92–3.67) |
| Placental vascularity, CD31+, mean (min–max) | 4.09 (2.0–7.9) | 4.05 (2.20–6.10) | 4.01 (2.0–6.0) |
| Placental leukocytes, CD45+, mean (min–max) | 22.94 (3.0–75.0) | 23.80 (3.0–75.0) | 17.59 (2.0–68.0) |
| Placental monocytes, CD68+, mean (min–max) | 9.57 (1.0–50.0) | 10.04 (1.0–50.0) | 4.96 (1.0–22.0) |
- —Fundação de Amparo à Pesquisa do Estado de São Paulo10.13039/501100001807
- —Conselho Nacional de Desenvolvimento Científico e Tecnológico10.13039/501100003593
Peer Reviews
No public reviews on file for this paper yet. If you reviewed it on a platform where reviews are public (OpenReview, ICLR, NeurIPS, ICML), you can paste yours below so the community can read it here.
Videos
No videos yet. Explain this paper in a talk, walkthrough, or lecture? Add one.
Taxonomy
TopicsInflammasome and immune disorders · Kawasaki Disease and Coronary Complications · Autoimmune and Inflammatory Disorders Research
Introduction
Malaria in pregnancy poses serious risks to both mother and fetus, leading to complications such as miscarriage, stillbirth, and low birth weight. Placental malaria (PM), a severe form of gestational malaria (GM), occurs in 20%–50% of cases, due to immunological dysregulation, Plasmodium‐infected red blood cell (iRBC) sequestration within the placenta, and consequent severe inflammation, which finally lead to placental dysfunction [1, 2, 3].
Several factors, including young maternal age, first pregnancy, Plasmodium species (P. falciparum causing the most severe effects), and host genetics, influence GM susceptibility and severity [1, 2, 3, 4]. The pathogenesis of GM still needs to be fully elucidated, and it can present different prognoses in different women [1, 4]. Understanding inter‐patient heterogeneity is critical for identifying diverse immunological pathways involved in host–pathogen interactions and, consequently, for improving treatment and follow‐up care for pregnant women.
We recently demonstrated that inflammasome‐dependent IL‐1β release plays a key role in pregnancy outcome in a mouse model of GM. The high amount of IL‐1β in the placenta correlated with reduced intrauterine fetal growth. iRBCs induced caspase‐1 activation and IL‐1β release in macrophages and trophoblast cells [5]. Human trophoblasts and placenta‐associated monocytes/macrophages express inflammasome and many of its receptors [6, 7] and thus can respond to *Plasmodium‐*associated molecular patterns and/or to iRBCs or damaged tissue debris [8]. Nlrp3 and Aim2, previously reported as key inflammasome receptors in murine models of malaria by detecting hemozoin [9], a byproduct of iRBC metabolism, and Plasmodium DNA [10] respectively, contribute to the severity of our model of GM [5].
In humans, functional single nucleotide variants (SNVs) in inflammasome receptors or the IL1B gene affect the level of inflammasome activation and can contribute to heterogeneity in individual responses to pathogens [11]. We previously demonstrated that NLRP1 variants were associated with severe vivax malaria [12]. Although several previous studies have demonstrated the role of NLRP1 as a sensor in viral infections [13], there is currently no evidence of NLRP1 involvement in immune response against Plasmodium spp. and little is known about its role in other protozoan diseases [8]. NLRP1 has been identified as crucial in Toxoplasma gondii infection [14, 15, 16, 17], indicating a potential role in the innate immune response against protozoan parasites.
NLRP1 is expressed in the placenta (http://www.proteinatlas.org), and specifically in trophoblasts [7], where it has been suggested to contribute to oxidative stress response [18, 19], one of the hallmarks of dysfunctional placenta [1, 2, 3]. T. gondii has been suggested to induce pyroptosis in the placenta by inducing reactive oxygen species (ROS) and inflammasome activation partially depending on NLRP1 [16].
Additionally, NLRP1 presents some variants with high frequency (30%–50%) that have previously been associated with infections [11] and pre‐eclampsia [20], making it a reasonable target for a gestational infection disease. The distribution of these variants shows racial disparity, with a frequency of 30%–50% in European and African regions where malaria was or still is endemic, and of 3%–19% in the Asian populations (https://ensembl.org).
In this study, we genotyped a cohort of pregnant women from a malaria‐endemic region of Brazil and found that the NLRP1 Met1154Val variant protects against GM and correlates with a healthier placental state, highlighting a potential protective role of the NLRP1 inflammasome in GM. Moreover, we confirmed the impact of IL1B SNVs, not only in vivax malaria but also in GM. As a proof of concept, we demonstrated that iRBCs can activate the NLRP1 inflammasome in BeWo trophoblasts. Our findings demonstrate the contribution of NLRP1 and IL1B SNVs in GM and suggest a novel mechanism for GM pathogenesis.
Materials and methods
Ethics approval
The study was approved by the ethics committees of the University of São Paulo and the Federal University of Acre (Plataforma Brasil, CAAE: 03930812.8.0000.5467 and 03930812.8.3001.5010, respectively). All study participants or their legal guardians (if minors) provided written informed consent.
Patient cohort
453 pregnant women were recruited from the Hospital da Mulher e da Criança in Juruá (AC, Brazil), an endemic area for malaria. GM was confirmed in 282 women using molecular diagnostic testing of blood samples. 91 out of 282 infected women were diagnosed with PM, defined by the presence of parasites (predominantly mixed or falciparum infection) and hemozoin deposition in the placenta [21, 22]. Exclusion criteria included smoking, drug use, alcohol consumption, HIV, HBV, syphilis, and toxoplasmosis during pregnancy. Cohort information has been detailed in [22] and is briefly summarized in Table 1.
DNA samples and SNV genotyping
Maternal DNA was previously extracted from whole blood using standard methods and stored in a biorepository (CAAE: 03930812.8.0000.5467; Of.028.11). SNVs in NLRP1 (rs12150220, rs11651270), NLRP3 (rs10754558, rs35829419), IL1B (rs16944, rs1143634), IL18 (rs5744256), P2RX7 (rs2230911), and DPP9 (rs12610495) genes were selected based on literature and our previous results [11, 12], and genotyping was performed using allele‐specific TaqMan assays (Applied Biosystems, Thermo Fisher Scientific, Foster City, CA, USA) (catalog numbers are provided in supplementary material, Table S1) and qPCR on QuantStudio 3.0 equipment (Applied Biosystems). Allelic discrimination was performed using the QuantStudio 3.0 software (Applied Biosystems). The genotyping concordance rate was 99.5% across replicates.
RBC/iRBC preparation
*P. falciparum‐*infected red blood cells (iRBCs) (5%–10% parasitemia) were counted and submitted to ten freeze–thaw cycles to generate the cell lysate. Non‐infected RBCs (RBCs) were quantified and submitted to the same lysis process.
BeWo cell culture and treatment
BeWo cells were cultured in RPMI‐10% FBS (Gibco, Thermo Fisher Scientific, Grand Island, NY, USA), plated in 96‐ or 24‐well plates, and treated with non‐infected RBCs at a ratio of 40:1 (RBC:BeWo) and with iRBCs at a ratio of 10:1, 20:1, and 40:1 for 24–48 h [5]. Alternatively, priming with bacterial lipopolysaccharide (LPS; 10 or 100 ng/ml) (Sigma‐Aldrich, Millipore/Merck, St. Louis, MO, USA) or TNF (5, 10, or 20 ng/ml) (PeproTech Inc., Thermo Fisher Scientific, Rocky Hill, NJ, USA) was carried out before RBC/iRBC treatment.
In some experiments, cells were treated with the DPP‐9 inhibitor talabostat (Val‐boroPro/VbP; 10 μm) (Tocris Bioscience, Bristol, UK) [23] or incubated with the selective NLRP3 inhibitor MCC950 (Invivogen, San Diego, CA, USA) [24], or the dual NLRP1 and NLRP3 inhibitor ADS032 (MedChemExpress LLC, Monmouth Junction, NJ, USA) [25] 60 min before RBC/iRBC treatment.
Gene expression analysis
Total cellular RNA was extracted using the RNAqueous mini kit (Ambion Inc., Thermo Fisher Scientific, Austin, TX, USA), followed by reverse transcription to cDNA using a SuperScript III Reverse Transcriptase kit (Invitrogen, Thermo Fisher Scientific, Carlsbad, CA, USA). Relative gene expression was assessed by qPCR using gene‐specific Taqman Assays (Applied Biosystems) (catalog numbers are provided in supplementary material, Table S1). Data are presented as basal expression normalized to the GAPDH endogenous control. Triplicates were used for all conditions and for each independent experiment. The data concordance rate was 99.5% across replicates.
Flow cytometry analysis of activated caspase‐1
Caspase‐1 activation was measured using the FAM‐FLICA Caspase‐1 Assay Kit and flow cytometry following the manufacturer’ s protocol (Immunochemistry Technologies, Bloomington, MN, USA). In brief, 0.5 × 10^6^ cells were incubated with the FAM‐FLICA probe for 30 min and then with LIVE/DEAD Cell Stain (Invitrogen). Samples were analyzed using the BD Canto II flow cytometer [Becton, Dickinson and Company (BD), Franklin Lakes, NJ, USA] and FlowJo_V10 software (https://www.flowjo.com/). Data are presented as percentage of FAM‐FLICA‐positive cells.
Dosage of IL‐1β and lactate dehydrogenase (LDH)
The release of IL‐1β and LDH was measured in culture supernatants using colorimetric assays (R&D Biosystems, Minneapolis, MN, USA; Thermo Fisher Scientific). Triplicates were used for all conditions and for each independent experiment. The data concordance rate was 99.5% across replicates. Data are presented as pg/ml (IL‐1β) and percentage of LDH release versus Triton X‐100‐treated cells (= 100%), respectively.
Immunofluorescence assay
Cells were cultured on coverslips, treated as above, stained with anti‐NLRP1 antibody (1:200; Abcam, Cambridge, UK) and appropriate secondary antibody together with the nuclear dye DAPI (Thermo Fisher Scientific), and finally observed using fluorescence microscopy (Axio Vert.A1; Zeiss, Oberkochen, Germany). Quantification of NLRP1 oligomers was performed using ImageJ software (NIH, Bethesda, MD, USA), as previously reported [26].
Data analysis
Multivariate analysis and the general linear model (GLM) were used to analyze the SNVs’ association with clinical or laboratory variables using R‐program software (http://www.r-project.org) and the ‘SNPassoc’ package [27]. Confounding variables were selected based on GLM analysis of the principal variables and used to adjust the SNV distribution analysis [adjusted p value (p adj)] as specified for each analysis step. To reduce the skewness of the data, variables with a wide range of values were log‐transformed to make them more suitable for analysis. A formal Bonferroni correction for the number of independent SNPs analyzed would require a significance threshold of p = 0.01 (p0/n, p0 = 0.05, n = 5 genes/loci). GraphPad Prism software (GraphPad Software Inc., San Diego, CA, USA) was used for data analysis and graphing.
Results
To explore the contribution of inflammasome genetics in GM, we genotyped selected functional SNVs in the GM cohort from a malaria‐endemic area of the Brazilian Amazon (Table 1). All the analyzed SNVs were in Hardy–Weinberg equilibrium in the cohort, and their allelic frequencies were similar to those reported in 1000 Genomes Project (https://internationalgenome.org) (supplementary material, Table S2).
Initially, we compared the distribution of SNVs in pregnant women with and without GM (case/control study) using a multivariate test adjusted for confounding variables (age, previous pregnancies) based on the prior linear regression assessment of dependence (supplementary material, Table S3). None of the selected SNVs were found to be associated with risk of GM, except the NLRP1 p.Met1154Val (rs11651270 A>G) variant (Figure 1A). This variant was more frequently observed in non‐infected women (73.8%) than in women with malaria (59.9%), suggesting a protective effect of this polymorphism against GM (p adj = 0.001, OR adj = 0.53; 95% CI 0.35–0.78) (Figure 1B and supplementary material, Table S4). Since our cohort included both falciparum and vivax malaria, and a group of women was positive for both two parasites (mixed infection), we stratified our analysis according to the type of infection: falciparum or vivax. In both sub‐groups, the only associated variant was rs11651270 (p adj = 0.001 and 0.002, respectively) (Figure 1A,B and supplementary material, Table S5), confirming a protective role against GM, independent of the type of parasite.
*Effect of inflammasome SNVs in the predisposition to gestational malaria. (A) Heatmap of adjusted p value calculated for selected inflammasome SNVs in NLRP1 (rs12150220, rs11651270), NLRP3 (rs10754558, rs35829419), IL1B (rs16944, rs1143634), IL18 (rs5744256), P2RX7 (rs2230911), and DPP9 (rs12610495) genes in case/control association analysis [gestational malaria (GM) versus non‐infected pregnant women (NI)] taking into account either all GM cases, or just P. falciparum or P. vivax infections (All GM, Pf GM, Pv GM, respectively). The distribution of SNVs according to parasitemia and to the presence of placental malaria (PM) has also been included in this analysis step and in the heatmap (parasitemia, PM). Age and number of pregnancies are included in the general linear model (GLM) as confounding variables for case/control analysis. Age, number of pregnancies, type of infection (P. falciparum or P. vivax or mixed), and episodes of malaria are included in the GLM as confounding variables in GM analysis. (B) Forest plot of odds ratio (OR) values and confidence intervals for NLRP1 rs11651270 SNV in case/control association analysis (All GM, Pf GM, Pv GM). (C) Distribution of parasitemia values according to IL1B rs1143634 SNV. The difference between women who do not carry the polymorphic allele (WT, G/G) and who carry the polymorphic allele (VAR, G/A or A/A) was calculated using the GLM adjusted for age, number of pregnancies, type of infection (P. falciparum or P. vivax or mixed), and episodes of malaria. (D) Forest plot of odds ratio (OR) values and confidence intervals for the rs1143634 variant and the SNV combination NLRP1 rs11651270/IL1B rs16944 in GM association analysis for the presence of PM. (E–I) Placental histologic features [syncytial nuclear aggregates (SNAs), fibrin deposition, necrosis, leukocyte infiltration/CD45+ cells, and vascularity/CD31+ cells] were analyzed and compared among non‐infected pregnant women and infected women without or with PM (NI, GM w/o PM, and PM, respectively) using a one‐way ANOVA test followed by a multiple comparisons post‐test. (J) Heatmap of adjusted p value calculated for inflammasome SNVs in NLRP1 (rs12150220, rs11651270), NLRP3 (rs10754558, rs35829419), IL1B (rs16944, rs1143634), IL18 (rs5744256), P2RX7 (rs2230911), and DPP9 (rs12610495) genes and dysfunctional placenta features in GM cases. Age, number of pregnancies, type of infection (P. falciparum or P. vivax or mixed), and episodes of malaria are included in the GLM as confounding variables. (K,L) Syncytial nuclear aggregates (SNAs) and necrosis distribution according to NLRP1 rs11651270 SNV are shown for GM women. The differences were calculated using the GLM adjusted for age, number of pregnancies, type of infection (P. falciparum or P. vivax or mixed), and episodes of malaria. (M) Distribution of fibrin deposits according to IL1B rs1143634 SNV is shown for GM women. The differences were calculated using the GLM adjusted for age, number of pregnancies, type of infection (P. falciparum or P. vivax or mixed), and episodes of malaria. (N) Vascularity (CD31+ cells) distribution according to IL1B rs16944 SNV is shown for PM women. Differences were calculated by the GLM adjusted for age, number of pregnancies, type of infection (P. falciparum or P. vivax or mixed), and episodes of malaria. *p < 0.05, **p < 0.01, ***p < 0.001, ***p < 0.0001.
In our previous work [12], we observed a significant association between the variant IL1B p.Phe105= (rs1143634 C>T; +3954 C>T) and P. vivax parasitemia, which seems to be in accordance with the protective role of this cytokine in infection. In this study, we replicated the association with this variant (p adj = 0.015) (Figure 1A,C and supplementary material, Table S4), reinforcing that the cytokine is essential in controlling parasite infection.
When the analysis was performed to detect any possible combinatory effect between the SNVs (epistatic analysis) on parasitemia, we observed that NLRP1 rs11651270 interacts with IL1B rs1143634 (p = 0.024). The effect of this interaction was demonstrated by the association of the NLRP1 and IL1B SNV combination on parasitemia (p adj = 0.016) (supplementary material, Figure S1).
Among women with GM, 91 presented with PM. Multivariate association analysis identified the IL1B SNV rs1143634 as a possible risk factor for the development of PM, the polymorphic allele A being more frequent in women with PM than in those without PM (p adj = 0.003; OR adj = 2.69). On the other hand, the combination of the gain‐of‐function variants NLRP1 rs11651270 and IL1B rs16944 promotes a protective effect on the development of PM (Figure 1A,D and supplementary material, Table S6).
p.Phe105= (rs1143634 C>T) and the promoter variant −511 G>A (rs16944) have been associated with lower and higher IL‐1β levels, respectively [28, 29]. Therefore, our data show that IL‐1β is a protective factor for PM, especially together with NLRP1.
Syncytial nuclear aggregates (SNAs), fibrin deposits, necrosis, increased leukocyte infiltrate, and decreased vascularity are characteristic features of a dysfunctional placenta [1, 2, 3, 4, 22]. In our cohort, all these characteristics, with the exception of necrosis and vascularity, were more pronounced in GM than in non‐infected (NI) women, however without any significant difference between the PM, and GM without PM (GM w/o PM) groups (Figure 1E–I).
In the next step of our association study, we analyzed the distribution of SNVs according to these different features of the placenta in GM women.
The NLRP1 rs11651270 variant was significantly more frequent in GM women with low levels of syncytial nuclear aggregates and necrosis within the placenta (p adj = 0.003 and 0.028, respectively) (Figure 1J–L and supplementary material, Table S7). The IL1B rs1143634 variant was significantly more frequent in GM women with high fibrin deposition (Figure 1J,M and supplementary material, Table S7). The IL1B rs16944 variant was significantly more frequent in PM women with low vascularity (expressed as CD31^+^ cells) in the placenta (Figure 1J,N and supplementary material, Table S7).
Altogether, the genetic association findings emphasized the role of IL‐1β in GM as we previously demonstrated [5], and identified NLRP1 as a possible alternative sensor for inflammasome activation in malaria.
In experimental models of malaria [8] and GM [5], Nlrp3 and Aim2 inflammasomes have been identified as key sensors for Plasmodium spp.; however, at that point, NLRP1 had not been taken into account. To validate the genetic association results, and considering the evolutionary differences between rodents and the human NLRP1 gene [30], we performed a set of experiments with BeWo trophoblast cells as a model for placental Plasmodium infection [5]. BeWo cells expressed high levels of NLRP1 (Figure 2A) compared with NLRP3, which was previously investigated in this context [5]. Priming with LPS or TNF did not alter NLRP1 expression levels (supplementary material, Figure S2). To investigate whether NLRP1 contributes to placental inflammation during GM, we analyzed inflammasome activation in BeWo trophoblast cells at different time points of culture, in the presence of P. falciparum iRBCs. This was assessed using a fluorescent probe for activated caspase‐1 combined with flow cytometry analysis, as well as colorimetric assays for LDH release and cytokine quantification.
*P. falciparum iRBCs induce NLRP1 inflammasome‐dependent cell death in BeWo trophoblast cells. (A) Relative expression of NLRP1, NLRP3, and IL1B genes in BeWo trophoblast cells. Data are reported as 2−∆Ct, where ∆Ct is obtained by subtracting the Ct value of the housekeeping gene B2M from the Ct value of the target gene. The floating bars show the mean and min–max interval of three biological replicates in one experiment. (B) The percentage of activated caspase‐1‐positive BeWo cells in untreated (UN) and treated conditions was analyzed by flow cytometry. An example histogram is shown on the left and a bar graph with mean and scatter dot blots of three experiments on the right. One‐way ANOVA with multiple comparisons post‐test. (C) IL‐1β release was measured by ELISA and expressed as pg/ml in the bar graph, with mean ± SD and scatter dot blot for three experiments. Val‐boroPro (VbP) was used as a control for NLRP1 activation. (D) The percentage of LDH release was measured by colorimetric assay and reported as a bar graph with mean and scatter dot blots for three experiments. Val‐boroPro (VbP) was used as a control for NLRP1 activation. One‐way ANOVA with multiple comparisons post‐test. (E) The percentage of live BeWo cells in untreated and treated conditions was analyzed by flow cytometry. An example dot plot is shown on the left and a bar graph with mean and scatter dot blots of three experiments on the right. One‐way ANOVA with multiple comparisons post‐test. (F) Immunofluorescence staining for NLRP1 in treated and untreated BeWo cells. The panels show representative images (left), and the graph shows the quantification of NLRP1 oligomerization positive cells (right). Scale bars, 20 μm. The mean ± SD represents five visual fields. One‐way ANOVA with multiple comparisons post‐test. (G) The percentage of activated caspase‐1‐positive BeWo cells in untreated and treated conditions was analyzed by flow cytometry. An example histogram is shown on the left and a bar graph with mean and scatter dot blots of three experiments on the right. One‐way ANOVA with multiple comparisons post‐test. (H) The percentage of LDH release was measured by colorimetric assay and reported as a bar graph with mean and scatter dot blots for three experiments. Dimethyl sulfoxide (DMSO) was used as a control for the NLRP3 inhibitor MCC‐950 (MCC) and the NLRP1 and NLRP3 inhibitor ADS‐032 (ADS). One‐way ANOVA with multiple comparisons post‐test. (I) The percentage of live BeWo cells in untreated and treated conditions was analyzed by flow cytometry. Bar graphs with mean and scatter dot blots of three experiments are shown. DMSO was used as a control for MCC‐950 and ADS‐032. One‐way ANOVA with multiple comparisons post‐test. *p < 0.05, **p < 0.01, ***p < 0.001, ***p < 0.0001.
iRBCs significantly doubled the percentage of BeWo cells positive for activated caspase‐1 compared with untreated or RBC‐treated cells (Figure 2B). The increase in caspase‐1 activation correlated with a significant rise in LDH release, but not IL‐1β release, in iRBC‐treated BeWo cells (Figure 2C,D), along with a significant reduction in cell viability, as observed via flow cytometry (Figure 2E). The effects of iRBC treatment were comparable to those of the known NLRP1 activator, the DPP9 inhibitor talabostat/Val‐boroPro (VbP), in terms of both IL‐1β and LDH release (Figure 2C,D).
To assess the role of NLRP1 in inflammasome activation, we examined NLRP1‐positive oligomers. Treatment with iRBCs, but not RBCs, induced a significant increase in NLRP1‐positive oligomers in BeWo cells (Figure 3F), suggesting that iRBCs activate caspase‐1 through NLRP1. Since a specific NLRP1 inhibitor is not yet available, we repeated the in vitro assays using ADS‐032, an inhibitor of both NLRP1 and NLRP3 [25], as well as MCC‐950, a known NLRP3 inhibitor [24]. Treatment with ADS‐032 significantly reduced caspase‐1 activation (Figure 2G) and cell death, as measured by LDH release (Figure 2H) and cell viability via flow cytometry (Figure 2I).
*The NLRP1 rs11651270 variant affects the placental blood levels of IL‐6 and angiogenic factors angiopoietin 1 and VEGFR‐1. (A, B) Placental blood levels of IL‐1β were compared between non‐infected pregnant women (NI) and infected women (GM) (A) and between GM women with or without PM (B) by means of an unpaired t‐test. (C) Heatmap of Spearman r values calculated for the correlation between IL‐1β levels and other placental blood factors in non‐infected pregnant women (NI), infected women (GM), and GM women with or without (w/o) PM. (D) Heatmap of adjusted p value calculated for inflammasome SNVs in NLRP1 (rs12150220, rs11651270), NLRP3 (rs10754558, rs35829419), IL1B (rs16944, rs1143634), and IL18 (rs5744256) genes, and placental blood factors taking into account the GM women. Age, number of pregnancies, type of infection, and malaria episodes are included in the general linear model (GLM) as confounding variables. (E–G) Distribution of placental blood factors according to NLRP1 rs11651270 SNV are shown for GM women. The differences were calculated by the GLM adjusted for age, number of pregnancies, type of infection, and malaria episodes. *p < 0.05, **p < 0.01, ***p < 0.001, ***p < 0.0001.
Our pyroptosis assays are consistent with previous findings in human trophoblasts, where pyroptosis has been described as a pathogenic mechanism in gestational diseases, namely pre‐eclampsia [31] and obstetric antiphospholipid syndrome [32], even though NLRP1 has not been considered as the initial sensor.
To identify the possible mechanism linking the associated inflammasome variants with the outcomes of malaria infection during pregnancy, we performed an association analysis, taking into account available data from the measurements of cytokines, anaphylatoxins, and angiogenetic and growth factors in the placental blood. IL‐1β levels were increased in GM compared with NI placental blood (Figure 3A), and in GM with PM compared with GM without PM (Figure 3B). These levels of IL‐1β correlated positively with cytokines (TNF, IL‐6, IL‐12, and IL‐10), and anaphylatoxin C5a, and with vascular endothelial growth factor receptor 1 (VEGFR‐1) in all the groups. IL‐1β correlated inversely with angiopoietin‐1 receptor (TIE2) in all the groups, and with vascular endothelial growth factor receptor 2 (VEGFR‐2) and angiopoietin‐1 (ANG‐1) in all the groups except the PM one (Figure 3C) (supplementary material, Table S8).
When we performed multivariate analysis of placental blood factor levels according to SNV genotypes, we observed an intriguing association for the NLRP1 rs11651270 variant in GM women (Figure 3D). The polymorphic genotype C/C (Val1154) was significantly associated with high levels of ANG‐1 (Figure 3E) and low levels of VEGFR‐1 (Figure 3F). Additionally, we observed that rs11651270 was more frequent in women with low levels of IL‐6 (Figure 3G) (supplementary material, Table S9).
Collectively, this study shows that women carrying the gain‐of‐function variant p.Met1154Val in NLRP1 have a lower risk of malaria during pregnancy and placental malaria in an endemic area. Moreover, we confirm the crucial role of IL‐1β in controlling parasitemia but also as a risk factor for the development of PM.
Discussion
Our study has led to three main findings: it corroborates the role of NLRP1 and inflammasome genetics in pregnancy‐related complications. It also provides the first evidence of an association of the NLRP1 gene with Plasmodium infection. Furthermore, we highlight the dual role of IL‐1β genetics in malaria: although this cytokine supports the control of Plasmodium, it may have harmful effects during GM.
Animal models of Plasmodium‐associated diseases have emphasized the involvement of other inflammasome sensors, such as NLRP3 and AIM2, in detecting protozoan parasites in infected erythrocytes or hepatocytes [8]. During GM, NLRP3 complex activation has been observed in monocytes/macrophages and trophoblast cells [5].
NLRP1 has been identified as crucial in Toxoplasma gondii infection in both Lewis rats [15, 17] and humans [14, 16], indicating a potential role in the innate immune response against protozoan parasites. NLRP1 is mainly expressed in keratinocytes and endothelial cells but also in macrophages [30, 33], which are responsible for the uptake of infected erythrocytes and lymphocytes [5, 8]. In the placenta, trophoblasts express the receptor [7], and it appears to be responsible for mediating the oxidative stress response [18, 19].
The exact mechanism for NLRP1 activation in humans remains partially elusive. In the last decade, keynote studies have described two cleavage sites in NLRP1 necessary for activating the correspondent inflammasome. One is localized within the so‐called ‘tripwire’ region at the amino (N‐) terminal portion of the receptor, and the other, an autocleavage site, within the FIIND domain (Phe1212/Ser1213), which is masked by the interaction with dipeptidyl peptidase‐9 (DPP‐9) in the close/inactive conformation of NLRP1. Cleavage of the N‐terminal portion of NLRP1 by specific viral proteases [13] and/or the displacement of DPP‐9 mediated by its chemical inhibitor Val‐boroPro (talabostat) [23, 33] induces liberation of the carboxy‐ (C‐) terminal portion of NLRP1 which includes the CARD domain responsible for the recruitment and activation of caspase‐1. It remains controversial that the two cleavages/signals are needed for activation of NLRP1. The unfolded protein response (UPR)‐mediated pathway and ATF‐4 factor have also been described as upstream factors linked to NLRP1 activation [34]. NLRP1 is also restrained by thioredoxin‐1 (TRX1), and in response to ribotoxic stress, ZAKα and p38 MAP kinase induce phosphorylation of the tripwire linker motif, inducing activation of the NLRP1 inflammasome [35]. Recently, two studies demonstrated that ribotoxic stress induced by Pseudomonas aeruginosa and Corynebacterium diphtheriae EEF2‐targeting exotoxins leads to NLRP1 inflammasome activation [36, 37].
Therefore, Plasmodium infection may induce NLRP1 activation in several ways, including the above‐mentioned UPR [38] or p38 MAPK [39], and further investigations are needed to elucidate the NLRP1–parasite interaction.
p.Met1154Val (rs11651270) is reported to be a gain‐of‐function variant. Differently from p.Leu155His (rs12150220), which is localized within the PYD–NACHT linker region and possibly affected the N‐terminal cleavage site [13], the p.Met1154Val variant is localized within the FIIND domain and is thought to increase the displacement of DPP‐9, favoring activation of the receptor [23, 33].
Of note, the DPP9 gene was less expressed in Plasmodium‐infected monocytes of the Fulani people, an African ethnic group less susceptible to malaria [40], corroborating our findings.
Moreover, the similar frequency of rs11651270 in European and African populations suggests a possible common environmental factor acting across these two continents, such as the malaria that has been endemic in Africa and the Mediterranean region of Europe (up to 50–70 years ago). The other gain‐of‐function variant in NLRP1, rs12150220, which was not associated with GM, is not involved in DPP‐9 interaction. Furthermore, it appears to have been fixed at high frequency due to a previous viral epidemic, specifically in the European population (frequency of 50%, compared with 3–19% in non‐European populations) [41] Beyond our initial purpose, we demonstrated that P. falciparum iRBCs induce caspase‐1 activation and a lytic cell death compatible with pyroptosis in BeWo trophoblast cells. The observed oligomerization of NLRP1, along with the reduction in caspase‐1 activation and cell death in the presence of the inhibitor ADS‐032, suggests that NLRP1 is involved in inflammasome activation in BeWo cells in response to iRBCs. This is the first evidence of a role of NLRP1 in Plasmodium infection. Further investigations are needed to clarify whether iRBCs activate NLRP1 in trophoblasts due to its higher expression level compared with other receptors, such as NLRP3, or if activation depends on upstream pathogenic mechanisms. These preliminary findings support the genetic association data, and appear to be in accordance with recent studies on T. gondii infection in trophoblasts [16, 17, 18], suggesting a central role for NLRP1 in the placental response to apicomplexan parasites.
Conflicting data resulted from the genetic association study in PM. On the one hand, our findings revealed the protective effect of the NLRP1 rs11651270 and IL1B rs16944 variants against placental damage. On the other hand, we previously reported that high levels of IL‐1β contribute to PM in our mouse model [5]. This discrepancy may be due to the cell‐specific effect of inflammasome and NLRP1 or to the non‐canonical function eventually played by the receptor. Recent reports showed that Plasmodium infection induces ferroptosis, a cell death described in the placenta and correlated with NLRP1 [42], therefore representing another crucial link between NLRP1 and placental malaria. Moreover, functional studies on inflammasome SNVs are rare and normally conducted in peripheral blood mononuclear cells (PBMC) or hyper‐expression cell line models; therefore, our interpretation could be partial. As a proof of concept, while NLRP1 rs11651270 increases inflammasome activation in PBMCs [43], in the HEK‐293 cell line the same variant increases NLRP1 activation in the context of N‐terminal destabilization, but decreases NLRP1 activation on DPP‐9 inhibition [44]. Moreover, NLRP1 rs11651270 affects the levels of IL‐6, a cytokine important in malaria, especially in P. vivax malaria [45], suggesting that beyond the direct effect of the variant on IL‐1β release and/or pyroptosis, other secondary effects could be hypothesized.
Finally, it is interesting to point out our findings about NLRP1 and angiogenic factors. Angiogenic dysregulation is involved in placental abnormality, and in gestational malaria [46]. Up to now, no data have been available about the effect of inflammasome genes on angiogenesis. Therefore, our findings linking NLRP1 and VEGFR‐1 may open new interpretations of inflammasome and vessels’ biology, as previously suggested for endothelium [34].
Collectively, this association study shows that women carrying the gain‐of‐function variant p.Met1154Val in NLRP1 have a lower risk of GM. Our findings revealed that this variant significantly reduces critical factors involved in placental inflammation, such as VEGFR‐1 and IL‐6 levels, and placental damage, including syncytial nuclear aggregates and necrosis. To our knowledge, we show, for the first time, that P. falciparum‐infected erythrocytes activate the inflammasome in an NLRP1‐ and caspase‐1‐dependent manner.
Author contributions statement
VNCL designed and performed in vitro experiments. JAR determined cytokine and LDH dosage. LGM, ATR and ECR performed DNA isolation and genotyping. GW made the Plasmodium‐infected erythrocyte cultures. JGD and CRFM designed and organized the case/control cohort. AP designed the study and wrote the manuscript.
Supporting information
Figure S1. Epistasis analysis for parasitemia Figure S2. Priming does not affect BeWo activation Table S1. Taqman assays Table S2. Frequency of inflammasome variants in the gestational malaria (GM) cohort Table S3. Confounding variables (GLM analysis) Table S4. Detailed results of case/control association analysis Table S5. Detailed results of NLRP1 p.Met1184Val (rs11651270) analysis in malaria infection Table S6. Main results of the distribution of SNVs in the PM group Table S7. Detailed results of analysis of the SNV distribution according to placental factors Table S8. Correlation analysis of IL‐1β with placental blood factors Table S9. Placental blood factors’ association analysis
The reference list from the paper itself. Each links out to its DOI / PubMed record.
- 1Bauserman M , Conroy AL , North K , et al. An overview of malaria in pregnancy. Semin Perinatol 2019; 43: 282–290.30979598 10.1053/j.semperi.2019.03.018PMC 7895297 · doi ↗ · pubmed ↗
- 2Rogerson SJ , Hviid L , Duffy PE , et al. Malaria in pregnancy: pathogenesis and immunity. Lancet Infect Dis 2007; 7: 105–117.17251081 10.1016/S 1473-3099(07)70022-1 · doi ↗ · pubmed ↗
- 3Sánchez KE , Spencer LM . Pregnancy‐associated malaria: effects of cytokine and chemokine expression. Travel Med Infect Dis 2022; 47: 102282.35314344 10.1016/j.tmaid.2022.102282 · doi ↗ · pubmed ↗
- 4Bôtto‐Menezes C , Dos Silva Santos MC , Lopes Simplício J , et al. Plasmodium vivax malaria in pregnant women in the Brazilian Amazon and the risk factors associated with prematurity and low birth weight: a descriptive study. P Lo S One 2015; 10: e 0144399.26675007 10.1371/journal.pone.0144399 PMC 4687654 · doi ↗ · pubmed ↗
- 5Reis AS , Barboza R , Murillo O , et al. Inflammasome activation and IL‐1 signaling during placental malaria induce poor pregnancy outcomes. Sci Adv 2020; 6: eaax 6346.32181339 10.1126/sciadv.aax 6346 PMC 7056302 · doi ↗ · pubmed ↗
- 6Mulla MJ , Myrtolli K , Potter J , et al. Uric acid induces trophoblast IL‐1β production via the inflammasome: implications for the pathogenesis of preeclampsia. Am J Reprod Immunol 2011; 65: 542–548.21352397 10.1111/j.1600-0897.2010.00960.x PMC 3114103 · doi ↗ · pubmed ↗
- 7Pontillo A , Girardelli M , Agostinis , et al. Bacterial LPS differently modulates inflammasome gene expression and IL‐1β secretion in trophoblast cells, decidual stromal cells, and decidual endothelial cells. Reprod Sci 2013; 20: 563–566.23184659 10.1177/1933719112459240 · doi ↗ · pubmed ↗
- 8de Carvalho RVH , Zamboni DS . Inflammasome activation in response to intracellular protozoan parasites. Trends Parasitol 2020; 36: 459–472.32298633 10.1016/j.pt.2020.02.006 · doi ↗ · pubmed ↗