The Relationship Between Functional Parameters Derived from Diffusion-Weighted MRI and 18F-Fluorodeoxyglucose PET/CT in Head and Neck Squamous Cell Carcinoma: A Systematic Review and Meta-analysis
Ludovico Maria Garau, Marco Rensi, Livio Bastianutti, Roberto Bologna, Michele Povolato, Decio Capobianco, Fernando Di Gregorio

TL;DR
This study reviews how MRI and PET/CT imaging parameters relate in head and neck cancer, finding a moderate inverse correlation that could help predict treatment outcomes.
Contribution
A meta-analysis of 25 studies reveals a consistent inverse correlation between diffusion and glucose uptake metrics in head and neck cancer.
Findings
A pooled inverse correlation of ρ = -0.55 was found between apparent diffusion coefficients and standardized uptake values.
Low heterogeneity suggests a relatively consistent relationship across studies.
Not all studies confirmed the inverse correlation, possibly due to molecular or clinical factors.
Abstract
Over the past decade, a mechanistic hypothesis emerged linking limited water diffusivity (often reflecting densely packed, actively dividing tumor cells) to elevated glucose uptake in head and neck cancer. A systematic search of MEDLINE via PubMed identified eligible studies assessing the correlation between apparent diffusion coefficients from diffusion-weighted MRI and standardized uptake values from 18F-fluorodeoxyglucose PET/CT in head and neck cancer. Weighted correlation coefficients (ρ) were computed using Fisher Z transformations, and 95% confidence intervals (CIs) were calculated. Heterogeneity was evaluated with Higgins's inconsistency index, and potential publication bias was evaluated by visually inspecting funnel plots. A total of 25 articles, encompassing 790 patients, were systematically appraised to summarize the available evidence regarding the relationship between…
Genes, proteins, chemicals, diseases, species, mutations and cell lines named across the full text — each resolved to its canonical identifier and authoritative record.
Click any figure to enlarge with its caption.
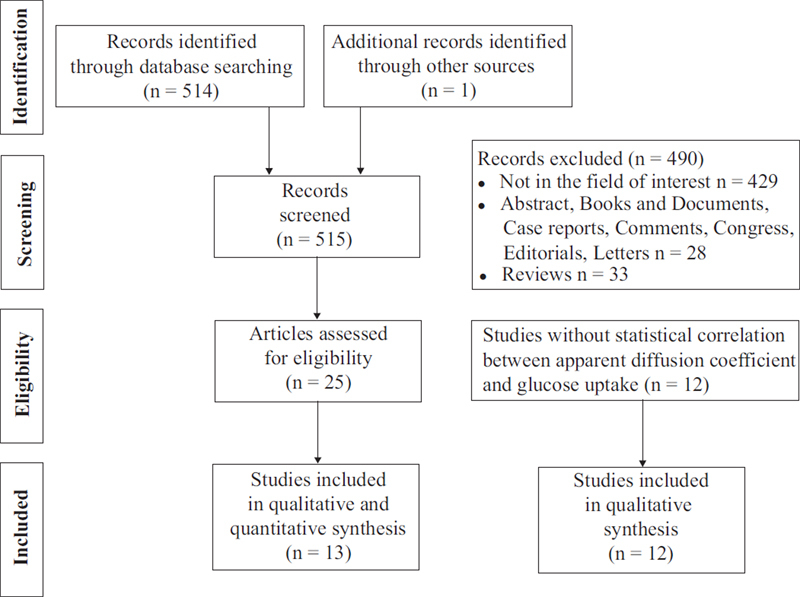 Fig. 1
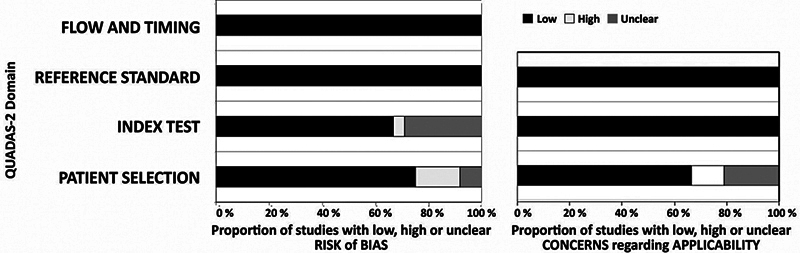 Fig. 2
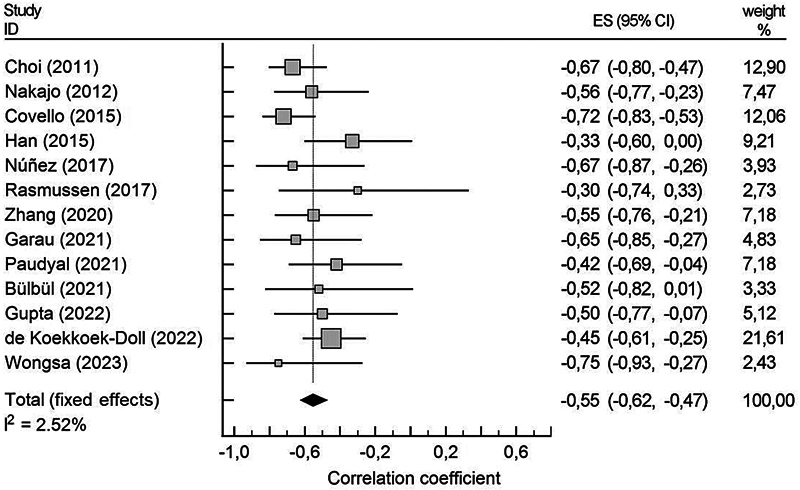 Fig. 3
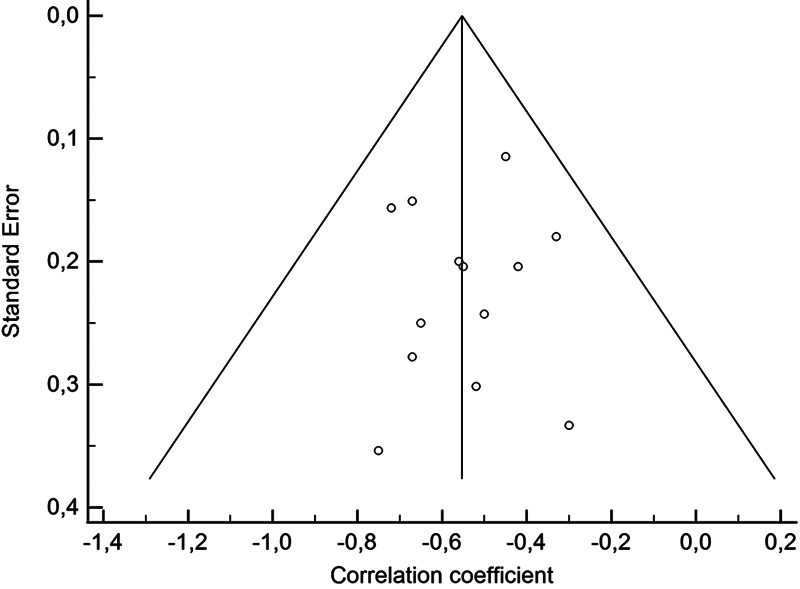 Fig. 4
| Year | Study | Design | Tumor (T; N) | Oral | Orop | Hypo | Rino | Sinus | Laryn | Other | Pt |
|---|---|---|---|---|---|---|---|---|---|---|---|
| 2011 |
Fruehwald-Pallamar
| Pros | T | 20 | 5 | 3 | 2 | 1 | 0 | 0 | 31 |
| 2011 |
Choi
| Retro | T | 32 | 12 | 0 | 0 | 3 | 0 | 0 | 47 |
| 2012 |
Nakajo
| Retro | T | 3 | 8 | 9 | 1 | 4 | 1 | 0 | 26 |
| 2012 |
Nakamatsu
| Retro | N | 5 | 1 | 12 | 1 | 0 | 4 | 1 | 24 |
| 2013 |
Varoquaux
| Retro | T | 6 | 13 | 6 | 3 | 1 | 3 | 2 | 33 |
| 2014 |
Ng
| Pros | N | 0 | 37 | 32 | 0 | 0 | 0 | 0 | 69 |
| 2015 |
Covello
| NA | T | 6 | 4 | 0 | 4 | 3 | 25 | 4 | 44* |
| 2015 |
Han
| Retro | T | 8 | 9 | 4 | 8 | 2 | 2 | 0 | 34 |
| 2015 |
Gawlitza
| Retro | T | 5 | 7 | 3 | 0 | 0 | 2 | 0 | 17** |
| 2015 |
Martins
| Pros |
T + N
| 0 | 16 | 2 | 0 | 0 | 4 | 1 | 23 |
| 2016 |
Surov
| Pros | T | NA | NA | NA | NA | NA | NA | NA | 11 |
| 2017 |
Núñez
| Pros |
T + N
| 0 | 5 | 0 | 0 | 0 | 0 | 1 | 6 |
| 2017 |
Leifels
| Pros | T | 7 | 14 | 7 | 0 | 0 | 5 | 0 | 34 |
| 2017 |
Rasmussen
| Pros | T | NA | NA | NA | NA | NA | NA | NA | 17 |
| 2018 |
Dang
| Pros | T | 11 | 0 | 5 | 4 | 0 | 3 | 0 | 23 |
| 2020 |
Cheng
| NA | T | 0 | 0 | 0 | 35 | 0 | 0 | 0 | 35 |
| 2020 |
Çolak
| Retro | T | 4 | 3 | 4 | 14 | 2 | 8 | 1 | 36 |
| 2020 |
Zhang
| Pros | T | 0 | 0 | 9 | 15 | 0 | 3 | 0 | 27 |
| 2021 |
Garau
| Retro | T | 5 | 23 | 0 | 8 | 0 | 0 | 0 | 36*** |
| 2021 |
Paudyal
| Pros | N | 0 | 22 | 0 | 0 | 0 | 0 | 1 | 23 |
| 2021 |
Bülbül
| Retro | T | 5 | 2 | 0 | 2 | 0 | 5 | 0 | 14 |
| 2022 |
Gupta
| Retro | T | NA | NA | NA | NA | NA | NA | NA | 20 |
| 2022 |
Freihat
| Retro | T | 22 | 0 | 32 | 0 | 0 | 15 | 0 | 71 |
| 2022 |
de Koekkoek-Doll
| Retro | N | 19 | 32 | 4 | 2 | 3 | 8 | 10 | 78 |
| 2023 |
Wongsa
| Retro | T | 5 | 0 | 0 | 3 | 0 | 0 | 1 | 11 |
| Year | Study | PET/CT | MRI | Interval between PET and MRI | Segm. technique | Best Correlation | ||||
|---|---|---|---|---|---|---|---|---|---|---|
| FDG (MBq) | Acq | Tbp (min) | Field | b-value | Mean time | PET | MRI | Functional parameters | ||
| 2011 |
Fruehwald-Pallamar
| 300 | 50 | 3 | 3 | 0,800 | 14 | M | S | NA |
| 2011 |
Choi
| 5.2/kg | 60 | 2 | 1.5 | 0,1000* | 14 | M | M | SUVmean vs ADCratio |
| 2012 |
Nakajo
| 3.7/kg | 60 | NA | 1.5 | 0,800 | 13 | M | M | SUVmax vs ADCmean |
| 2012 |
Nakamatsu
| 166–320 | 60 | 2 | 1.5 | 0,1000 | 20 | M | M | SUVmax vs ADCmin |
| 2013 |
Varoquaux
| 370 | 60 | 3 | 1.5; 3 | 0,1000 | 3.5 | M | M | NA |
| 2014 |
Ng
| 370 | 50-70 | 3 | 3 | 0,800 | NA | M | S | NA |
| 2015 |
Covello
| 406 ± 40 | 81 ± 15 | 3 | 3 | 0,500, 800 | 1, same time | M | M | SUV vs ADCmean |
| 2015 |
Han
| 5/kg | 60 | 2.5 | 1.5 | 0,1000 | 3.2 | M | S | SUV vs ADCmean |
| 2015 |
Gawlitza
| 5/kg | 60–120 | NA | 3 | 0,800 | 1, same time | M | S | SUVmax vs ADCmin |
| 2015 |
Martins
| 5.6/kg | 60–120 | NA | 1.5 | 0,1000 | 1, same time | NA | NA | NA |
| 2016 |
Surov
| 5/kg | 60–121 | NA | 3 | 0,800 | 1, same time | M | S | NA |
| 2017 |
Núñez
| 370 ± 37 | 60 | NA | 1.5 | 0, 600, 1000 | NA | M | M | SUVmean vs ADCmean |
| 2017 |
Leifels
| 4/kg | 60-300 | NA | 3 | 0, 800 | 1, same time | M | M | SUVmax vs ADCmin |
| 2017 |
Rasmussen
| 4/kg | 100–120 | 1 bed, 20 | 3 | 0, 500, 1000 | 3 | M | M | SUV vs ADC |
| 2018 |
Dang
| 3.7–7.4 /kg | 119-151 | 1 bed, 25 | 3 | 0, 800 | 1, same time | M | M | NA |
| 2020 |
Cheng
| 2.9–3.7 /kg | 50-70 | 2 | 3 | 0,50,200, 500,800, | NA | M | M | NA |
| 2020 |
Çolak
| 3.7/kg | 60 | 1.8 | 3 | 0,800 | 15 | M | M | NA |
| 2020 |
Zhang
| 3.7/kg | 60 | 1, 10 | 3 | 0,800 | 14 | M | S | MTV vs ADCmean |
| 2021 |
Garau
| 3.7/kg | 60 | 3 | 1.5 | 0,1000 | 13 | M | S | SUVpeak vs ADCsd |
| 2021 |
Paudyal
| 300–450 | 70–80 | 5 | 3 | 0,20,50, 80,200, 300,500, 800* | NA | M | S | SULmean vs ADC |
| 2021 |
Bülbül
| 4/kg | 60 | 1.5 | 1.5 | 0,800 | 10 | M | M | SUVmax vs ADCmean |
| 2022 |
Gupta
| NA | NA | NA | NA | NA | NA | NA | NA | MTV vs ADCmean |
| 2022 |
Freihat
| NA | NA | 1 bed | 3 | NA | 1, same time | M | M | NA |
| 2022 |
de Koekkoek-Doll
| 190-240 | 50-70 | 3 | 3 | 0,100, 200,300, 500,800, 1000 | NA | M | M | SUVmax vs ADCmin |
| 2023 |
Wongsa
| 2.5/kg | 60 | NA | 3 | 0,800 | 1, same time | M | S | SUVmax vs ADCmean |
| Clinical | Patients without correlation between ADC and SUV | Patients with correlation |
|---|---|---|
|
| ||
| Men | 51 (257) | 49 (245) |
| Woman | 58 (75) | 42 (54) |
|
| ||
| Oral cavity | 28 (63) | 72 (99) |
| Oropharynx | 36 (74) | 64 (138) |
| Hypopharynx | 35 (85) | 65 (48) |
| Rhinopharynx | 27 (58) | 43 (44) |
| Sinus | 21 (4) | 79 (15) |
| Larynx | 25 (33) | 75 (55) |
| Other | 15 (4) | 85 (18) |
|
| ||
| T1 | 41 (23) | 59 (33) |
| T2 | 61 (59) | 39 (39) |
| T3 | 71 (87) | 29 (36) |
| T4 | 67 (94) | 33 (45) |
|
| ||
| G1 + G2 | 33 (47) | 67 (77) |
| G3 | 42 (79) | 58 (111) |
|
| 48 (372) * | 52 (418) * |
Peer Reviews
No public reviews on file for this paper yet. If you reviewed it on a platform where reviews are public (OpenReview, ICLR, NeurIPS, ICML), you can paste yours below so the community can read it here.
Videos
No videos yet. Explain this paper in a talk, walkthrough, or lecture? Add one.
Taxonomy
TopicsRadiomics and Machine Learning in Medical Imaging · MRI in cancer diagnosis · Medical Imaging Techniques and Applications
Introduction
Head and neck cancers originating from the mucosal epithelium of the oral cavity, oropharynx, nasopharynx, paranasal sinuses, external auditory canal, larynx, and hypopharynx are collectively referred to as head and neck squamous cell carcinoma (HNSCC). 1 Globally, HNSCC is the seventh most common cancer, accounting for 1.9% of all cancer-related deaths, underscoring the urgent need for targeted research and intervention strategies. 2 The National Comprehensive Cancer Network and the European Society for Medical Oncology advocated the integrated use of magnetic resonance imaging (MRI) and 18F-fluorodeoxyglucose (18F-FDG) positron emission tomography/computed tomography (PET/CT) for the diagnostic evaluation of HNSCC. 3 4
Diffusion-weighted (DW) MRI offers both qualitative and quantitative data by measuring the random movement of water molecules within tissues. The apparent diffusion coefficient (ADC), expressed in square millimeters per second, quantifies this water diffusion. In HNSCC, malignant tumors generally exhibit restricted diffusion due to increased cellularity. 5 Combining DW imaging with conventional MRI improves tumor staging, treatment response assessment, and prognosis, establishing DW MRI as a valuable clinical tool. 6
Furthermore, HNSCC often reveals increased glucose uptake at the cellular level. Consequently, 18F-FDG PET/CT is recommended as a staging strategy for subgroups of HNSCC patients at higher risk of metastasis, particularly those in stage III and stage IV. 7 The most common parameter for semi-quantifying metabolic activity is the standardized uptake value (SUV), which represents the ratio of tissue radioactivity uptake to the injected dose, normalized for body weight. Additionally, metabolic tumor volume (MTV), when multiplied by the mean SUV to calculate total lesion glycolysis (TLG), provides volumetric measurements of tumor burden.
Since 2011, increasing attention has been directed toward a biologic-mechanistic hypothesis suggesting a negative correlation between diffusion restriction, reflecting high proliferative activity, and increased glucose metabolism in HNSCC. 8 9 Understanding the relationship between random water molecule displacement and glucose metabolism could enhance knowledge of tumor biology and have clinical implications for early diagnosis, treatment outcome, and treatment planning.
Subsequently, a ratio between ADC and SUV was proposed to account for the interplay between water molecule diffusion and glucose metabolism, demonstrating enhanced accuracy over ADC or SUV alone in distinguishing benign from malignant tumors. 10 More recently, however, contradictory findings have challenged this theory, suggesting that hypercellularity and glucose hypermetabolism may represent distinct and uncorrelated biological phenomena in HNSSC. 11 12
Given conflicting results, this systematic review aims to explore the correlations between ADC and SUV in HNSCC.
Review of Literature
This study was performed in accordance with and in adherence to the “Preferred Reporting Items for Systematic Reviews and Meta-Analyses” (PRISMA) statement. 13 14 Before starting the literature search, a protocol defining the research question, search methods, inclusion criteria, quality assessment, data extraction, and statistical analysis was developed.
Search Strategy
The PubMed interface was independently interrogated by two researchers (G. LM. and D. F.) to find relevant published articles that examined the relationship between ADC and SUV in HNSCC.
We used a search algorithm based on a combination of terms, as follows: ((positron emission tomography) OR (PET) OR (positron emission tomography/computed tomography) OR (PET/CT) OR (positron emission tomography-computed tomography)) AND ((18F- FDG) OR (fluorodeoxyglucose) OR (FDG) OR (18FDG) OR (FDG-F18)) AND ((apparent diffusion coefficient) OR (ADC)) AND ((Diffusion Magnetic Resonance Imaging) OR (Diffusion MRI) OR (Diffusion Weighted MRI) OR (DWI) OR (diffusion-weighted magnetic resonance imaging) OR (MRIDWI) OR (diffusion-weighted imaging) OR (diffusion- weighted MRI)). 15 For verification purposes, the following were electronically searched: MEDLINE (through PubMed), Embase (through OVID), Web of Science, Scopus, Cochrane Library, and ClinicalTrials.gov. To expand our search, the references of the retrieved articles were also screened for additional studies.
The search, started on January 1, 2006, was updated until June 31, 2024. The full-text versions of the studies were obtained.
Study Selection
The included articles fulfilled the following inclusion criteria: (1) full-text papers published in a peer-reviewed scientific journal, focused on untreated patients with HNSCC; (2) index test based on DW MRI and PET/CT (or PET/MRI); (3) histopathology as the reference standard proving HNSCC; (4) sufficient data to retrieve the measure and direction of concordance between ADC and SUV. Moreover, (5) studies with mixed populations (including both untreated and treated patients) were considered for meta-analysis under the following conditions to minimize phenomena that could influence the correlation between ADC and SUV: if the statistical correlation specific to untreated patients could be isolated from treated patients; if the mixed population was enrolled at least 6 weeks after any treatment (to minimize the impact of residual inflammatory phenomena), 16 and lesion segmentation techniques on MRI excluded large vessels (to prevent signal contamination by flowing blood), cystic regions (to avoid non-tumoral fluid artifacts), and necrotic areas (to ensure non-viable tissue did not bias the correlation).
Studies were included in the meta-analysis only if they reported statistically significant relationship between functional parameters, as this was necessary to ensure consistency in the pooled correlation coefficient calculation; conversely, studies were systematically collected only for qualitative analysis if no significant relationship was reported.
Data Extraction
The data were extracted from the included literatures by two investigators (G. LM. and R. M.) independently, and a standard pro forma was used to compile the following:
a) basic study data (authors, year of publication, country of origin, study design; b) patient characteristics (sample size, gender, median age); c) tumor type (primary HNSSC with or without metastatic lymph nodes); d) tumor anatomical site, such as the oral cavity (including the lips, buccal mucosa, gums, front two-thirds of the tongue, floor of the mouth below the tongue, hard palate, and retromolar trigon); the oropharynx (including the back third of the tongue, soft palate, tonsils, and side and back walls of the throat); the hypopharynx; the rinopharynx; the paranasal sinuses; the larynx; and unusual site, such as external auditory canal; e) staging and grading of the tumors, when possible; f) semi-quantifications of functional parameters derived from 18F-FDG PET/CT and DW MRI (average and maximum values); g) statistical correlations between functional parameters; h) segmentation methods of tumor images used (manual, automatic or semiautomatic); i) technical aspect (vendors) and acquisition protocols.
Extracted data were transferred to a Microsoft Excel spreadsheet (Microsoft, Redmond, WA).
Quality Assessment
The quality of each study was independently appraised by 3 observers using the QUADAS-2 tool. 17 The QUADAS-2 tool assessed the risk of bias based on 4 domains (patient selection, index test, reference standard, and flow and timing) in terms of risk of bias. Additionally, the first three domains were evaluated for concerns regarding applicability. The provided signaling questions of the QUADAS-2 tool were used to assign judgments of “low”, “high,” or “unclear” risk rating.
Statistical Analysis
Statistical analysis was carried out by using the MedCalc Statistical Software version 20.1.118 (MedCalc Software, Ostend, Belgium; https:// www. medcalc. org; 2022).
The 95% confidence intervals (CIs) and the weighted summary correlation coefficient between ADC and SUV were calculated by using a Fisher Z transformation of the correlation coefficients. 18 19 Pooled data were presented with 95% confidence interval values (95% CI). A statistical difference of pooled rates was present if there was no overlap among the 95% CI values.
The Higgins' inconsistency index (I ^2^ ) was used to assess data heterogeneity. An I ^2^ index > 50% indicated heterogeneity among studies. 20 The interpretation of heterogeneity was performed at a significance level of P ≤ 0.05. The choice between fixed or random effects models for meta-analytic estimates depended on the degree of inconsistency, with the random effects model selected based on the DerSimonian and Laird method when substantial heterogeneity was present. 21 Publication bias was assessed through visual inspection of funnel plots.
Correlation strength was classified as very weak (ρ ≤ ± 0.19), weak (ρ ± 0.20–0.39), moderate (ρ ± 0.40–0.59), strong (ρ ± 0.60–0.79), very strong (ρ ± 0.80–0.99), and perfect (ρ = ± 1).
Data Synthesis
Selection and Characteristics of Studies
The comprehensive computer literature search revealed 515 articles ( Fig. 1 ). According to the inclusion criteria, twenty-five articles, including 790 patients 8 9 11 12 22 23 24 25 26 27 28 29 30 31 32 33 34 35 36 37 38 39 40 41 42 were systematically appraised to summarize the available evidence concerning the relationship between functional parameters in HNSCC ( Table 1 ). The oropharynx was the most common tumor site, comprising 31% of all HNSCC cases, followed by the oral cavity and hypopharynx (20%), nasopharynx (15%), larynx (11%), and paranasal sinuses (3%).
Flowchart detailing the process of inclusion and exclusion of articles in this meta-analysis.
Tumors with limited extension, not exceeding 2 cm in their greatest dimension, comprised 13% of the sample. Additionally, 26% were classified as T2, 29% as T3, and 32% presented with moderately advanced or very advanced local disease (T4). Metastatic lymph nodes were reported in approximately 45% cases. However, lymph node status and distant metastases were not described in twelve articles. Poorly and well-or-moderately-well differentiated tumors represented 36% and 64% of the sample, respectively.
Quality Assessment
The QUADAS-2 analysis ( Fig. 2 ) showed the quality assessment results for the studies included in this systematic review. In the domain of patient selection, we identified unclear risk of bias in six studies that focused solely on metastatic lymph nodes (comprising 27% of the sample) or included primary tumors with metastatic lymph nodes 23 25 31 34 38 40 ; additionally, three studies were judged to have an unclear risk of bias because they did not specify whether patients were enrolled consecutively. 28 36 37 Furthermore, three studies were assessed as having a high risk of bias owing to a small sample size. 10 25 35 High applicability concerns were associated with studies that included both primary and some recurrently treated HNSCC cases. 22 39 41
Summary results of QUADAS-2 analysis of all studies meeting inclusion criteria.
In the domain of index test, unclear risk of bias emerged for seven studies not clearly describing if cystic or necrotic area were excluded during lesion segmentation 10 25 26 29 35 36 39 ; since 18F-FDG has a half-life of 109.7 minutes, high risk was attributed when PET/CT imaging acquisition occurred more than 300 minutes after radiotracer injection ( Table 2 ), potentially leading to SUV underestimation. 26
Meta-Analysis: The Correlation Between ADC and SUV
Thirteen studies, including 367 (out of 790) patients, reported a statistically significantly correlation between ADCs and SUVs, with a pooled estimate of correlation coefficient of ρ = – 0.55 (95% confidence interval [CI], – 0.624 to – 0.473). Including additional data from two studies that observed a trend towards correlation between functional parameters, 22 26 the sample size increased to 418 patients ( Table 3 ). The I ^2^ index described and quantified the magnitude of heterogeneity, representing the part of total variation attributable to between-studies variance. 43 Notably, a low I ^2^ index of 2.5% emerged ( Fig. 3 ). The summarized ρ value and I ^2^ index did not change substantially even with the inclusion of two studies 22 26 reporting a trend toward correlation (P = 0.008, for a total of 51 patients). Due to the limited sample size and low heterogeneity, subgroup analyses were not conducted. Finally, the corresponding funnel plots indicated that most research results were close to axis, demonstrating the absence of publication bias in these studies ( Fig. 4 ).
Plot of pooled values derived from correlations between apparent diffusion coefficient and standardized uptake value.
Funnel plots of the 13 studies included in this meta-analysis. For each effect size, data are plotted against their standard error. Vertical solid line inside the triangle indicated the summarized estimate of the effect size; oblique lines showed the 95% confidence limits around the summarized effect size.
Discussion
Fifty-two percent of the sample showed an inverse significant correlation between water diffusion restriction and glucose uptake in HNSCC. Given the degree of correlation, which reached a moderate intensity of ρ = – 0.55 (95% CI, – 0.624 to – 0.473; P < 0.05), these functional parameters appear to exhibit a certain degree of connection. This finding may be explained as follows: the viable tumoral area with increased cellular glucose metabolism also demonstrates reduced extracellular Brownian motion of water molecules because of high tumoral cellularity.
Previously, meta-analyses by Deng and Shen identified weak negative correlations between ADC and SUV values in HNSCC, with correlation coefficients of ρ = −0.31 (95% CI: – 0.44 to – 0.19) and ρ = – 0.27 (95% CI: −0.39 to −0.15) 15 44 ; however, both analyses included only six studies, whereas this meta-analysis summarized a larger sample size to provide more robust and reliable results. Consistently, it has been shown that ADC correlated well with cellular density and nuclear cytoplasmic ratio in different epithelial malignancies, such as prostatic cancer, renal cell carcinoma, laryngeal and hypopharyngeal carcinomas. 24 45 Similarly, several studies reported a correlation between tumor fluorodeoxyglucose uptake and markers of cell proliferation, such as DNA replication in the S phase or Ki-67 expression. 46 47 Furthermore, an inverse relationship between SUV and standard deviation of ADC (ADCsd) is noteworthy. 30 The ADCsd reflect intra-tumor variability in cell proliferation, offering insights into regions where water diffusion is restricted or facilitated based on tissue characteristics. This finding suggested that uniform HNSCC tissue may be associated with higher glycolytic activity and a more aggressive phenotype, while post-treatment changes, such as inflammation, fibrosis, and proteinaceous fluid, could lead to heterogeneous tissue with broader diffusion restriction values and reduced glucose uptake, potentially influenced by macrophage activity. 5 48 49
On the other hand, not all studies in this systematic review confirmed these findings. It is plausible that various factors, ranging from molecular characteristics to clinical settings, influenced the relationship between water diffusion restriction and glucose uptake. Such factors could include sample characteristics, operator variability, acquisition protocols, and hardware configurations.
Regarding sample characteristics, a high percentage of moderately or very advanced (T4) nasopharyngeal tumors exhibited no correlation between ADC and SUV. These cases were more likely to present necrosis due to the aggressive nature of the tumors, compared to earlier-stage HNSCC. Necrotic, non-metabolic tissue may restrict water diffusion, yielding lower ADC values, while exhibiting mild surrounding metabolic activity due to inflammatory processes. Conversely, an inverse correlation between ADC and SUV was observed in a significant proportion of early-stage oro-oropharyngeal cancers, likely due to the better preservation of functional characteristics of the tumor tissue. 34 36
Unfortunately, this meta-analysis evaluated the correlation between ADC and SUV without accounting for tumor differentiation grade due to insufficient data. However, the possibility that glucose uptake and hypercellularity are closely linked in more undifferentiated lesions cannot be ruled out, as widely reported in several tumors. 50 51 52 53 54
Importantly, operator variability in manual placement of regions-of-interest (ROIs) and lesion segmentation techniques could have influenced the correlation between ADC and SUV. 55 In particular, the inclusion of hypo-metabolic or non-metabolic areas, both hypo-restricted (cystic) and/or hyper-restricted (necrotic), alongside viable tumor tissue during segmentation, may have affected ADC values. 10 25 35 36 For instance, ROIs drawn along tumor borders may encompass segmented tissue with high or low ADC value associated with a low or absent metabolic activity. In contrast, the calculation of metabolic activity by semiautomatic thresholding could be less dependent on operator variability and tumor composition compared to manual method segmentation. 10 23 29 30 31 35 37 42
Differences in imaging protocols and instrumentation likely also influenced the findings. PET/MRI systems enable the acquisition of metabolic activity and diffusion-weighted data in the same session, reducing spatial and temporal discrepancies between the two imaging modalities and ensuring a more reliable comparison between SUV and ADC. 35 By contrast, studies where PET and MRI were acquired separately often involved a time delay of up to twenty days (as observed in this meta-analysis) between scans. 38 During this period, necrosis with potentially associated colliquative phenomena and variation in metabolic activity may occur, confounding the correlation between SUV and ADC.
The understanding of the interplay between ADC and SUV may provide valuable insights for tumor management. During early detection, the SUV-to-ADC ratio could potentially indicate lesion aggressiveness, allowing for more targeted interventions. 10 Biopsy guidance might also be improved by prioritizing areas with restricted diffusivity and higher radiopharmaceutical uptake, which could enhance diagnostic accuracy. Moreover, the integration of ADC and SUV as imaging biomarkers may aid in stratifying patients based on tumor aggressiveness, potentially guiding tailored treatment strategies. 54 Additionally, incorporating diffusion- and metabolism-based imaging in radiotherapy planning might refine tumor contouring and spare healthy tissue, reducing side effects. 31 Changes in the relationship between ADC and SUV during therapy could finally serve as indicators of tumor response; monitoring a potentially increasing ADC (reflecting tumor structural changes with reduced cellular density) alongside a decrease in metabolic activity may also facilitate tailoring interventions to individual response profiles.
Our study has several limitations. First, the exclusion of papers reporting non-significant correlations between ADC and SUV, necessitated by the statistical method employed, may have limited the pooled analysis. 18 19 However, it provided a quantitative benchmark that future studies on the same topic can test in biologically homogeneous sub-groups; moreover, we thoroughly analyzed all studies identifying factors that might explain the lack of correlation (e.g., advanced-stage tumors with distinct environmental characteristics) to provide a balanced interpretation. Secondly, the variability in tumor populations across studies may have introduced bias; for instance, HNSSC can exhibit distinct genomic features based on their etiology, such as HPV-positive tumors being associated with TRAF3 alterations, while HPV-negative and smoking-related tumors are characterized by TP53 mutations and CDKN2A inactivation; such genetic variability may affect tumor behavior and imaging biomarkers, potentially influencing the observed correlations in this meta-analysis. 56 Furthermore, other sources of error may be present, such as the partial volume effect, which may have altered functional values, especially for small lesions, weakening the correlation between SUV and ADC. The variability in imaging instrumentation, acquisition protocols, segmentation method and MRI to PET/CT interval likely contributed to inconsistencies in the observed functional values or correlation, and accounted for part of the between-study variability; for instance, the wide range of b-values across studies (with value exceeding 1000 s/mm ^2^ in three studies), as higher b-values emphasize restricted water diffusion and yield lower ADC values. 28 31 36 However, because all ADC values within a given study were proportionally affected, their relative distribution remained nearly unchanged, with correlation between ADC and SUV expected to remain stable. Finally, the relatively small sample in some studies limited the reliability of their findings.
Conclusion
This systematic review examined the relationship between functional parameters obtained from DW MRI and 18F-FDG PET/CT in patients with HNSCC. Although a significant inverse correlation between cellular proliferation and glycolytic activity was observed in many patients, this relationship was not consistently reported across all papers. This inconsistency highlights the need for caution in interpreting these findings. Future studies should focus on more homogeneous samples with consistent morphological and molecular characteristics to ensure greater comparability and robustness of results. Moreover, we encourage future investigations to adopt harmonized DWI/PET acquisition parameters and protocols, so that true modifiers can be isolated without confounding technical variability. Nevertheless, the statistical correlations observed suggest that leveraging the relationship between ADC and SUV, including their reciprocal variations, could provide additional context to better understand tumor biology. Exploring these dynamic interactions in clinical practice may offer preliminary insights into diagnostic and prognostic evaluations, potentially contributing to the identification of patients who might benefit from tailored therapeutic strategies.
The reference list from the paper itself. Each links out to its DOI / PubMed record.
- 1Colevas A D Yom S S Pfister D GNCCN Guidelines Insights: Head and neck cancers, version 1.2018 J Natl Compr Canc Netw 2018160547949029752322 10.6004/jnccn.2018.0026 · doi ↗ · pubmed ↗
- 2Schwartz S M Epidemiology of Cancer Clin Chem 2024700114014938175589 10.1093/clinchem/hvad 202 · doi ↗ · pubmed ↗
- 3Caudell J J Gillison M L Maghami ENCCN Guidelines® Insights: Head and Neck Cancers, Version 1.2022 J Natl Compr Canc Netw 2022200322423435276673 10.6004/jnccn.2022.0016 · doi ↗ · pubmed ↗
- 4Verdonck-de Leeuw I Dawson C Licitra L European Head and Neck Society recommendations for head and neck cancer survivorship care Oral Oncol 202213310604735932637 10.1016/j.oraloncology.2022.106047 · doi ↗ · pubmed ↗
- 5Wang J Takashima S Takayama F Head and neck lesions: characterization with diffusion-weighted echo-planar MR imaging Radiology 20012200362163011526259 10.1148/radiol.2202010063 · doi ↗ · pubmed ↗
- 6Rumboldt Z Gordon L Gordon L Bonsall R Ackermann S Imaging in head and neck cancer Curr Treat Options Oncol 2006701233416343366 10.1007/s 11864-006-0029-2 · doi ↗ · pubmed ↗
- 7Cacicedo J Navarro A Del Hoyo O Role of fluorine-18 fluorodeoxyglucose PET/CT in head and neck oncology: the point of view of the radiation oncologist Br J Radiol 201689(1067):2.0160217 E 710.1259/bjr.20160217 PMC 512483327416996 · doi ↗ · pubmed ↗
- 8Fruehwald-Pallamar J Czerny C Mayerhoefer M E Functional imaging in head and neck squamous cell carcinoma: correlation of PET/CT and diffusion-weighted imaging at 3 Tesla Eur J Nucl Med Mol Imaging 201138061009101921465255 10.1007/s 00259-010-1718-4 · doi ↗ · pubmed ↗