Fetal head station during artificial rupture of membranes: a large retrospective cohort study
Yishai Sompolinsky, Joshua Guedalia, Naama Vilk-Ayalon, Sarah M. Cohen, Shirley Greenbaum, Doron Kabiri, Simcha Yagel, Michal Lipschuetz

TL;DR
This study shows that the position of the baby's head during a medical procedure to break the amniotic sac is linked to faster delivery and fewer complications.
Contribution
The study introduces fetal head station as a key factor influencing delivery timing and outcomes, beyond cervical dilation.
Findings
Lower fetal head station at AROM is associated with shorter time to delivery.
Lower fetal head station is linked to fewer cesarean deliveries and complications.
The association is stronger in women who have given birth before.
Abstract
Artificial rupture of membranes (AROM) is a common intervention during delivery, usually done in order to expedite delivery. Studies to determine optimal timing of AROM according to cervical dilation were inconclusive. However, other important factors, which are known to be associated with timing of delivery were ignored. One of these factors is fetal head station (FHS). We sought to investigate the association between FHS during AROM and time to delivery and other obstetrical outcomes. A retrospective cohort study encompassing data from labors during a 12-year period were analyzed. All cases of singleton, term pregnancy with documented AROM time were included. The study population was stratified by parity. This study cohort included 45,898 singleton, term vaginal delivery parturients with time stamp at time of AROM and delivery. Stratification by parity yielded 11,947 primiparas…
Genes, proteins, chemicals, diseases, species, mutations and cell lines named across the full text — each resolved to its canonical identifier and authoritative record.
Click any figure to enlarge with its caption.
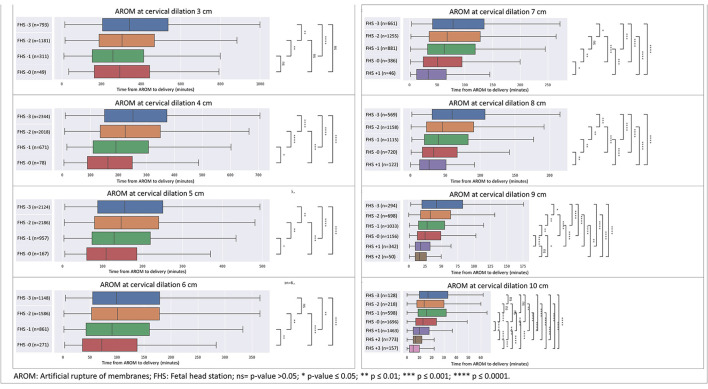 Figure 1
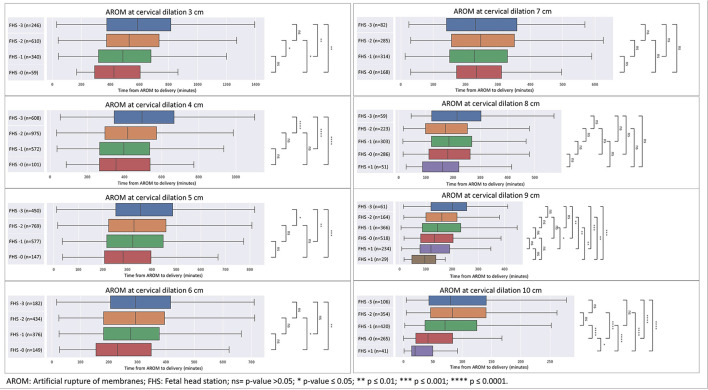 Figure 2
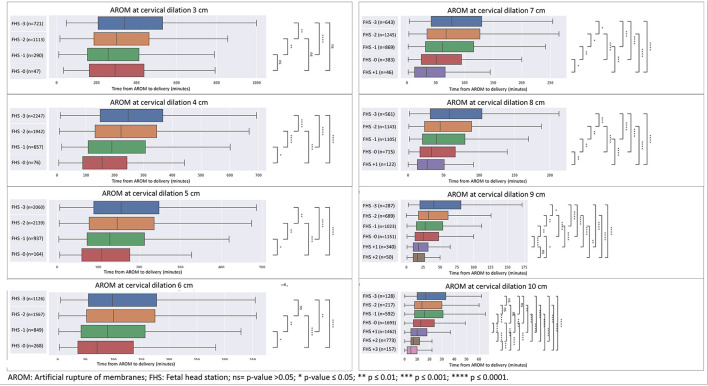 Figure 3
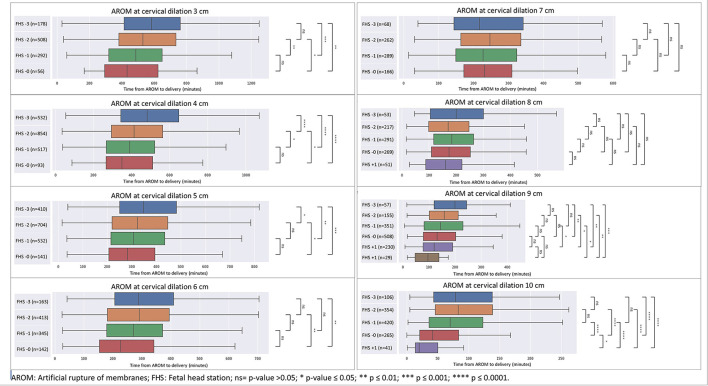 Figure 4
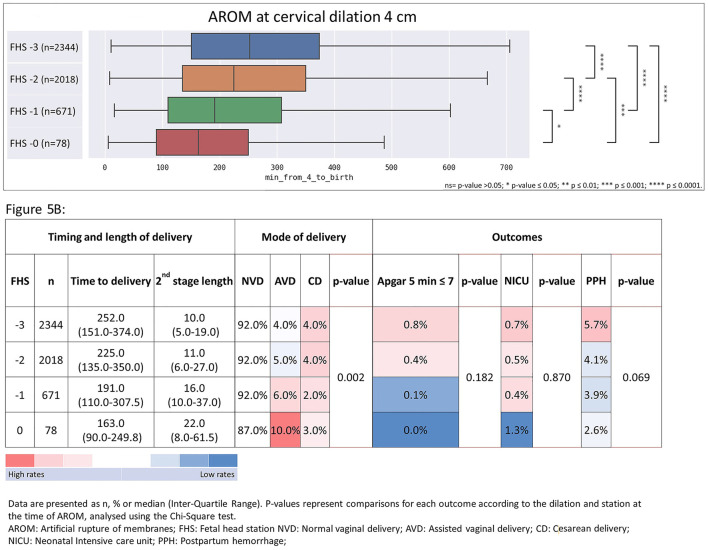 Figure 5
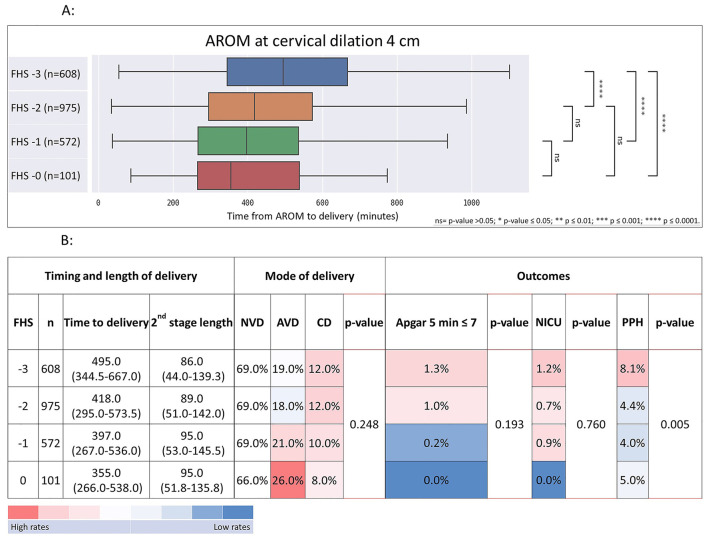 Figure 6
|
|
|
|
|---|---|---|
|
|
|
|
| Maternal age | 26 (22–29) | 31 (27–35) |
| Gestation week | 40 (39–40) | 40 (39–40) |
| Induction | 2,309 (19.3) | 5,005 (14.7) |
|
| ||
| Normal vaginal delivery | 8,549 (71.6) | 31,872 (93.9) |
| Assisted vaginal delivery | 2,269 (19.0) | 1,263 (3.7) |
| Unplanned cesarean delivery | 1,129 (9.5) | 816 (2.4) |
| Female neonatal | 5,784 (48.4) | 16,076 (47.4) |
| Neonatal birthweight (gram) | 3,235 (2,990–3,516) | 3,348 (3,078–3,623) |
| Neonatal head circumference* | 34.5 (33.5–35.1) | 34.5 (33.6–35.2) |
| Postpartum hemorrhage | 717 (6.0) | 1,440 (4.2) |
| Apgar at 5 min ≤ 7 | 92 (0.8) | 127 (0.4) |
| NICU | 84 (0.7) | 132 (0.4) |
| Duration from 3 cm dilation to delivery in minutes | 553 (396–753) | 341 (215–504) |
| Duration from AROM to delivery in minutes | 372 (216–583) | 163 (61–325) |
|
|
|
| ||||||||||||
|---|---|---|---|---|---|---|---|---|---|---|---|---|---|---|
|
|
|
|
|
|
|
|
|
|
|
|
|
|
| |
| 3 | −3 | 246 | 586.0 (376.0–816.3) | 87.0 (38.0–140.0) | 51% | 21% | 28% | <0.001 | 0.8% | <0.001 | 2.0% | 0.676 | 9.8% | 0.038 |
| −2 | 610 | 529.5 (374.3–736.0) | 100.0 (55.0–157.5) | 60% | 23% | 17% | 1.3% | 0.8% | 6.1% | |||||
| −1 | 340 | 487.0 (318.0–680.8) | 98.0 (48.8–152.0) | 65% | 21% | 14% | 1.2% | 1.2% | 5.0% | |||||
| 0 | 59 | 424.0 (291.0–605.5) | 84.0 (55.5–127.0) | 69% | 25% | 5% | 0.0% | 1.7% | 0.0% | |||||
| 4 | −3 | 608 | 495.0 (344.5–667.0) | 86.0 (44.0–139.3) | 69% | 19% | 12% | 0.248 | 1.3% | 0.193 | 1.2% | 0.760 | 8.1% | 0.005 |
| −2 | 975 | 418.0 (295.0–573.5) | 89.0 (51.0–142.0) | 69% | 18% | 12% | 1.0% | 0.7% | 4.4% | |||||
| −1 | 572 | 397.0 (267.0–536.0) | 95.0 (53.0–145.5) | 69% | 21% | 10% | 0.2% | 0.9% | 4.0% | |||||
| 0 | 101 | 355.0 (266.0–538.0) | 95.0 (51.8–135.8) | 66% | 26% | 8% | 0.0% | 0.0% | 5.0% | |||||
| 5 | −3 | 450 | 353.5 (253.0–485.0) | 88.0 (44.5–138.5) | 71% | 20% | 9% | 0.539 | 0.7% | 0.986 | 0.2% | 0.889 | 12.0% | <0.001 |
| −2 | 769 | 327.0 (224.0–458.0) | 85.0 (41.0–137.0) | 74% | 17% | 8% | 0.7% | 0.4% | 8.1% | |||||
| −1 | 577 | 323.0 (217.0–447.0) | 95.0 (50.0–148.0) | 73% | 19% | 8% | 0.9% | 0.2% | 4.2% | |||||
| 0 | 147 | 283.0 (207.5–396.5) | 90.0 (38.3–144.5) | 77% | 19% | 4% | 0.7% | 0.0% | 4.1% | |||||
| 6 | −3 | 182 | 293.0 (206.3–416.8) | 89.0 (52.5–141.0) | 68% | 21% | 10% | 0.038 | 1.1% | 0.946 | 0.0% | 0.002 | 12.1% | <0.001 |
| −2 | 434 | 294.0 (182.0–395.8) | 86.0 (43.3–138.0) | 76% | 19% | 5% | 0.9% | 0.0% | 9.4% | |||||
| −1 | 376 | 277.0 (181.8–377.0) | 102.0 (55.0–138.0) | 75% | 16% | 8% | 0.5% | 0.5% | 4.8% | |||||
| 0 | 149 | 230.0 (155.0–349.0) | 93.0 (52.3–130.8) | 68% | 27% | 5% | 0.7% | 2.7% | 1.3% | |||||
| 7 | −3 | 82 | 230.5 (141.3–359.3) | 75.5 (41.0–114.5) | 67% | 16% | 17% | 0.001 | 0.0% | 0.977 | 0.0% | 0.621 | 8.5% | 0.841 |
| −2 | 285 | 247.0 (157.0–351.0) | 98.0 (45.3–139.8) | 75% | 16% | 8% | 0.4% | 0.0% | 6.3% | |||||
| −1 | 314 | 227.5 (151.0–329.8) | 99.0 (44.0–144.0) | 69% | 23% | 8% | 0.6% | 0.6% | 6.1% | |||||
| 0 | 168 | 233.5 (172.8–311.3) | 91.5 (53.3–143.5) | 79% | 20% | 1% | 0.6% | 0.0% | 4.2% | |||||
| 8 | −3 | 59 | 215.0 (121.5–303.0) | 84.0 (28.0–168.0) | 73% | 17% | 10% | 0.268 | 0.0% | 0.957 | 0.0% | 0.735 | 8.5% | 0.276 |
| −2 | 223 | 172.0 (99.0–253.0) | 74.0 (34.0–119.0) | 78% | 20% | 3% | 0.9% | 0.9% | 9.4% | |||||
| −1 | 303 | 185.0 (121.0–268.5) | 88.0 (41.0–146.3) | 73% | 23% | 4% | 0.3% | 0.3% | 5.9% | |||||
| 0 | 286 | 180.5 (111.3–263.0) | 86.0 (47.0–150.0) | 77% | 17% | 6% | 0.7% | 0.0% | 3.8% | |||||
| 1 | 51 | 161.0 (88.0–221.0) | 82.0 (49.0–137.0) | 76% | 24% | 0% | 0.0% | 0.0% | 7.8% | |||||
| 9 | −3 | 61 | 202.0 (120.0–256.0) | 93.0 (37.5–136.8) | 77% | 16% | 7% | 0.053 | 3.3% | 0.144 | 1.6% | 0.735 | 8.2% | 0.096 |
| −2 | 165 | 161.0 (100.8–218.5) | 84.0 (47.0–141.5) | 75% | 19% | 5% | 0.0% | 0.0% | 9.1% | |||||
| −1 | 367 | 145.5 (86.0–233.0) | 77.5 (42.0–137.0) | 75% | 20% | 4% | 1.1% | 0.3% | 7.6% | |||||
| 0 | 518 | 133.0 (80.0–204.0) | 81.0 (42.0–128.5) | 82% | 16% | 2% | 0.4% | 0.4% | 4.6% | |||||
| 1 | 234 | 120.0 (78.0–191.0) | 80.0 (44.0–129.0) | 85% | 14% | 2% | 0.4% | 0.4% | 3.8% | |||||
| 2 | 29 | 96.0 (47.0–138.0) | 51.0 (24.8–89.0) | 90% | 10% | 0% | 0.0% | 0.0% | 0.0% | |||||
| 10 | −1 | 106 | 80.5 (43.5–141.3) | 80.5 (43.5–141.3) | 71% | 25% | 4% | <0.001 | 0.0% | 0.558 | 0.0% | 0.952 | 5.7% | 0.634 |
| 0 | 355 | 83.5 (46.3–140.8) | 83.5 (46.3–140.8) | 85% | 14% | 1% | 0.8% | 0.8% | 4.8% | |||||
| 1 | 423 | 71.0 (36.8–125.0) | 71.0 (36.8–125.0) | 85% | 14% | 1% | 0.0% | 0.9% | 4.5% | |||||
| 2 | 265 | 42.0 (21.0–84.0) | 42.0 (21.0–84.0) | 88% | 12% | 0% | 0.4% | 0.8% | 3.8% | |||||
| 3 | 41 | 20.0 (14.0–50.0) | 20.0 (14.0–50.0) | 93% | 7% | 0% | 0.0% | 0.0% | 0.0% | |||||
|
|
|
| ||||||||||||
|---|---|---|---|---|---|---|---|---|---|---|---|---|---|---|
|
|
|
|
|
|
|
|
|
|
|
|
|
|
| |
| 3 | −3 | 794 | 341.0 (205.0–536.0) | 10.0 (5.0–25.0) | 84% | 7% | 9% | 0.032 | 1.4% | 0.202 | 1.1% | 0.899 | 5.7% | 0.045 |
| −2 | 1181 | 304.0 (188.0–467.0) | 15.0 (7.0–35.0) | 89% | 5% | 6% | 0.4% | 1.0% | 3.0% | |||||
| −1 | 311 | 258.0 (153.0–413.0) | 19.0 (10.0–49.0) | 89% | 5% | 7% | 1.0% | 0.6% | 3.2% | |||||
| 0 | 49 | 293.0 (164.0–443.0) | 23.0 (11.5–66.0) | 84% | 12% | 4% | 0.0% | 0.0% | 2.0% | |||||
| 4 | −3 | 2344 | 252.0 (151.0–374.0) | 10.0 (5.0–19.0) | 92% | 4% | 4% | 0.002 | 0.8% | 0.182 | 0.7% | 0.870 | 5.7% | 0.069 |
| −2 | 2018 | 225.0 (135.0–350.0) | 11.0 (6.0–27.0) | 92% | 5% | 4% | 0.4% | 0.5% | 4.1% | |||||
| −1 | 671 | 191.0 (110.0–307.5) | 16.0 (10.0–37.0) | 92% | 6% | 2% | 0.1% | 0.4% | 3.9% | |||||
| 0 | 78 | 163.0 (90.0–249.8) | 22.0 (8.0–61.5) | 87% | 10% | 3% | 0.0% | 1.3% | 2.6% | |||||
| 5 | −3 | 2125 | 156.0 (88.0–251.0) | 10.0 (5.0–21.0) | 93% | 4% | 3% | 0.731 | 0.6% | 0.292 | 0.2% | 0.570 | 6.4% | <0.001 |
| −2 | 2186 | 147.0 (80.0–241.0) | 11.0 (6.0–25.0) | 94% | 4% | 2% | 0.5% | 0.0% | 4.2% | |||||
| −1 | 957 | 129.0 (74.0–220.0) | 15.0 (8.0–32.0) | 93% | 5% | 2% | 0.0% | 0.3% | 3.2% | |||||
| 0 | 167 | 109.0 (61.0–186.0) | 14.0 (7.0–35.0) | 93% | 5% | 2% | 0.0% | 0.0% | 0.6% | |||||
| 6 | −3 | 1149 | 99.0 (55.0–179.3) | 10.0 (5.0–20.0) | 94% | 4% | 2% | 0.398 | 0.1% | 0.796 | 0.0% | 0.155 | 6.8% | 0.003 |
| −2 | 1587 | 101.0 (53.0–178.8) | 11.0 (5.0–23.0) | 95% | 4% | 1% | 0.2% | 0.2% | 4.3% | |||||
| −1 | 862 | 91.0 (43.0–160.0) | 13.0 (6.0–28.3) | 96% | 3% | 1% | 0.0% | 0.1% | 3.4% | |||||
| 0 | 271 | 72.0 (36.0–137.5) | 13.0 (6.0–31.0) | 94% | 4% | 1% | 0.0% | 0.7% | 2.6% | |||||
| 7 | −3 | 661 | 79.0 (42.0–135.0) | 10.0 (5.0–20.0) | 93% | 4% | 3% | 0.223 | 0.2% | 0.929 | 0.3% | 0.022 | 5.0% | 0.221 |
| −2 | 1256 | 68.0 (35.5–128.0) | 10.0 (5.0–21.8) | 95% | 4% | 1% | 0.3% | 0.0% | 4.5% | |||||
| −1 | 884 | 63.0 (33.0–119.0) | 13.0 (7.0–28.0) | 95% | 3% | 1% | 0.3% | 0.6% | 3.3% | |||||
| 0 | 387 | 51.0 (25.0–95.0) | 12.0 (6.0–26.3) | 95% | 4% | 1% | 0.0% | 0.0% | 2.1% | |||||
| 1 | 46 | 34.0 (13.3–66.5) | 7.5 (6.0–10.0) | 96% | 4% | 0% | 0.0% | 2.2% | 2.2% | |||||
| 8 | −3 | 569 | 60.0 (31.0–107.0) | 10.0 (5.0–21.0) | 96% | 2% | 1% | 0.151 | 0.2% | 0.921 | 0.5% | 0.176 | 6.9% | 0.017 |
| −2 | 1159 | 46.0 (23.0–90.8) | 10.0 (5.0–20.0) | 96% | 3% | 1% | 0.3% | 0.1% | 3.7% | |||||
| −1 | 1118 | 40.0 (20.0–83.0) | 10.0 (6.0–21.0) | 95% | 4% | 1% | 0.1% | 0.1% | 3.6% | |||||
| 0 | 727 | 33.5 (17.0–67.0) | 11.0 (5.0–24.0) | 97% | 2% | 1% | 0.3% | 0.6% | 3.3% | |||||
| 1 | 125 | 27.0 (13.0–51.0) | 10.0 (5.5–15.8) | 99% | 1% | 0% | 0.0% | 0.8% | 4.0% | |||||
| 9 | −3 | 294 | 42.5 (20.0–82.8) | 10.0 (6.0–20.8) | 95% | 2% | 2% | 0.006 | 0.0% | 0.888 | 0.0% | 0.281 | 7.1% | 0.066 |
| −2 | 700 | 33.0 (18.0–64.0) | 11.0 (5.0–25.0) | 95% | 3% | 1% | 0.1% | 0.0% | 5.4% | |||||
| −1 | 1038 | 28.0 (15.0–55.0) | 10.0 (5.0–25.0) | 96% | 3% | 1% | 0.3% | 0.6% | 4.8% | |||||
| 0 | 1176 | 25.0 (13.0–49.0) | 11.0 (5.0–24.0) | 97% | 3% | 0% | 0.1% | 0.3% | 3.6% | |||||
| 1 | 348 | 18.0 (10.0–32.8) | 9.0 (5.0–19.0) | 98% | 1% | 1% | 0.3% | 0.0% | 2.9% | |||||
| 2 | 50 | 16.5 (10.0–27.3) | 7.0 (3.5–15.5) | 98% | 2% | 0% | 0.0% | 0.0% | 2.0% | |||||
| 10 | −3 | 128 | 17.0 (10.0–33.3) | 17.0 (10.0–33.3) | 96% | 4% | 0% | <0.001 | 0.8% | 0.179 | 0.0% | 0.021 | 5.5% | <0.001 |
| −2 | 222 | 14.0 (8.0–30.0) | 14.0 (8.0–30.0) | 97% | 3% | 0% | 0.9% | 0.9% | 7.7% | |||||
| −1 | 607 | 16.0 (9.0–32.0) | 16.0 (9.0–32.0) | 95% | 4% | 1% | 0.2% | 0.5% | 5.4% | |||||
| 0 | 1725 | 13.0 (7.0–24.0) | 13.0 (7.0–24.0) | 97% | 2% | 0% | 0.2% | 0.1% | 3.4% | |||||
| 1 | 1497 | 10.0 (5.0–18.0) | 10.0 (5.0–18.0) | 98% | 1% | 0% | 0.1% | 0.1% | 3.1% | |||||
| 2 | 798 | 7.0 (5.0–12.0) | 7.0 (5.0–12.0) | 99% | 1% | 0% | 0.5% | 0.9% | 2.1% | |||||
| 3 | 158 | 5.0 (2.0–10.0) | 5.0 (2.0–10.0) | 100% | 0% | 0% | 0.0% | 0.6% | 1.3% | |||||
Peer Reviews
No public reviews on file for this paper yet. If you reviewed it on a platform where reviews are public (OpenReview, ICLR, NeurIPS, ICML), you can paste yours below so the community can read it here.
Videos
No videos yet. Explain this paper in a talk, walkthrough, or lecture? Add one.
Taxonomy
TopicsMaternal and Perinatal Health Interventions · Abdominal Trauma and Injuries · Assisted Reproductive Technology and Twin Pregnancy
Introduction
Artificial rupture of membranes (AROM) is a common obstetric practice, usually performed to induce, augment, or otherwise expedite delivery, with the intent to shorten the duration of labor by increasing uterine activity and allowing the fetal head to apply direct pressure on the cervix.
Several studies have attempted to ascertain the optimal timing for AROM during induction of labor. A meta-analysis by De vivo et al. (1) combining 1,273 women from 4 different randomized controlled trials (RCTs), compared early vs. delayed AROM after cervical ripening and showed that early AROM was associated with a mean reduction of 5 h in the overall interval from initiation of induction to delivery. However, only one of the four RCTs (2) compared early AROM, defined as AROM before 4 cm of cervical dilation, to late AROM, defined as AROM after arriving at 4 cm of cervical dilation. In two other studies (3, 4), early AROM was compared to spontaneous rupture of membranes (SROM) and one study (5) defined late AROM after oxytocin was administered and either regular contractions or changes in cervical dilation were noted. The heterogenicity amongst these studies affects the generalizability these results.
In the past, labor augmentation of was routinely performed to shorten labor duration, following protocols pioneered by the work of O'Driscoll et al. (6), which showed lower rates of prolonged labor but were associated with complications such as increased rates of abnormal fetal heart tracings, neonatal asphyxia, and postpartum hemorrhage (7). Consequently, professional organizations such as the World Health Organization (WHO), the American College of Obstetricians and Gynecologists (ACOG) and the National Institutes for Health and Care Excellence (NICE) all issued guidelines restricting routine labor augmentation (8–10).
Early studies showed AROM to be associated with increased rates of non-reassuring fetal heart tracing and Cesarean deliveries (CD) (11, 12). More recent studies (2) demonstrated AROM to be a safe procedure with lower rates of labor dystocia and CD (13). Smyth et al. (14) in their Cochrane review did not find evidence supporting the hypothesis that AROM expedited spontaneous labor. A recent systematic review summarizing studies published between 2019 and 2024 reported that AROM shortens labor without increasing adverse outcomes (15). Similarly, a randomized trial demonstrated that amniotomy performed at 5 cm, consistent with the World Health Organization definition of the active phase of labor, shortened labor duration by ~50 min without increasing adverse maternal or neonatal outcomes (16).
The debate persists regarding both the efficacy of AROM and its optimal timing, particularly concerning early AROM and its potential benefits. Early AROM is typically defined as that performed before 4 cm of cervical dilation is reached. However, this arbitrary categorization of early vs. late AROM fails to take other routine labor assessment parameters into account, particularly fetal head station (FHS). Consideration of FHS in addition to cervical dilation might aid in optimizing AROM timing. Interestingly, although cervical effacement and FHS are part of the Bishop scoring system (17), which is used for decision making regarding the need for cervical ripening during induction of labor, these variables were overlooked in the studies addressing timing of AROM (18).
FHS has long been identified as an important predictor of labor outcomes and timing (19–21), as well as successful instrumental deliveries. However, most studies regarding FHS assessment focus on the second stage of labor.
The association between FHS and time to delivery has long been established (22, 23). Hamilton et al. (24) showed that a multifactorial model combining cervical dilation with FHS descent during the first stage of labor is more accurate in defining normal and abnormal labor progress. However, timing of AROM according to FHS has not been studied.
The aim of this study was to stratify, in a large cohort of births, the obstetrical outcomes for every cervical dilation/head station combination present at the time of AROM, in order to emphasize the importance of FHS position in the timing of AROM.
Materials and methods
Patients
This is an observational, retrospective electronic health records-based study performed on data retrieved from two campuses of a tertiary care center between 2003 and 2015. Data were gathered on parturients with singleton, term (≥ 37 weeks of gestation) live births.
Our institutional ethics review board reviewed and approved the study (0632-15-HMO). Given that all records were anonymized, the IRB exempted the need for informed consent for this retrospective study.
Data collection
We gathered obstetric background and outcome data, including maternal demographic parameters (i.e., maternal age, parity, gestational age, mode of delivery), and neonatal outcomes (birthweight, 5-min Apgar score, NICU admission). The core outcome sets included a computed variable for duration of labor from AROM to delivery, which was extracted from time stamps of AROM and delivery. Researchers extracting and analyzing data were not involved in patient care; the ward staff who recorded data in real time at the point of care were not aware of the study.
FHS was recorded from −3 to +3 in our medical center.
Since primiparas differ substantially in timing of labor and obstetrical outcomes, the cohort was divided by parity to primiparas and multiparas and the groups were analyzed separately.
The primary outcome was the duration of labor from AROM to delivery, comparing each cervical dilation/FHS combination recorded at the time of AROM. A sub-cohort of patients achieving vaginal delivery was identified to minimize the possible effects of first stage CDs on timing of delivery.
Secondary outcomes included rates of CDs, instrumental vaginal deliveries, and other obstetrical complications: postpartum hemorrhage (PPH, defined as estimated blood loss of more than 500 ml and 1,000 ml for vaginal and CD, respectively), neonatal intensive care unit (NICU) admission and 5-min Apgar score ≤ 7.
Statistical analysis
Statistical analysis was performed using Python 3.7.3 and IBM SPSS 29 for Windows (IBM Corp., Armonk, NY, USA). Dichotomous variables were compared with the chi-square test or Fisher exact test in cases of small numbers, as appropriate; the Mann–Whitney U test was applied to analyze differences in continuous variables. For comparing the sum ranks between the duration of labor from AROM for each station we performed Dunn's multiple comparisons test.
Results
This study cohort included 62,657 singleton, term vaginal delivery parturients; among whom 45,898 underwent AROM with documented timestamps at time of ROM and delivery. Of these, 11,947 (26.0%) were primiparas and 33,951 (74.0%) were multiparas. Table 1 summarizes the demographic and obstetric background parameters and main maternal and neonatal outcomes for parturients who underwent AROM.
As seen in Figures 1, 2, for each cervical dilation, an advanced FHS at time of AROM was associated with shorter time to delivery interval. This statistically significant association was seen from cervical dilation at time of AROM of 3 cm to 10 cm in multiparas (Figure 1). For primiparas (Figure 2), this association was statistically significant in cervical dilation of 3–6 cm and then 9–10 cm. These results were similar in a sub-cohort of women who achieved vaginal delivery, as seen in Figures 3, 4.
*Distribution of time from AROM to birth in minutes by dilation and stratified by fetal head station at time of AROM in multiparas. The figure displays the time in minutes from AROM to delivery, based on cervical dilation and fetal head station at the time of AROM. The x-axis represents the time in minutes, while the y-axis denotes the cervical dilation stages (3–10 cm) and the corresponding fetal head stations (−3 to +3). The box plot centralizes on the median time with the box representing the interquartile range (IQR), whereas the whiskers extend to the furthest data point within 1.5 times the IQR from the box. AROM, artificial rupture of membranes; FHS, fetal head station; ns = p > 0.05; *p ≤ 0.05; **p ≤ 0.01; ***p ≤ 0.001; ***p ≤ 0.0001.
*Distribution of time from AROM to birth in minutes by dilation and stratified by fetal head station at time of AROM in primiparas. The figure displays the time in minutes from AROM to delivery, based on cervical dilation and fetal head station at the time of AROM. The x-axis represents the time in minutes, while the y-axis denotes the cervical dilation stages (3–10 cm) and the corresponding fetal head stations (−3 to +3). The box plot centralizes on the median time with the box representing the interquartile range (IQR), whereas the whiskers extend to the furthest data point within 1.5 times the IQR from the box. AROM, artificial rupture of membranes; FHS, fetal head station; ns = p > 0.05; *p ≤ 0.05; **p ≤ 0.01; ***p ≤ 0.001; ***p ≤ 0.0001.
*Sensitivity analysis for cohort excluding CDs—distribution of time from AROM to birth in minutes by dilation and stratified by FHS at time of AROM in primiparas. The figure displays the time in minutes from AROM to delivery, based on cervical dilation and fetal head station at the time of AROM in primiparas, excluding patients who underwent unplanned CD. The x-axis represents the time in minutes, while the y-axis denotes the cervical dilation stages (3–10 cm) and the corresponding fetal head stations (−3 to +3). The box plot centralizes on the median time with the box representing the interquartile range (IQR), whereas the whiskers extend to the furthest data point within 1.5 times the IQR from the box. AROM, artificial rupture of membranes; FHS, fetal head station; ns = p > 0.05; *p ≤ 0.05; **p ≤ 0.01; ***p ≤ 0.001; ***p ≤ 0.0001.
*Sensitivity analysis for cohort excluding CDs—distribution of time from AROM to birth in minutes by dilation and stratified by FHS at time of AROM in multiparas. The figure displays the time in minutes from AROM to delivery, based on cervical dilation and fetal head station at the time of AROM in multiparas, excluding patients who underwent unplanned CD. The x-axis represents the time in minutes, while the y-axis denotes the cervical dilation stages (3–10 cm) and the corresponding fetal head stations (−3 to +3). The box plot centralizes on the median time with the box representing the interquartile range (IQR), whereas the whiskers extend to the furthest data point within 1.5 times the IQR from the box. AROM, artificial rupture of membranes; FHS, fetal head station; ns = p > 0.05; *p ≤ 0.05; **p ≤ 0.01; ***p ≤ 0.001; ***p ≤ 0.0001.
Secondary outcomes—CD rates, postpartum hemorrhage, 5-min Apgar score ≤ 7 and NICU admissions were also negatively associated with advancement in FHS at AROM.
Illustrating this association, we provide a breakdown of the duration from AROM at cervical dilation of 4 cm, delineated by subdivisions of FHS within this dilation and stratified by multiparas and primiparas, as shown in Figure 5 (multiparas) and Figure 6 (primiparas).
*Time from AROM at cervical dilation of 4 cm to birth, stratified by FHS at time of AROM with associated heat-map summarizing timing and length of delivery, mode of delivery, and maternal and neonatal outcomes in multiparas. The figure shows the time from AROM to birth and associated outcomes, based on a cervical dilation of 4 cm, stratified by FHS in multiparas. (A) median delivery times with associated ranges; (B) the frequencies and median durations of delivery, categorized by delivery mode and delivery outcomes. Data are displayed as n%, or median with interquartile range (IQR). p-values from the Chi-Square test highlight outcome comparisons by dilation and FHS. Data are presented as n, % or median (Inter-Quartile Range). P-values represent comparisons for each outcome according to the dilation and station at the time of AROM, analyzed using the Chi-Square test. AROM, artificial rupture of membranes; FHS, fetal head station; NVD, normal vaginal delivery; AVD, Assisted vaginal delivery; CD, cesarean delivery; NICU, neonatal Intensive care unit; PPH, postpartum hemorrhage. *p ≤ 0.05; ***p ≤ 0.001; ***p ≤ 0.0001.
*Time from AROM at cervical dilation of 4 cm to birth, stratified by FHS at time of AROM with associated heat-map summarizing timing and length of delivery, mode of delivery, and maternal and neonatal outcomes in primiparas. The figure shows the time from AROM to birth and associated outcomes, based on a cervical dilation of 4 cm, stratified by FHS in primiparas. (A) median delivery times with associated ranges; (B) the frequencies and median durations of delivery, categorized by delivery mode and delivery outcomes. Data are displayed as n%, or median with interquartile range (IQR). p-values from the Chi-Square test highlight outcome comparisons by dilation and FHS. Data are presented as n, % or median (Inter-Quartile Range). P-values represent comparisons for each outcome according to the dilation and station at the time of AROM, analyzed using the Chi-Square test. AROM, artificial rupture of membranes; FHS, fetal head station; NVD, normal vaginal delivery; AVD, Assisted vaginal delivery; CD, cesarean delivery; NICU, neonatal Intensive care unit; PPH, postpartum hemorrhage. ns = p > 0.05; ***p ≤ 0.0001.
For primiparas at 4 cm of dilation (Figure 6), the time from AROM to delivery decreased with FHS advancement, while CD rates showed a declining trend. Rates of low 5-min Apgar scores and NICU admissions decreased, while postpartum hemorrhage rates significantly decreased with advancing FHS. The median time from AROM to delivery was 495 min (interquartile range (IQR) 344–667) when FHS was at −3; 418 min (IQR 295–573) when FHS was at −2, 397 min (IQR 267–536) when FHS was at −1 and 355 min (IQR 266–538) when FHS was at 0. CD rates in this group declined gradually from 12% when FHS was at −3% to 8% when FHS was at 0 (p = 0.248). Rates of low ( ≤ 7) 5-min Apgar scores decreased in a dose response manner as well, from 1.3% for FHS −3% to 0.0% at FHS 0 (p = 0.193). NICU admission rates decreased from 1.2% at FHS −3 to 0.0% at FHS 0 (p = 0.760). PPH rates were 8.1% when FHS was −3 and decreased significantly to 4.2%, 4.1% and 5.0% for FHS of −2, −1 and 0, respectively (p = 0.005).
Table 2 depicts a full heat-map table for each cervical dilation in primiparas.
In multiparas at 4 cm dilation (Figure 5), the AROM to delivery interval decreased with advanced FHS, while CD rates declined significantly. Trends in other outcomes varied across FHS levels, with decreasing rates of low 5-min Apgar scores, NICU admissions, and postpartum hemorrhage observed. The median AROM to delivery interval at 4 cm dilation in multiparas was 252 min (IQR 151-374), 225 min (IQR 135–350), 191 min (IQR 110–307) and 163 min (IQR 90–250) for FHS of −3, −2, −1 and 0, respectively (Figure 5A). When evaluating the outcomes (Figure 5B), CD rates declined significantly from 4% to at FHS −3 to 2% for FHS −2 and −1, and then increased to 3% at FHS of 0 (p = 0.002). Low ( ≤ 7) 5-min Apgar score rates decreased gradually from 0.8% to 0% (p = 0.182), NICU admission rates decreased from 0.7% at FHS of −3 to 0.4% at FHS of −1 and the increased to 1.3% at FHS 0 (p = 0.087), and PPH rates decreased from 5.7% to 2.6% for FHS −3 vs. FHS 0 (p = 0.069).
Table 3 depicts a full heat-map table for each cervical dilation in multiparas.
Discussion
This large-scale study shows that duration of labor following AROM at each cervical dilation is influenced by FHS. As the FHS advances within each cervical dilation at time of AROM sub-cohort, the shorter the procedure to delivery duration. This association was stronger in multiparas in comparison to primiparas, perhaps due to the smaller sample size of this sub-cohort. Rates of CDs, low 5-min Apgar scores, NICU admissions, and PPH were also associated with FHS advancement during AROM, indicating that lower fetal head stations corresponded to lower rates of these outcomes, although this did not always reach statistical significance.
As shown previously (25), cervical dilation alone is insufficient in determining length of labor, and combining head station to cervical dilation gives a clearer picture to the progress of labor. The progress of FHS may be influenced by factors such as the fit of the maternal cervix and fetal head circumference, the latter of which has been positively correlated with prolonged second stage and unfavorable maternal and neonatal outcomes (26). Therefore, discussion regarding the optimal timing for AROM during labor induction should include FHS in combination with cervical dilation. It is possible that the one-dimensional approach toward AROM—only including cervical dilation—contributes to the inconsistency of results from the different clinical trials.
The main strength of our study is the large scale of the cohort. This allows for in-depth analysis of each cervical dilation group as well as different subgroups (primiparas vs. multiparas). The fact that results were uniform in most subgroups contributes to the robustness of this study. In the more advanced dilation groups (6–10 cm), numbers were insufficient to draw firm conclusions, however, clinical dilemma regarding AROM at that stage of labor is rare.
The retrospective nature of this study prevented us from ascertaining the optimal timing for AROM, as did the fact that other factors contributing to labor duration, such as administration of oxytocin, were not included in this study. Another potential limitation of this study is confounding by indication: in some cases, AROM may have been performed earlier at higher head stations due to concern for slower labor progress. This underlying factor, rather than AROM timing alone, could partly explain observed differences. While this cannot be excluded in a retrospective design, the consistency of associations across subgroups supports the robustness of our findings. Ultimately, prospective randomized trials will be needed to fully address this question.
Furthermore, this single center study might reflect local practice habits and therefore should be repeated in other delivery units and in different patient populations. As discussed above, clinical trials regarding early vs. late AROM using more complete cervical data are needed before firm recommendations can be made.
We included parturients whose labors culminated in second stage cesarean deliveries in the time-to-delivery analysis, which might affect the timing of delivery of these parturients. In order to examine a cohort of deliveries that were not truncated by CD, a sensitivity analysis excluding CDs was performed, with similar results to the full cohort (Figures 3, 4).
Data collection ended in 2015 because this was the last year for which complete and uniform information was available in our institutional database. While more recent years were not included, the physiological relationships between cervical dilation, fetal head station, and AROM timing are unlikely to be time-dependent, and the clinical implications of incorporating fetal head station into decision-making remain applicable.
These findings concur with previous studies showing the relation between FHS and duration of labor (22–24) as well as studies showing that FHS at the beginning of the second stage of labor is an important determinant of labor outcomes (19–21). However, limited focus has been given to the role of FHS at AROM and its relation to labor outcomes. In previous studies, in which machine learning models were developed to predict obstetrical outcomes, FHS was an important feature for predicting emergency CD (27), severe adverse neonatal outcomes (28), and more (29).
Although previous studies showed FHS estimation to be imprecise (30), the consistency of results throughout each cervical dilation as well as consistency of results amongst different subgroups suggest that perhaps FHS estimation is more accurate than previously thought. Furthermore, a previous study demonstrated that although some variation exists in FHS measurement amongst different medical centers, within the same institution it correlated strongly with labor outcomes (31).
We propose that future research should focus on creating a score combining all cervical features and determining optimal timing for AROM.
Conclusions
In conclusion, our study emphasizes the significant influence of FHS and cervical dilation on the duration of labor following AROM, particularly in multiparas. Consideration of FHS in AROM timing is crucial, especially for multiparous women, given its impact on various obstetrical outcomes. Further research is essential to fully elucidate the roles of cervical dilation and FHS on the effect of AROM on labor progression, highlighting the need for comprehensive assessments in future clinical trials.
The reference list from the paper itself. Each links out to its DOI / PubMed record.
- 1De Vivo V Carbone L Saccone G Magoga G De Vivo G Locci M. Early AROM after cervical ripening for induction of labor: a systematic review and meta-analysis of randomized controlled trials. Am J Obstet Gynecol. (2020) 222:320–9. 10.1016/j.ajog.2019.07.04931398311 · doi ↗ · pubmed ↗
- 2Macones GA Cahill A Stamilio DM Odibo AO. The efficacy of early AROM in nulliparous labor induction: a randomized controlled trial. Am J Obstet Gynecol. (2012) 207:403.e 1–5. 10.1016/j.ajog.2012.08.03222959833 · doi ↗ · pubmed ↗
- 3Bostanci E Eser A Yayla Abide C Kilicci C Kucukbas M. Early AROM after dinoprostone insert used for the induction of labor: a randomized clinical trial. J Matern Fetal Neonatal Med. (2018) 31:352–6. 10.1080/14767058.2017.128589328110590 · doi ↗ · pubmed ↗
- 4Makarem MH Zahran KM Abdellah MS Karen MA. Early AROM after vaginal misoprostol for induction of labor: a randomized clinical trial. Arch Gynecol Obstet. (2013) 288:261–5. 10.1007/s 00404-013-2747-623430026 · doi ↗ · pubmed ↗
- 5Levy R Ferber A Ben-Arie A Paz B Hazan Y Blickstein I. A randomised comparison of early versus late AROM following cervical ripening with a Foley catheter. BJOG. (2002) 109:168–72. 10.1111/j.1471-0528.2002.01137.x 11888099 · doi ↗ · pubmed ↗
- 6O'Driscoll K Jackson RJ Gallagher JT. Prevention of prolonged labour. Br Med J. (1969) 2:477–80. 10.1136/bmj.2.5655.4775771578 PMC 1983378 · doi ↗ · pubmed ↗
- 7Goffinet F Fraser W Marcoux S Breart G Moutquin JM Daris M. Early AROM increases the frequency of fetal heart rate abnormalities. AROM study group. Br J Obstet Gynaecol. (1997) 104:548–53. 10.1111/j.1471-0528.1997.tb 11530.x 9166195 · doi ↗ · pubmed ↗
- 8ACOG Committee Opinion No. 766 Summary. Approaches to limit intervention during labor and birth. Obstet Gynecol. (2019) 133:406–8. 10.1097/AOG.000000000000308130681540 · doi ↗ · pubmed ↗