Assessing impact on health, health care, and public support: The evolution of a CTSA hub’s evaluation and continuous improvement program
Lisa C. Welch, Denise Daudelin, Lisa Serrano, Siyu Chen, Alyssa Cabrera, Erin Gibson

TL;DR
This paper outlines a CTSA hub's approach to measuring broader impacts on health and public support beyond traditional academic outcomes.
Contribution
The paper introduces a new evaluation framework using key driver diagrams and standardized impact measures for CTSA hubs.
Findings
The approach shifts from logic models to key driver diagrams for impact measurement.
Early lessons highlight the need for flexible methods and strategic partner engagement.
Measurement challenges include long timeframes and limited validated tools.
Abstract
Clinical and Translational Science Award (CTSA) hubs are charged with supporting high-quality, community-engaged clinical research; improving the effectiveness and efficiency of research; and facilitating dissemination and implementation of findings into practice, leading to improved clinical outcomes and public health. Traditional academic outcomes, such as publications, subsequent grant funding, and innovative research methods, have often been cited as evidence of hubs’ impacts. This article describes one CTSA’s approach to extending beyond traditional research outcomes to operationalizing and measuring impacts on health, health care, and public support of research. The approach replaces logic models with key driver diagrams, shifts responsibility for performance indicators to individual programs, consolidates and standardizes impact measures across programs, and adapts existing…
Genes, proteins, chemicals, diseases, species, mutations and cell lines named across the full text — each resolved to its canonical identifier and authoritative record.
Click any figure to enlarge with its caption.
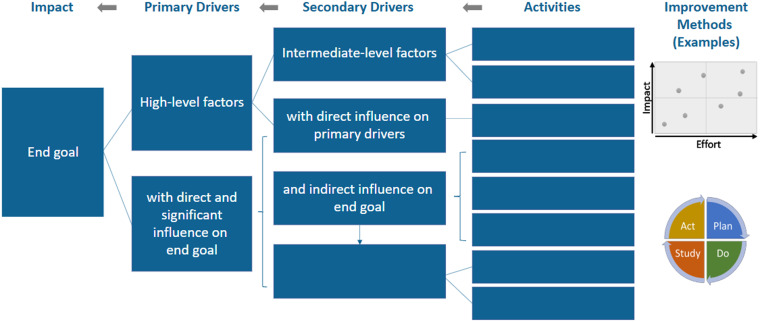 Figure 1
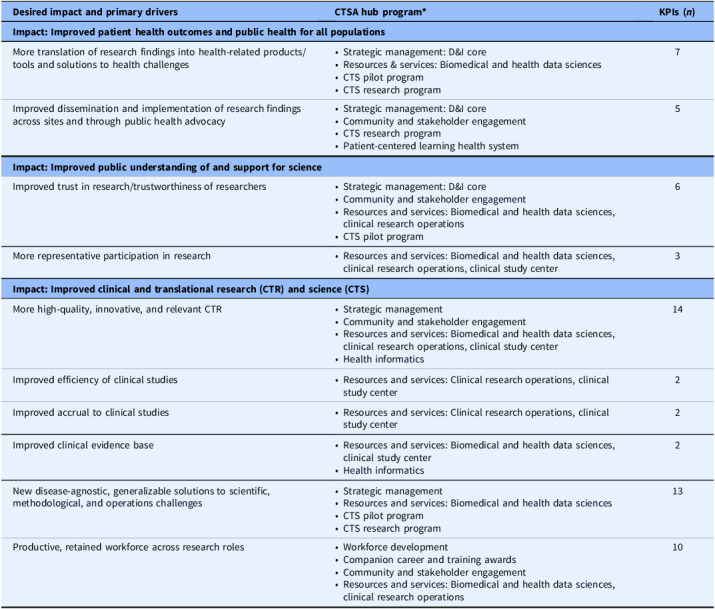 Figure 2
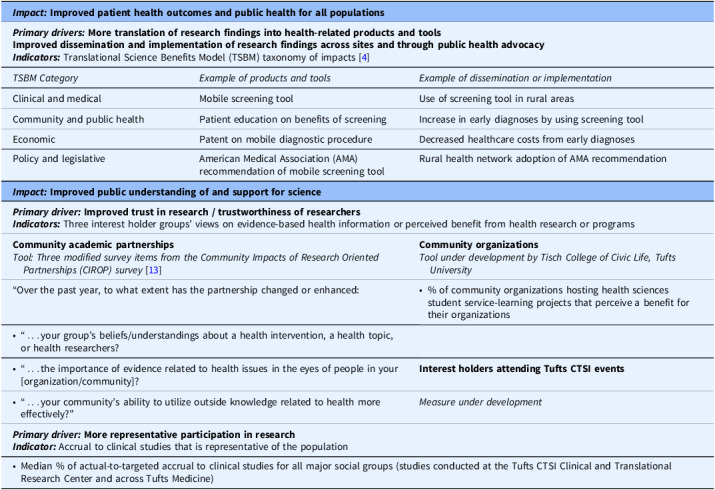 Figure 3
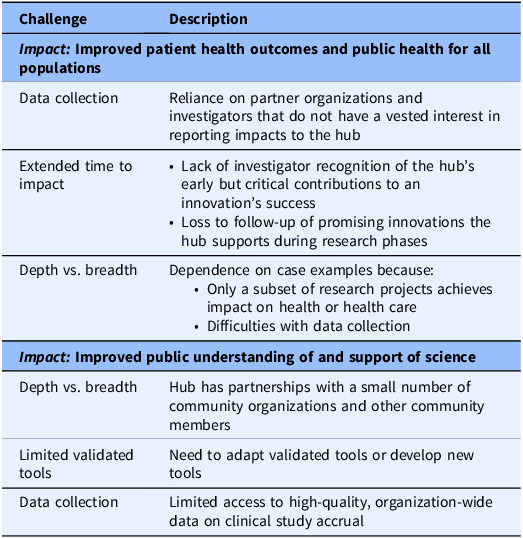 Figure 4
Peer Reviews
No public reviews on file for this paper yet. If you reviewed it on a platform where reviews are public (OpenReview, ICLR, NeurIPS, ICML), you can paste yours below so the community can read it here.
Videos
No videos yet. Explain this paper in a talk, walkthrough, or lecture? Add one.
Taxonomy
TopicsEvaluation and Performance Assessment · Health Policy Implementation Science · Public Health Policies and Education
Introduction
Improving health and health care is the undisputed goal of clinical and translational research (CTR); yet realizing that impact can take decades, if it occurs at all. Even when evidence-based innovations are disseminated and implemented, public skepticism of clinical research can limit real-world impact. Clinical and Translational Science Award (CTSA) organizations, or hubs, are charged with enhancing the impact of CTR by supporting high-quality, community-engaged studies; improving the effectiveness and efficiency of research; and facilitating dissemination and implementation of findings to improve clinical outcomes and public health.
Assessing whether CTSAs are achieving this mission is important for sustaining public support of funds invested but faces substantial challenges, including long periods of time from initial studies to implementation into health care and difficulty accessing relevant health-related data. At least partly due to these challenges, traditional academic outcomes (publications, subsequent grant funding, and innovative research methods) have often been cited as evidence of hubs’ impacts. However, in 2021 the National Center for Advancing Translational Sciences (NCATS) strengthened its directive that evaluations of CTSA hub performance move beyond traditional outcomes and also demonstrate impact on health [1].
In response, the Tufts Clinical and Translational Science Institute (CTSI) Evaluation and Continuous Improvement (ECI) Program is leading a multi-faceted approach to assessing the hub’s impacts on health, health care, and public support of research. The approach includes adopting a different tool for documenting the hub’s theory of change, specifying a measurement strategy, and facilitating an organizational change process to expand continuous improvement. Measuring impacts important to the public can more compellingly justify the societal investment in research infrastructure provided by CTSA hubs and drive efforts to grow those impacts through continuous improvement.
Methods and tools
Key driver diagram
To expand our focus and ability to measure impact, we have replaced evaluation logic models [2] with key driver diagrams [3] to display theories of change. Previously, the ECI team developed an overall logic model for use with hub leadership and a more specific model for each team. These models helped “connect the dots” between inputs (i.e., context and resources), outputs (i.e., services and activities), near-term outcomes (e.g., utilization of services), and medium-term outcomes (e.g., customer funding applications and awards, publications). While logic models end with long-term impacts (e.g., improved health, health care, and public support for science), in practice they were less effective at directing focus to those impacts.
Following a logic model’s visual orientation, discussions started at the leftmost point: context and resources (inputs) and services and activities (outputs). Teams focused on details about their activities and were relatively comfortable setting goals and metrics for near-term outcomes they believed their activities could achieve, such as utilization of services. It was less common for discussions to reach medium-term outcomes, and long-term impacts were rarely discussed in detail. As a result, impact measurement tended to focus on near-term and, for some teams, medium-term outcomes.
In contrast, key driver diagrams begin with end goals. The leftmost point of the diagram displays desired impacts. Moving to the right, the diagram specifies a small set of primary drivers of impacts and then secondary drivers that directly influence whether primary drivers are achieved. A standard diagram ends with programmatic activities that are believed to lead to the changes needed to achieve secondary drivers (Fig. 1). By beginning with the end goals, key driver diagrams display a prospective theory of the changes and measurable improvements needed to achieve those goals. Programmatic activities are reviewed in the context of whether they are likely to lead to drivers of impact and, if not, how to modify the activities.
Figure 1.Key driver diagram template.
To highlight the importance of selecting, testing, and refining activities through iterative improvement, we added symbols for a prioritization matrix and Plan-Do-Study-Act (PDSA) cycle. This emphasizes the diagram’s practical, action-oriented nature, and reinforces the value of continuous improvement in achieving desired outcomes.
Measures
A challenge in assessing the desired impacts of CTSA hubs is finding measures that are comprehensive yet feasible for data collection.
To assess impact of clinical and translational research on health and health care, the Translational Science Benefits Model (TSBM) [4] is a comprehensive resource. This online framework provides a taxonomy of 30 types of benefits in four domains, each with subcategories of benefits: a clinical and medical domain (subcategories: 1. procedures and guidelines and 2. tools and products); a community and public health domain (subcategories: 1. health activities and products, 2. health care characteristics, and 3. health promotion); an economic domain (subcategories: 1. commercial products and 2. financial savings and benefits); and a policy and legislative domain (subcategories: 1. advisory activities and 2. policies and legislation). For each benefit, the TSBM provides a definition, rationale, guidance on searching for information, selected potential data sources, data limitations, and publications and online case studies using the indicator.
The comprehensive nature of the TSBM taxonomy provides both an opportunity and a challenge. On one hand, it provides a resource to ensure a broad range of benefits to health and health care are considered and, if appropriate, pursued in CTR. On the other hand, the amount of information can be difficult to incorporate into data collection strategies, both in terms of clear messaging about what is being asked and the length of the instrument.
Recent applications of the TSBM have yielded adaptations. Emmons, Brownson, and Luke (an original TSBM author) propose adding implementation outcomes that support achievement of benefits [5], an adaptation applied to describe impacts of cancer-related research [6]. Huebschmann and colleagues propose integrating indicators of community participation to support representativeness of research impact [7]. In addition, Brimhall and colleagues extend the TSBM by adding continuous quality improvement (CQI) and team science approaches [8].
When assessing impact on public support for science, we leveraged measures of community engagement. The National Academy of Medicine Leadership Consortium’s initiative to support meaningful community engagement identified 28 assessment instruments that “were developed, implemented, and/or evaluated with communities and were psychometrically tested” [9]. Each instrument assesses one or more domains of the initiative’s conceptual model of meaningful community engagement, and two of those domains address impact on health and health care: Improved health and health care programs and policies and Thriving communities. Of the four instruments with items applicable to both domains, we selected the Community Impacts of Research Oriented Partnerships (CIROP) Measure [10].
Continuous improvement
Achieving impact on health, health care, and public support for CTR are challenging goals. To support the hub in driving toward those goals, we are expanding the capacity of teams to plan, conduct, and sustain improvement activities. This includes developing program-specific metrics for secondary drivers identified in key driver diagrams, creating operational guidelines to support metric data collection, and supporting teams in learning and using quality improvement (QI) tools and methods. We are adapting tools from the Institute for Healthcare Improvement’s QI Essentials Toolkit [11] and Tufts CTSI’s Research Process Improvement Toolkit [12], including cause-and-effect diagrams [13], process map flowcharts, failure modes and effects analysis (FMEA) charts, prioritization matrices, Plan-Do-Study-Act (PDSA) cycle worksheets, and data monitoring run charts (Supplementary Table 1). By adopting a CQI approach, teams can conduct iterative tests of change and subsequently modify their activities to achieve the secondary drivers.
Results
Specifying desired impacts and key drivers
Key driver diagrams proved to be a useful tool to facilitate agreement on desired impacts and their key drivers. The process began with the hub’s funded application to begin a new award cycle. The ECI team reorganized the central points in the application into the four categories of a key driver diagram: impacts, primary drivers, secondary drivers, and activities. We sought to draft one key driver diagram for each of the main sections of the application. The goal was to reveal how multiple teams were working toward a common set of primary drivers and impacts. Maintaining a small number of impacts and driver diagrams was important to cross internal silos of programmatic work and ensure a focus on the bigger picture.
To gain input from hub and program leaders, we conducted two or more rounds of discussions about each driver diagram. Teams whose activities were represented in each key driver diagram provided feedback and edits. Most changes resulting from discussions with programs were made to secondary drivers, which were more proximal to successful completion of programmatic activities. The exception was the Community and Stakeholder Engagement program, which modified the phrasing of primary drivers related to improving public support.
The result was seven key driver diagrams that, taken together, laid out a blueprint of the activities, expected changes, and milestones needed to achieve three high-level desired impacts for the current seven-year award period:
- Improved patient health outcomes and public health for all populations,
- Improved public understanding of and support for science,
- Improved CTR and clinical and translational science (CTS).
Ten cross-cutting primary drivers for achieving these impacts were identified, with multiple programs contributing to each one. These primary drivers specify measurable outcomes that will guide targeted goal setting and assessment of progress. A larger number of secondary drivers represent program-specific key performance indicators, or KPIs (Table 1). Some KPIs were similar across programs, while others were specific to one or two programs. For example, a subset of activities of the Community and Stakeholder Engagement program aimed to prepare community members and other non-researchers to engage in research. This overlapped with an objective of the Workforce Development program, but not with other programs.
Table 1.Desired impacts, primary drivers, contributing programs, and their key performance indicators (KPIs) Desired impact and primary drivers
CTSA hub program*
KPIs (n)
Impact: Improved patient health outcomes and public health for all populations More translation of research findings into health-related products/tools and solutions to health challenges
- Strategic management: D&I core
- Resources & services: Biomedical and health data sciences
- CTS pilot program
- CTS research program
7Improved dissemination and implementation of research findings across sites and through public health advocacy
- Strategic management: D&I core
- Community and stakeholder engagement
- CTS research program
- Patient-centered learning health system
5 Impact: Improved public understanding of and support for science Improved trust in research/trustworthiness of researchers
- Strategic management: D&I core
- Community and stakeholder engagement
- Resources and services: Biomedical and health data sciences, clinical research operations
- CTS pilot program
6More representative participation in research
- Resources and services: Biomedical and health data sciences, clinical research operations, clinical study center
3 Impact: Improved clinical and translational research (CTR) and science (CTS) More high-quality, innovative, and relevant CTR
- Strategic management
- Community and stakeholder engagement
- Resources and services: Biomedical and health data sciences, clinical research operations, clinical study center
- Health informatics
14Improved efficiency of clinical studies
- Resources and services: Clinical research operations, clinical study center
2Improved accrual to clinical studies
- Resources and services: Clinical research operations, clinical study center
2Improved clinical evidence base
- Resources and services: Biomedical and health data sciences, clinical study center
- Health informatics
2New disease-agnostic, generalizable solutions to scientific, methodological, and operations challenges
- Strategic management
- Resources and services: Biomedical and health data sciences
- CTS pilot program
- CTS research program
13Productive, retained workforce across research roles
- Workforce development
- Companion career and training awards
- Community and stakeholder engagement
- Resources and services: Biomedical and health data sciences, clinical research operations
10D&I: Dissemination and Implementation. CTS: Clinical and translational science, defined as developing and implementing innovations to improve the translation of clinical research into improved health and health care [1]. *CTSA hub programs reflect the required modules described in the Clinical and Translational Science Award Funding Opportunity Announcement posted July 30, 2021 [1] and the addition of a Patient-centered Learning Health System to which Tufts CTSI contributes.
Measurement strategy
Among the three desired impacts, two reflect direct effects on patients and communities: 1) Improved patient health outcomes and public health for all populations and 2) Improved public understanding of and support for science. Measuring these requires expanding beyond the more traditional strategy of assessing academic research outcomes. To expand our measurement strategy, we are leveraging the primary drivers identified during the development of key driver diagrams.
Measuring impact on health and health care
This process identified two primary drivers for improving patient health outcomes and public health for all populations. The first driver is more successful translation of research findings into health- and healthcare-related products and tools. This includes the translation of CTR into disease-specific products and tools as well as disease-agnostic solutions to health or healthcare challenges (e.g., feasible approaches to provide more personalized treatments, improved tools to support clinical decision making, etc.). The second primary driver is improved dissemination and implementation of research findings across sites and through public health advocacy. This includes more implementation of the health-related products and tools noted above and more effective public health advocacy stemming from evidence-based positions.
To measure these primary drivers, we are using the TSBM to ensure our data collection includes the full range of clinical and medical, community and public health, economic, and policy and legislative benefits. Approaching investigators and partner organizations to ask for information about a large number of benefits (30) presents challenges with feasibility of use. To address this, we adapted the TSBM by reorganizing benefits into two buckets aligned with the identified primary drivers: 1) tools and products, and 2) implementation activities. For example, a “biomedical technology” for diagnosing disease in mobile clinics (clinical and medical), “health education resources” about the new technology (community and public health), a “patent” on the technology (economic), and a “scientific research report” from a nationally recognized health organization that recommends using the technology (policy and legislative) all are categorized as tools and products. “Diagnostic procedures” using the new technology (clinical and medical), “health care accessibility” leading to early diagnoses (community and public health) and “cost effectiveness” of diagnostic care (economic), and a rural health system “policy” adoption of the tool (policy and legislative) are categorized as implementation activities (Table 2).
Table 2.Primary driver measures ** Impact: Improved patient health outcomes and public health for all populations**
** Primary drivers: More translation of research findings into health-related products and tools Improved dissemination and implementation of research findings across sites and through public health advocacy Indicators: ** Translational Science Benefits Model (TSBM) taxonomy of impacts [4] TSBM Category
Example of products and tools
Example of dissemination or implementation Clinical and medicalMobile screening toolUse of screening tool in rural areasCommunity and public healthPatient education on benefits of screeningIncrease in early diagnoses by using screening toolEconomicPatent on mobile diagnostic procedureDecreased healthcare costs from early diagnosesPolicy and legislativeAmerican Medical Association (AMA) recommendation of mobile screening toolRural health network adoption of AMA recommendation ** Impact: Improved public understanding of and support for science**
** Primary driver: Improved trust in research / trustworthiness of researchers Indicators: ** Three interest holder groups’ views on evidence-based health information or perceived benefit from health research or programs Community academic partnerships
Tool: Three modified survey items from the Community Impacts of Research Oriented Partnerships (CIROP) survey [13] Community organizations
Tool under development by Tisch College of Civic Life, Tufts University “Over the past year, to what extent has the partnership changed or enhanced:
-
% of community organizations hosting health sciences student service-learning projects that perceive a benefit for their organizations
-
“…your group’s beliefs/understandings about a health intervention, a health topic, or health researchers?
-
“…the importance of evidence related to health issues in the eyes of people in your [organization/community]?
Interest holders attending Tufts CTSI events
- “…your community’s ability to utilize outside knowledge related to health more effectively?”
Measure under development
** Primary driver: More representative participation in research Indicator: ** Accrual to clinical studies that is representative of the population
- Median % of actual-to-targeted accrual to clinical studies for all major social groups (studies conducted at the Tufts CTSI Clinical and Translational Research Center and across Tufts Medicine)
Creating broader buckets of TSBM benefits (tools and products, implementation activities), with the ability to access more specific information online, simplifies the messaging for data collection and shortens instruments; yet, additional challenges remain (Table 3). First, we continue to rely on the response of investigators and partner organizations that do not have a vested interest in demonstrating the hub’s impact. This is particularly difficult given the second challenge--the extended timeframe for a research project to achieve impact on health or health care.
Table 3.Challenges in measuring impact Challenge
Description
** Impact: Improved patient health outcomes and public health for all populations** Data collectionReliance on partner organizations and investigators that do not have a vested interest in reporting impacts to the hubExtended time to impact
- Lack of investigator recognition of the hub’s early but critical contributions to an innovation’s success
- Loss to follow-up of promising innovations the hub supports during research phases
Depth vs. breadthDependence on case examples because:
- Only a subset of research projects achieves impact on health or health care
- Difficulties with data collection
** Impact: Improved public understanding of and support of science** Depth vs. breadthHub has partnerships with a small number of community organizations and other community membersLimited validated toolsNeed to adapt validated tools or develop new toolsData collectionLimited access to high-quality, organization-wide data on clinical study accrual
This extended timeframe means that investigators and partners may not attribute subsequent impacts of their projects to the support received from the hub, and we often lose contact with investigators who take positions outside our partner network. For these reasons, and the fact that only a subset of research studies achieve impact on health or health care, our approach is to develop case examples [14]. This emphasizes depth over breadth of impact, which may not be as convincing to some audiences.
Measuring impact on public support
Improving public understanding of and support for science also has two primary drivers. One is improved trust in research among patients and community members. The lack of trust in clinical research has been noted among specific groups (e.g., African Americans [16]) and more broadly (e.g., skepticism about vaccines despite solid evidence of safety and efficacy [17]). To increase public support, experts in community engagement note that the research establishment must demonstrate to patients and community members that science can be trusted [18,19].
To measure change in trust, we are collecting information from three groups with connections to the hub: community partners involved in hub activities, community organizations that host health science service learners, and nonscientists attending hub events. The CIROP Measure asks about the extent that a partnership has affected an organization or group, and we are adapting the language of selected items to specify research-related topics. We identified three items that, after modification, indicate aspects of trust in research. Specifically, these items ask about the extent to which the partnership enhanced or changed: “beliefs / understandings with respect to a [health-related] intervention or approach, a [health-related] topic, or a group of people [conducting health research];” “…the importance of evidence [about health] in the eyes of people in your organization or group;” and “…ability to utilize outside knowledge [related to health] more effectively” [15].
In addition to community-academic research partnerships, the hub also seeks to foster public trust by supporting a service-learning program for health science students, with the goal of providing a benefit to community organizations focusing on health. Tufts University’s Tisch College of Civic Life is developing and validating a measure to assess whether these organizations perceive such a benefit. Lastly, the hub hosts events open to interest holders other than scientists. We are considering the extent that one-time events could move the needle on building trust, with the goal of developing and validating a measure appropriate for this setting.
Our approach to assessing impact on public trust in research faces two main challenges (Table 3). Similar to the challenge of assessing impact on health and health care, the data we collect will not be broad-based. The hub has two traditional community-academic partnerships and two panels of non-scientist interest holders that contribute to our operations (e.g., review pilot study applications, consult with investigators, etc.). While these partnerships are central to our mission, the reach is limited. Second, existing measurement tools were not created for our purpose. Identifying appropriate measures requires adaptations that have not been validated or investment of resources and time to develop new measures.
The second primary driver of improved public understanding of and support for science is the inclusion of a more representative group of participants in research. Being a part of a clinical study makes the process more concrete and transparent for patients and volunteers, increasing their understanding of it. In addition, receiving benefits from treatments or information due to participating in a clinical study can improve perspectives about the value of clinical research. Increasing the representativeness of participants will broaden these changes in knowledge and perspectives across all populations.
To measure the representativeness of participation, we are adopting a standard measure: the median proportion of actual-to-targeted accrual to clinical studies. Subgroup analyses will assess participation by social groups for the hub’s CTR Center as well as across the Tufts Medicine health system. The health system uses a clinical trial management system that has the capability to collect the data needed for this measure. However, acquiring these data is hampered by uneven data quality and a lack of precedent for the hub to access the health system’s data (Table 3).
Supporting continuous improvement
Consistent assessment and prioritized improvement are needed across all programs to drive impact on health, health care, and public support. The continuous improvement and evaluation roles within the hub have been interconnected for many years, but the reach has been limited by the capacity of the ECI team to lead programs in this area. Especially given the added challenges of measuring impact on health, health care, and public support, expanding improvement efforts requires programs to take primary responsibility for program-specific KPIs.
In response, we are shifting responsibility for KPIs, which are labeled as secondary drivers in key driver diagrams, from ECI to each program team. This process entailed an initial investment of high-touch support by the ECI team. We provided each programmatic team with an overview that includes the metrics it is responsible for and the data collection tool needed for each metric. Together with teams, we identified the specific staff member responsible for each metric’s data collection and computation. To support staff members in producing metric results, we created an operational guideline for each KPI that specifies the metric’s description, rationale, timeframe and frequency, computation instructions, inclusion/exclusion criteria, stratification variables, data sources, and data collection methods (Supplementary Figure 1).
In addition, ECI began building capacity among staff members to conduct improvement cycles related to KPIs. Two early-adopter teams that already were using metric-based continuous improvement methods presented their processes to other teams as examples. The initial QI tools introduced include cause-and-effect diagrams, failure mode and effects analysis, and a structured improvement process incorporating Plan-Do-Study-Act cycles. These tools were used with early-adopter teams to identify root causes of low participant enrollment and to uncover administrative process failures impacting cost recovery for services provided.
Subsequently, the ECI team introduced data monitoring run charts and a more comprehensive framework for documenting improvement activities, providing examples of successful improvement. ECI will continue to support teams with regular check-ins and guidance, as needed. In addition, the hub’s Executive Director champions this process by setting an expectation of using KPI metrics and improvement cycles and by reviewing progress with each program quarterly. The hub’s full senior leadership team joins these discussions annually.
Discussion
This article describes the strategy of a CTSA hub to rise to the challenge of measuring its impact on health, health care, and public support for research. The process is multi-faceted. Replacing traditional evaluation logic models with key driver diagrams helped to identify, consolidate, and align desired impacts and their primary drivers across the hub’s many programs. The measurement strategy entails adapting existing measures and developing new ones. To strengthen the hub’s ability to drive toward impact, responsibility for program-specific KPIs fully shifts to the programmatic teams by building their capacity for conducting metric-based improvement cycles.
Early lessons learned
Implementation to date has revealed barriers. The measurement strategy is complicated by extended time from supporting a study to its impact, data collection challenges (including lack of access to organization-wide data and reliance on investigators and partners to provide information), limited validated tools, and the limits to documenting breadth of impact.
Early lessons learned point to practical facilitators for measuring impact. Embracing methods and measures that are feasible (e.g., case studies) and often imperfect (e.g., adaptations of validated survey items), although not ideal, is needed to move forward. In addition, engaging partner organizations in mutually beneficial approaches to data collection can facilitate access. For example, developing a case study of the implementation of an evidence-based clinical practice or program at a partner’s site can be used by the partner organization as well as the hub.
Transitioning more responsibility for key performance metrics and improvement cycles to programs can be perceived as adding work to teams without adding resources, creating a barrier. Two aspects of our approach facilitate motivation for these additional tasks. First, discussing key driver diagrams with teams helps to keep a clear line of sight from their day-to-day activities to the impacts they want to have. Second, engaging a hub leader to champion this change adds near-term value and accountability for taking on metric data collection and systematic improvement activities.
Conclusion
This approach to assessing a CTSA hub’s impact on health, health care, and public support has required an upfront investment of the Evaluation and Continuous Improvement team, an expanded capacity and willingness of programmatic teams to take more responsibility for assessing and improving their own performance, a commitment from hub leaders to champion and support these changes, and adaptations of existing methods and measures. The promise of the approach is to strengthen the hub by more clearly demonstrating the value of its work to the public, its funders, and the community members, faculty, and staff who move it forward. The barriers and facilitators identified in early implementation can inform efforts of other organizations, including CTSA hubs, seeking to demonstrate meaningful downstream impact.
Supporting information
10.1017/cts.2025.10127.sm001Welch et al. supplementary materialWelch et al. supplementary material
The reference list from the paper itself. Each links out to its DOI / PubMed record.
- 1National Center for Advancing Translational Sciences (NCATS), National Institutes of Health (NIH). PAR-21-293: Clinical and Translational Science Award (UM 1 Clinical Trial Optional), (https://grants.nih.gov/grants/guide/pa-files/PAR-21-293.html) Accessed March 27, 2025.2025.
- 2Frechtling JA. Logic Modeling Methods in Program Evaluation. Hoboken, NJ: Jossey-Bass, 2007.
- 3Bennett B , Provost L. Whats your theory?: Driver diagram serves as tool for building and testing theories for improvement, (http://www.apiweb.org/QP_whats-your-theory_201507.pdf). Accessed March 25, 2025.
- 4Institute of Clinical and Translational Sciences, Washington University. Translational science benefits model© 2017-2023. (https://translationalsciencebenefits.wustl.edu/). Accessed March 27, 2025.
- 5Emmons KM , Brownson RC , Luke DA. Extending the translational science benefits model to implementation science for cancer prevention and control. J Clin Transl Sci. 2024;8(1):e 211. doi: 10.1017/cts.2024.582.39790467 PMC 11713433 · doi ↗ · pubmed ↗
- 6Schnoll R , Bekelman JE , Blumenthal D , et al. Using the translational science benefits model to assess the impact of the Penn implementation science center in cancer control. J Clin Transl Sci. 2024;8(1):e 166. doi: 10.1017/cts.2024.554.39619072 PMC 11604509 · doi ↗ · pubmed ↗
- 7Huebschmann AG , Brega AG , Stotz SA , et al. Gaps and opportunities for measuring equity with the Translational Science Benefits Model: Recommendations from the Center for American Indian and Alaska Native Diabetes Translation Research. Journal of Clinical and Translational Science. 2024;8:e 206, 1–13. doi: 10.1017/cts.2024.638.PMC 1162660839655025 · doi ↗ · pubmed ↗
- 8Brimhall KC , Kuhfeldt K , Kotton DN , et al. Building on the translational science benefits model to include team science: A practical and theory-based approach to continuous quality improvement and impact evaluation for clinical and translational science award programs. Front Public Health. 2025;13:1581205. doi: 10.3389/fpubh.2025.1581205.40458088 PMC 12127396 · doi ↗ · pubmed ↗