Depressive symptoms and hypoglycaemic risk in individuals with type 2 diabetes mellitus: insights from the ACCORD-HRQL study
Wanying Hong, Yang Yang, Zhenhua Xing

TL;DR
This study explores how depressive symptoms in people with type 2 diabetes affect hypoglycaemic events, finding no direct link but highlighting poor glucose control in those with depression.
Contribution
The study provides new insights into the dynamic relationship between depressive symptoms and glycaemic control in type 2 diabetes.
Findings
Depressive symptoms were linked to less effective glycaemic control in individuals with type 2 diabetes.
No significant association was found between depression severity and increased hypoglycaemic events.
Dynamic fluctuations in depressive symptoms were observed over the study period.
Abstract
Depression in individuals with type 2 diabetes mellitus (T2DM) is associated with worse clinical prognosis; however, evidence regarding the relationship between depression and hypoglycaemic risk remains limited and inconclusive. Our study aimed to evaluate the association between depressive symptoms and hypoglycaemic events. Depressive symptoms were assessed in participants of the ACCORD-HRQL study at baseline and during follow-up visits at 12, 36 and 48 months using the nine-item Patient Health Questionnaire (PHQ-9). Symptom severity was categorised into three levels: none (0–4 points), mild (5–9 points) or moderate to severe (10–24 points). The primary outcomes included hypoglycaemia requiring any assistance (HAA) and hypoglycaemia requiring medical assistance (HMA). Over a median follow-up of 4.3 years, 220 individuals developed HAA (incidence rate: 27.0 per 1000 person-years) and…
Genes, proteins, chemicals, diseases, species, mutations and cell lines named across the full text — each resolved to its canonical identifier and authoritative record.
Click any figure to enlarge with its caption.
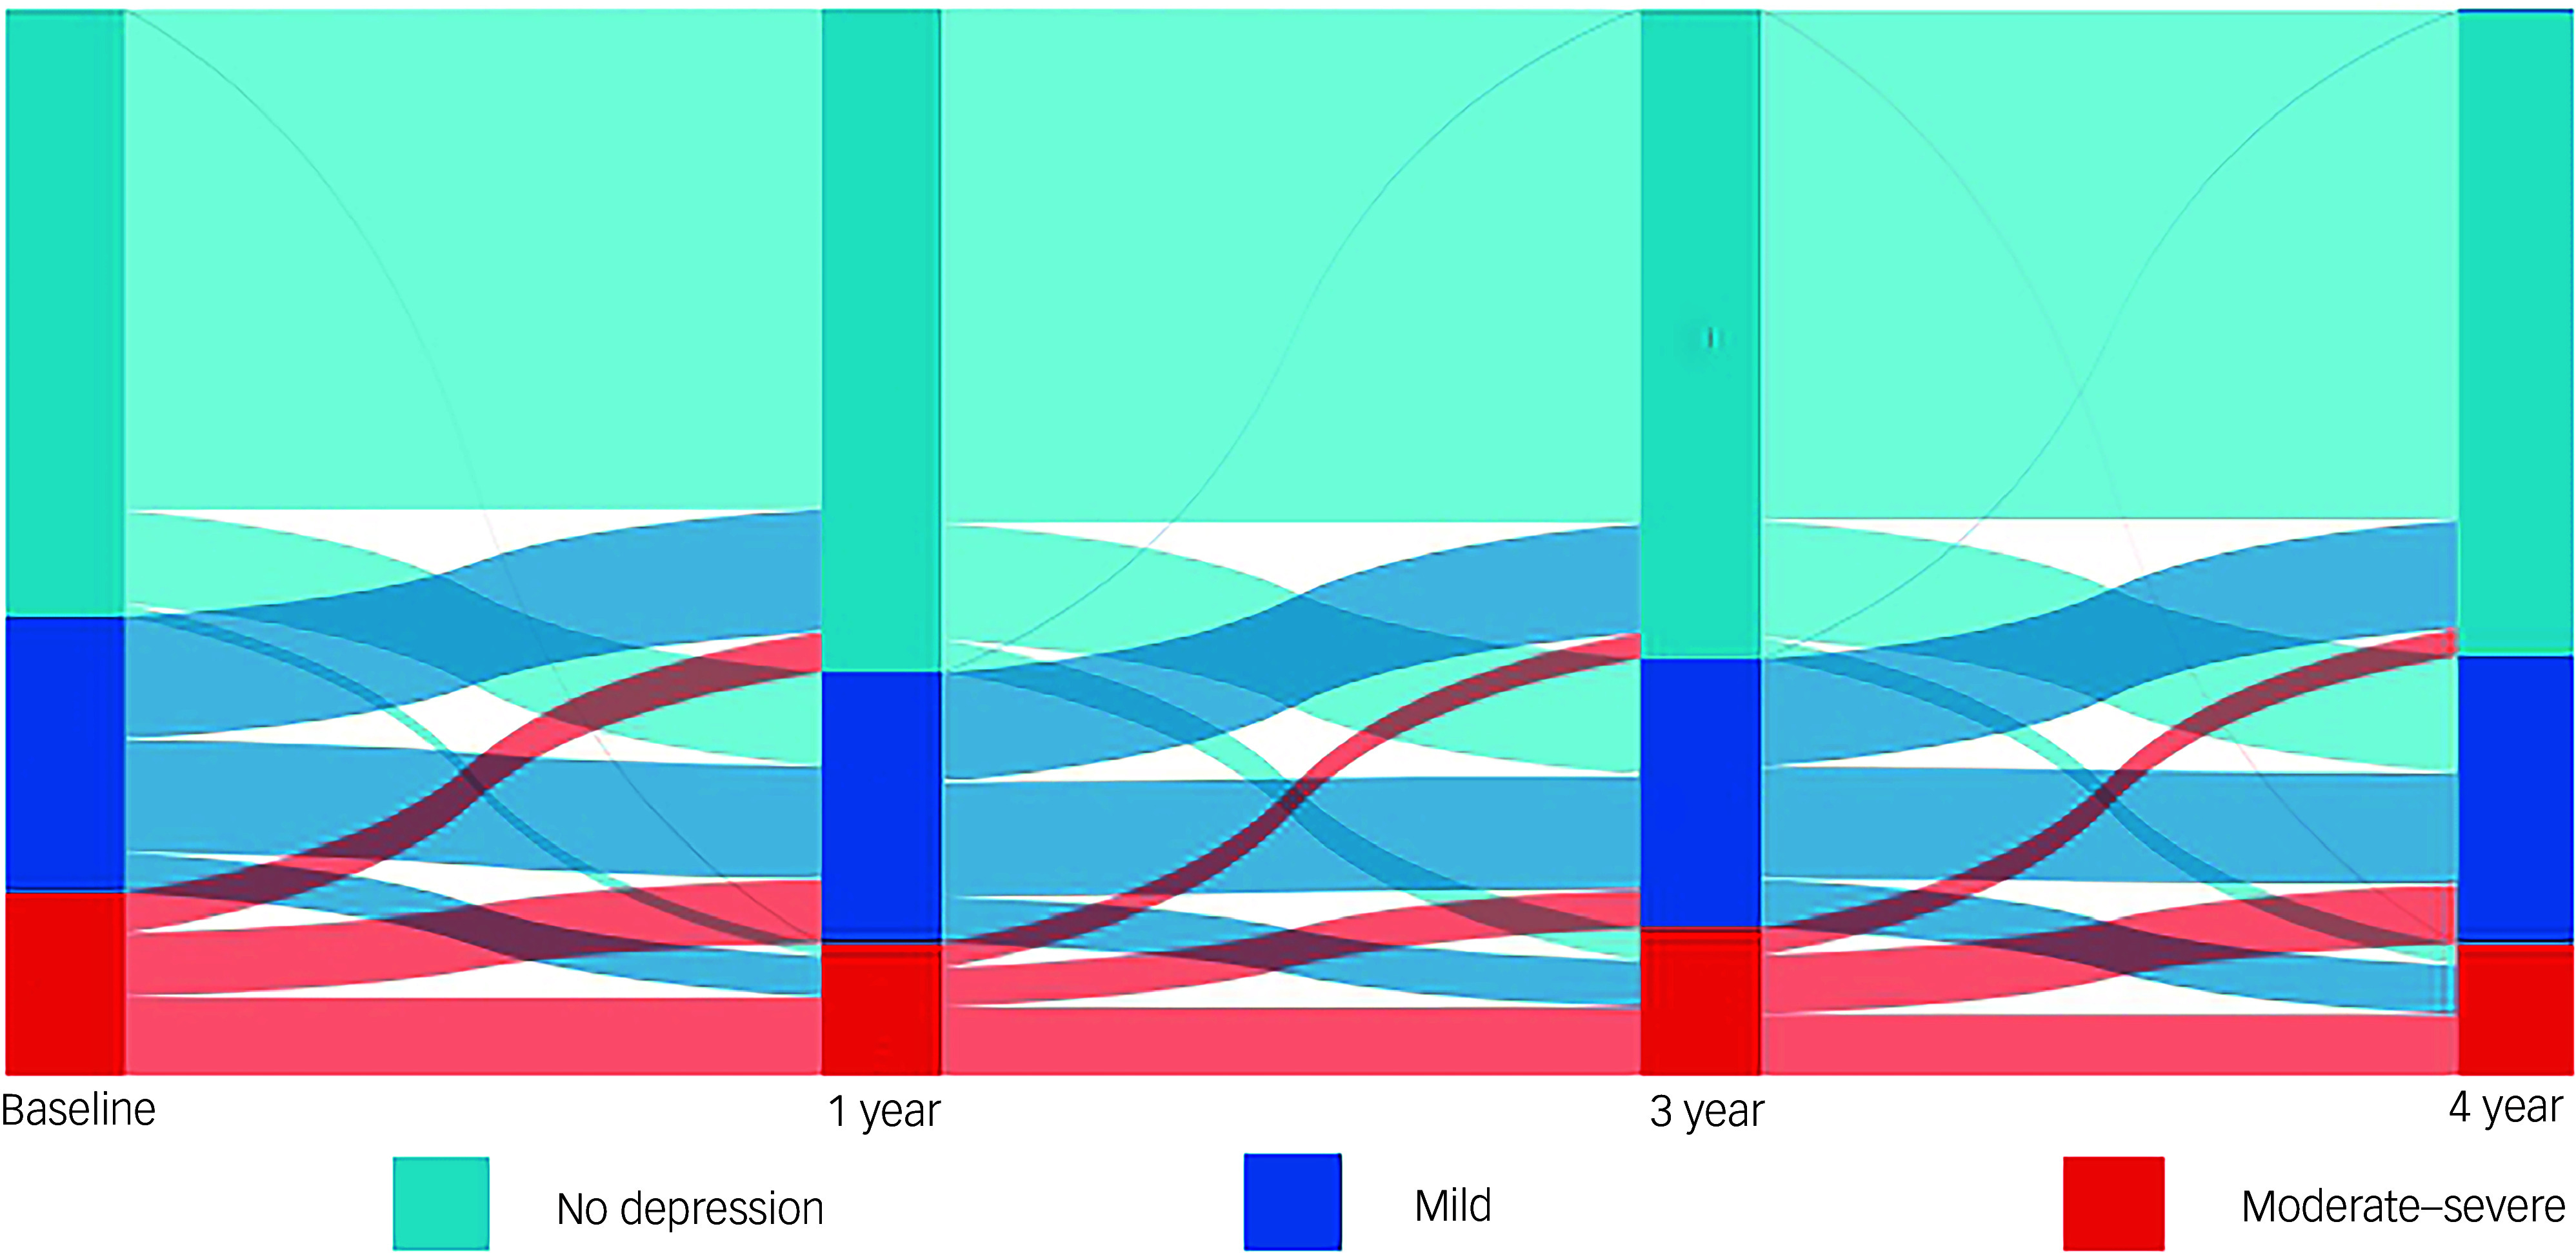 Figure 1
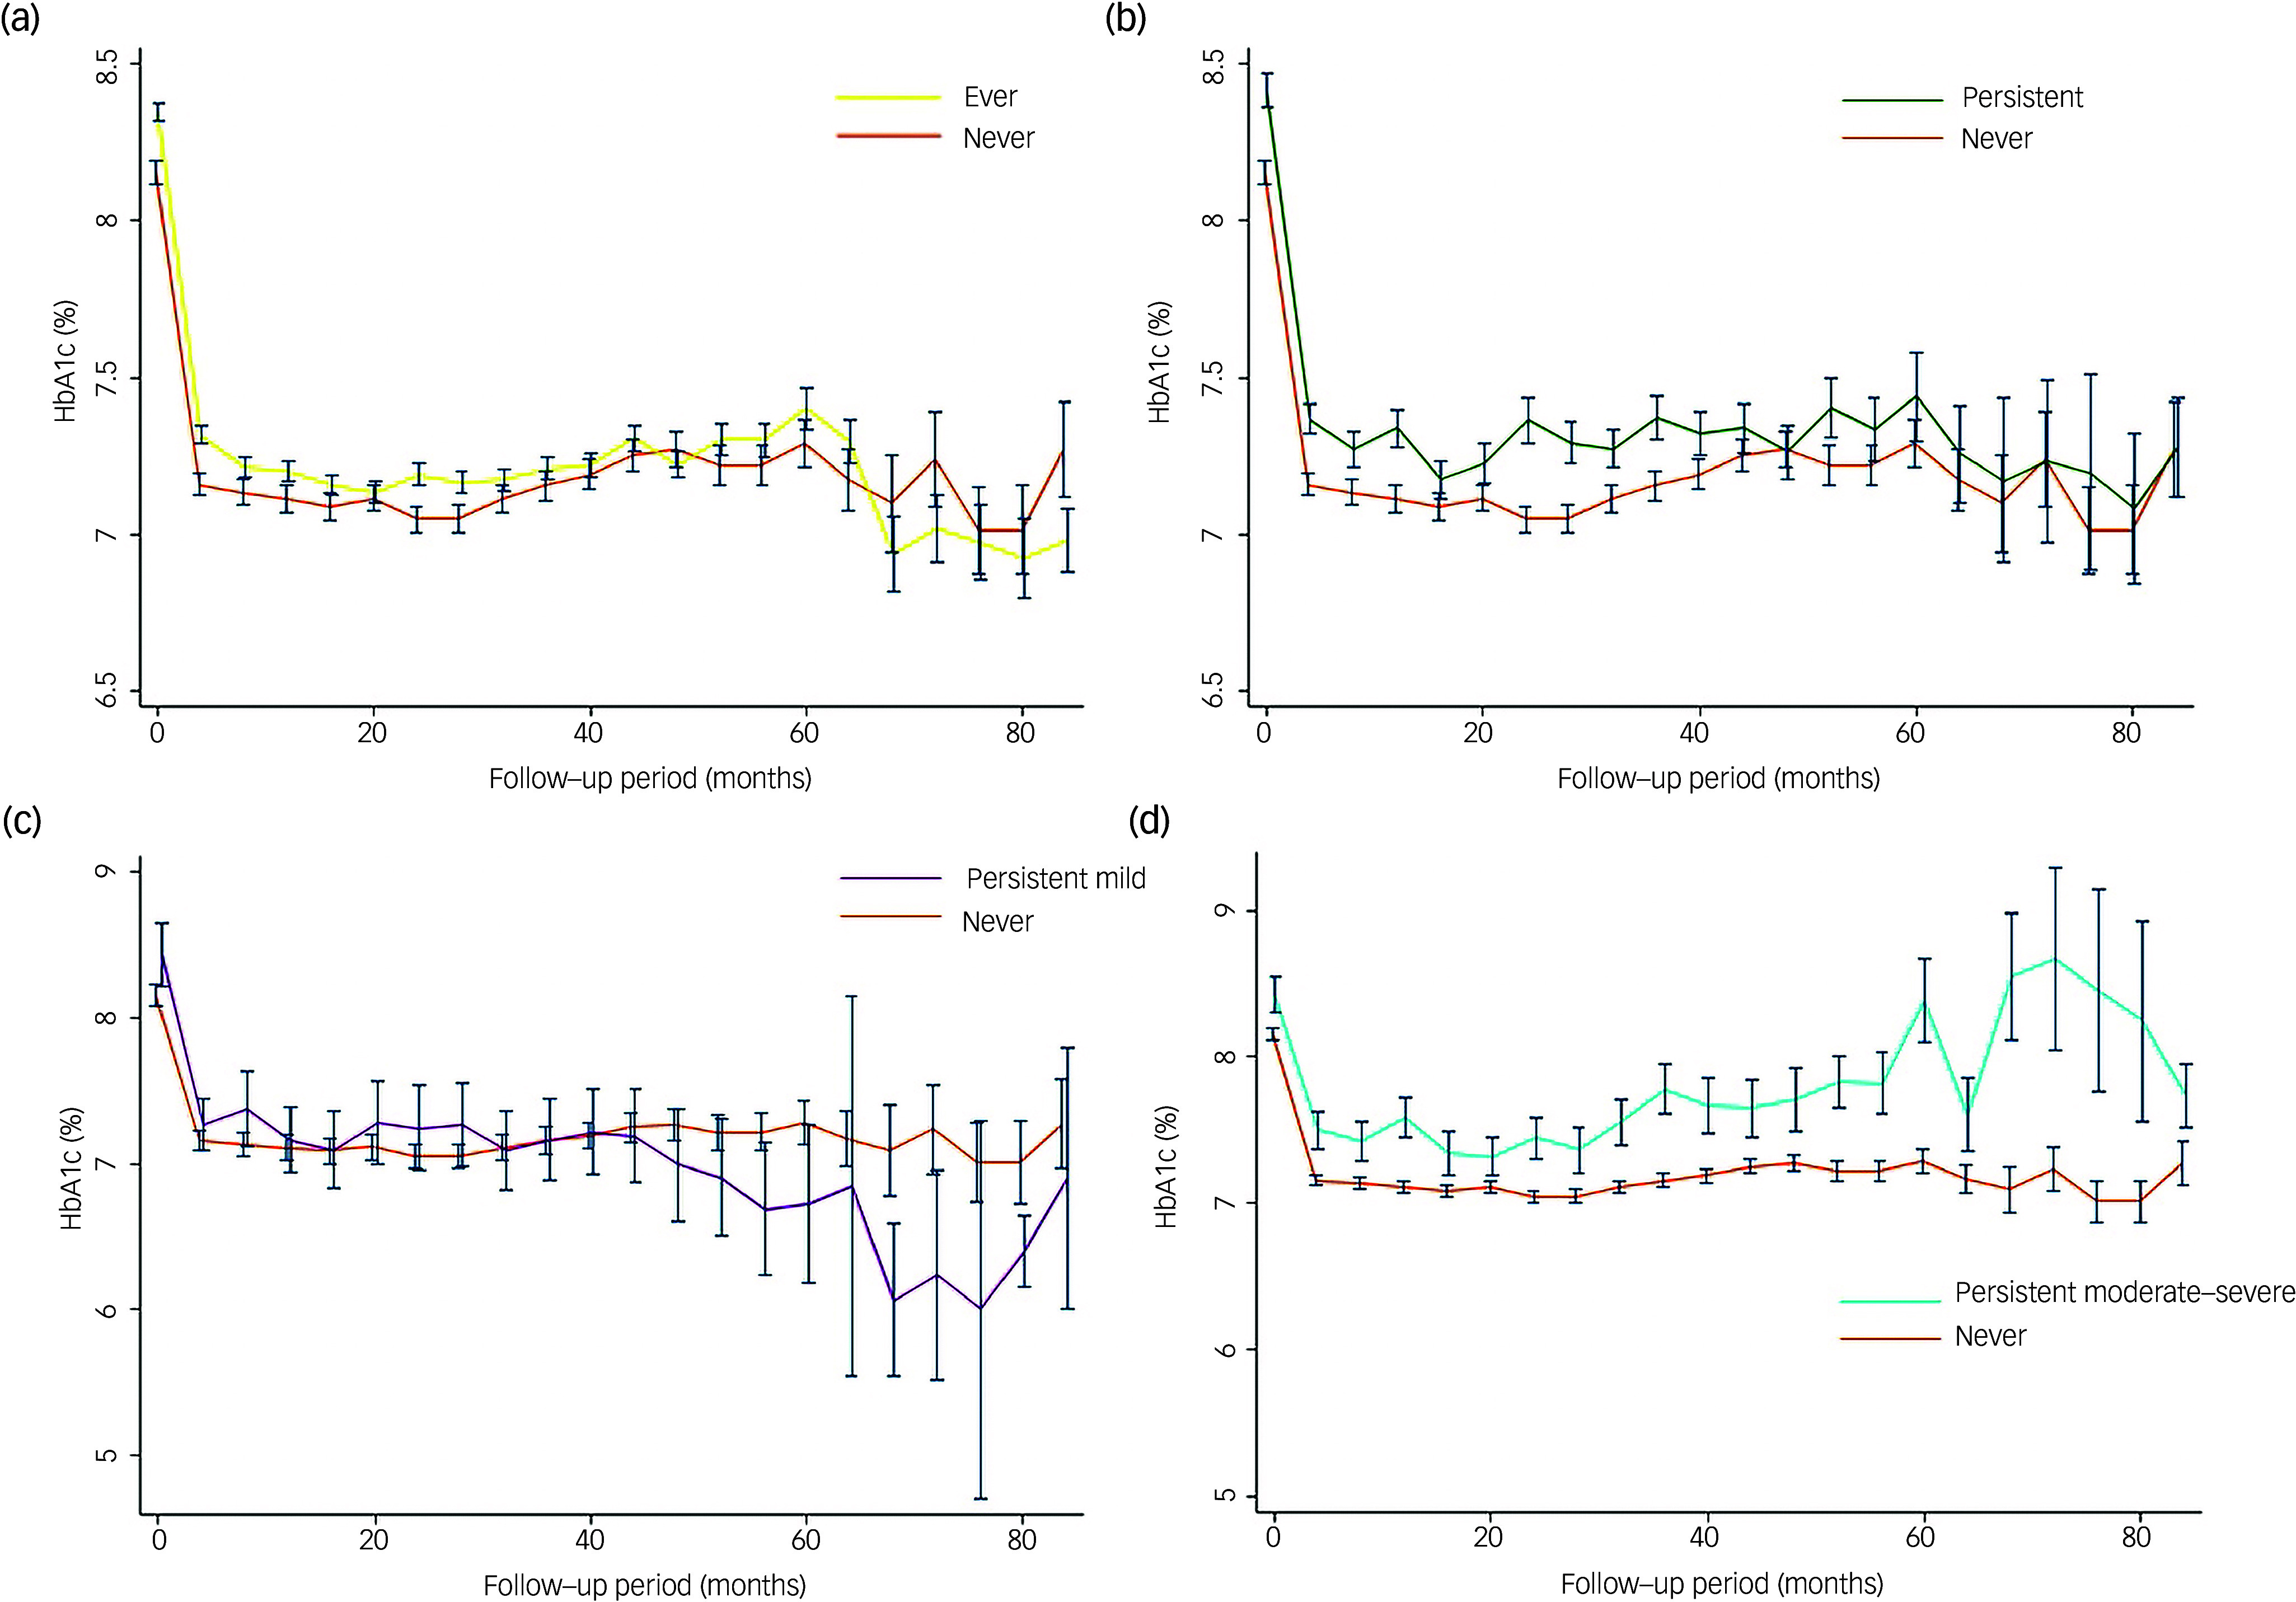 Figure 2
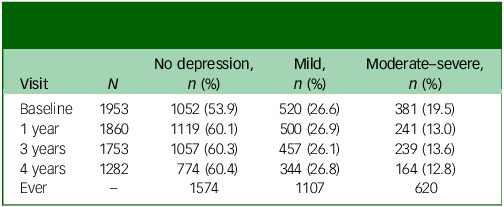 Figure 3
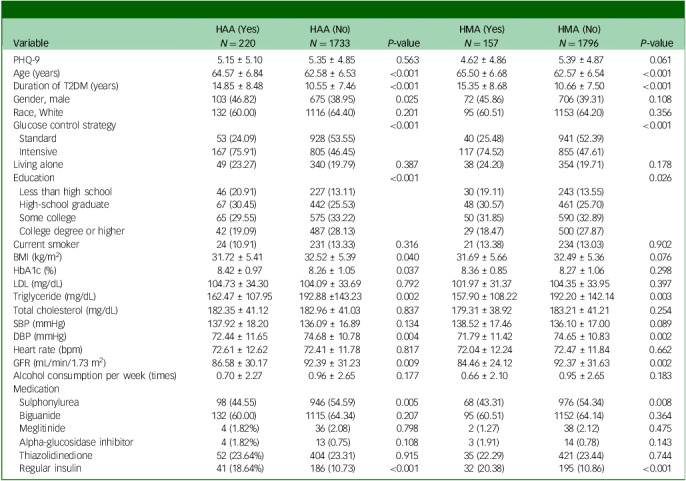 Figure 4
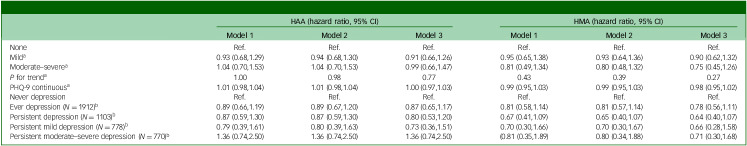 Figure 5
Peer Reviews
No public reviews on file for this paper yet. If you reviewed it on a platform where reviews are public (OpenReview, ICLR, NeurIPS, ICML), you can paste yours below so the community can read it here.
Videos
No videos yet. Explain this paper in a talk, walkthrough, or lecture? Add one.
Taxonomy
TopicsDiabetes Management and Education · Diabetes Management and Research · Diabetes Treatment and Management
Individuals with type 2 diabetes mellitus (T2DM) face an elevated risk of depression compared to those without T2DM, with approximately one in every four T2DM individuals experiencing clinically significant depression.^ 1,2 ^ This comorbidity is concerning as depression has been linked to adverse outcomes, including an increased risk of cardiovascular diseases, heart failure and other health complications, ultimately diminishing the overall quality of life.^ 3 ^
A recent study highlighted the independent association between depression and impaired awareness of hypoglycaemia in type 1 diabetes.^ 4 ^ The reduction of hypoglycaemic symptoms and thus impaired counter-regulatory responses increased the risk of developing severe hypoglycaemia.^ 5 ^ Moreover, individuals with depression exhibit suboptimal concordance to treatment and dietary recommendations, leading to suboptimal glycaemic control and potentially placing them at a higher risk of hypoglycaemia.^ 6–8 ^ While hypoglycaemia has been observed commonly in individuals with diabetes, its prevalence and association with additional severe symptoms of depression underscore the need to explore whether individuals with depression are at a higher risk of hypoglycaemia compared to their counterparts without depression.
Furthermore, the dynamic nature of depressive symptoms in clinical practice adds another layer of complexity.^ 3 ^ Persistent and transient depression may exert distinct effects on the incidence of hypoglycaemia. Therefore, it is crucial for studies investigating the relationship between depression and hypoglycaemia to consider these variations. In light of these considerations, our investigation aims to explore the nuanced relationship between depression and the risk of hypoglycaemia among individuals with T2DM.
Method
The ACCORD study, with 10 251 individuals (mean age 62 years and mean glycated haemoglobin (HbA1c) 8.3%), aimed to evaluate whether intensified management of blood glucose, blood pressure and lipid levels could enhance cardiovascular outcomes in individuals with T2DM. This study, with a median T2DM onset of ten years, had been detailed and published previously.^ 9–15 ^ However, because of the increased risk of cardiac death associated with intensive glycaemic control, the intervention was halted after an average follow-up of 3.7 years.^ 10 ^ Subsequently, all participants transitioned to standard glycaemic control, and the follow-up was continued. The ACCORD trial was funded by the National Heart, Lung, and Blood Institute (NHLBI), and its procedures were endorsed by both the NHLBI and local ethics committees, with all participants providing written consent after being fully informed about the trial. The data-sets generated and/or analysed during the current study are available in the BioLINCC repository (https://biolincc.nhlbi.nih.gov). There are no current plans to involve individuals in the dissemination of study findings.
The ACCORD Health-Related Quality of Life (HRQL) study, a subset of the ACCORD study, was specifically designed to prospectively evaluate the comprehensive impact of all ACCORD interventions on validated measures of depression and HRQL from the participant’s perspective. Within the ACCORD HRQL sub-study, depressive symptoms were systematically assessed using the nine-item Patient Health Questionnaire (PHQ-9), aligning with the DSM-IV^ 11 ^ criteria. Evaluations occurred at baseline and at 12, 36 and 48 months during clinical visits within the ACCORD study. The PHQ-9 comprised nine questions, each scored on a scale of 0–3 based on symptom severity. The severity of depressive symptoms was categorised as none (0–4 points), mild (5–9 points) or moderate–severe (10–24 points).^ 3,16 ^
The baseline characteristics of included participants, encompassing age, gender, race (White/Black and minority ethnic), duration of T2DM, living arrangements, education status, tobacco and alcohol consumption and medication usage, were collected through questionnaires, interviews and examination of medical records during recruitment. Smoking status was classified as never, former or current, while alcohol consumption was self-reported and quantified in terms of frequency per week. Key physiological parameters, including body mass index (BMI), systolic blood pressure (SBP), diastolic blood pressure (DBP) and heart rate, were measured by registered nurses at the assessment centre. Lipid profiles (total cholesterol, triglycerides, low-density lipoprotein cholesterol (LDL)), HbA1c and glomerular filtration rate (GFR) were assessed by the central laboratory, as detailed previously.^ 10,12,17 ^ The outcomes were hypoglycaemia requiring medical assistance (HMA) and hypoglycaemia requiring any assistance (HAA). During each visit, participants were queried about their encounters with ‘low blood sugar’. Severe hypoglycaemia was characterised by participants exhibiting a blood glucose level of <2.8 mmol/L or experiencing hypoglycaemic symptoms that promptly resolved with oral carbohydrates, intravenous glucose or parenteral glucagon. HMA was specifically defined as episodes necessitating admission to hospital or care by emergency response personnel.^ 18 ^ HAA was defined as hypoglycaemic episodes requiring assistance from a third party (e.g. family members or bystanders) without involvement of healthcare professionals. In this study, the analysis focused on the duration from randomisation until the occurrence of the first episode of HAA and/or HMA, in relation to the primary outcomes mentioned earlier.
Continuous variables were evaluated using analysis of variance or Mann–Whitney U-tests, while chi-square analysis based on distribution was employed for categorical variables. The association between depression and HMA or HAA was investigated through Cox proportional hazards regression. Depression was measured as a time-varying indicator at baseline, year 1 and year 3, both as categorical (none, mild or moderate–severe) and continuous (continuous PHQ-9 score) variables. Three analytical models were utilised: Model 1, which adjusted for age, race, gender, glucose control strategy, living arrangements, education status, duration of diabetes and cigarette and alcohol consumption; Model 2, which further adjusted for BMI, HbA1c and GFR, along with the variables in Model 1; Model 3, which additionally adjusted for hypoglycaemic drugs, including sulphonylurea, biguanide, meglitinide, alpha-glucosidase inhibitor, thiazolidinedione and regular insulin. We conducted further comparisons of hazard ratios between individuals who had ever had depression, persistent depression, persistent mild depression or persistent moderate–severe depression and those without a history of depression. Individuals without depression were utilised as the reference group. In addition, we compared the HbA1c levels to assess and visualise the effectiveness of blood glucose control among these groups. Subgroup and interaction analyses were performed based on age (≤60 years, >60 years), gender and blood control strategy (intensive or standard glucose control). All statistical analyses were two-sided, and significance was determined at P < 0.05. The analyses were carried out using Stata/MP software, version 17.0 for Windows (StataCorp LLC, College Station, TX, USA).
Results
Out of the 10 251 individuals involved in the ACCORD study, 2053 were included in the HRQL sub-study. Some 1963 participants had baseline PHQ-9 data, 1871 had PHQ-9 data at 1 year, 1755 at 3 years and 1285 at 4 years (Table 1). Over a median follow-up period of 4.3 years (interquartile range: 3.8–5.2 years), 220 individuals (27.0 events per 1000 person-years) developed HAA, while 157 individuals (18.8 events per 1000 person-years) developed HMA. The baseline characteristics of the study participants are presented in Table 2. Participants with HAA or HMA tended to be older, had lower levels of education, higher BMI, a longer history of T2DM, were more likely to receive an intensive glucose control strategy and were more likely to receive sulphonylurea and insulin treatments.
Table 1. Participants meeting depression criteria at assessment points throughout the ACCORD trialVisit N No depression, n (%)Mild, n (%)Moderate–severe, n (%)Baseline19531052 (53.9)520 (26.6)381 (19.5)1 year18601119 (60.1)500 (26.9)241 (13.0)3 years17531057 (60.3)457 (26.1)239 (13.6)4 years1282774 (60.4)344 (26.8)164 (12.8)Ever–15741107620
Table 2. Baseline characteristics of participants based on hypoglycaemia statusHAA (Yes)HAA (No) P-valueHMA (Yes)HMA (No) P-valueVariable N = 220 N = 1733 N = 157 N = 1796PHQ-95.15 ± 5.105.35 ± 4.850.5634.62 ± 4.865.39 ± 4.870.061Age (years)64.57 ± 6.8462.58 ± 6.53<0.00165.50 ± 6.6862.57 ± 6.54<0.001Duration of T2DM (years)14.85 ± 8.4810.55 ± 7.46<0.00115.35 ± 8.6810.66 ± 7.50<0.001Gender, male103 (46.82)675 (38.95)0.02572 (45.86)706 (39.31)0.108Race, White132 (60.00)1116 (64.40)0.20195 (60.51)1153 (64.20)0.356Glucose control strategy<0.001<0.001 Standard53 (24.09)928 (53.55)40 (25.48)941 (52.39) Intensive167 (75.91)805 (46.45)117 (74.52)855 (47.61)Living alone49 (23.27)340 (19.79)0.38738 (24.20)354 (19.71)0.178Education<0.0010.026 Less than high school46 (20.91)227 (13.11)30 (19.11)243 (13.55) High-school graduate67 (30.45)442 (25.53)48 (30.57)461 (25.70) Some college65 (29.55)575 (33.22)50 (31.85)590 (32.89) College degree or higher42 (19.09)487 (28.13)29 (18.47)500 (27.87)Current smoker24 (10.91)231 (13.33)0.31621 (13.38)234 (13.03)0.902BMI (kg/m^2^)31.72 ± 5.4132.52 ± 5.390.04031.69 ± 5.6632.49 ± 5.360.076HbA1c (%)8.42 ± 0.978.26 ± 1.050.0378.36 ± 0.858.27 ± 1.060.298LDL (mg/dL)104.73 ± 34.30104.09 ± 33.690.792101.97 ± 31.37104.35 ± 33.950.397Triglyceride (mg/dL)162.47 ± 107.95192.88 ±143.230.002157.90 ± 108.22192.20 ± 142.140.003Total cholesterol (mg/dL)182.35 ± 41.12182.96 ± 41.030.837179.31 ± 38.92183.21 ± 41.210.254SBP (mmHg)137.92 ± 18.20136.09 ± 16.890.134138.52 ± 17.46136.10 ± 17.000.089DBP (mmHg)72.44 ± 11.6574.68 ± 10.780.00471.79 ± 11.4274.65 ± 10.830.002Heart rate (bpm)72.61 ± 12.6272.41 ± 11.780.81772.04 ± 12.2472.47 ± 11.840.662GFR (mL/min/1.73 m^2^)86.58 ± 30.1792.39 ± 31.230.00984.46 ± 24.1292.37 ± 31.630.002Alcohol consumption per week (times)0.70 ± 2.270.96 ± 2.650.1770.66 ± 2.100.95 ± 2.650.183Medication Sulphonylurea98 (44.55)946 (54.59)0.00568 (43.31)976 (54.34)0.008 Biguanide132 (60.00)1115 (64.34)0.20795 (60.51)1152 (64.14)0.364 Meglitinide4 (1.82%)36 (2.08)0.7982 (1.27)38 (2.12)0.475 Alpha-glucosidase inhibitor4 (1.82%)13 (0.75)0.1083 (1.91)14 (0.78)0.143 Thiazolidinedione52 (23.64%)404 (23.31)0.91535 (22.29)421 (23.44)0.744 Regular insulin41 (18.64%)186 (10.73)<0.00132 (20.38)195 (10.86)<0.001Continuous variables are expressed as mean ± s.d. and categorical variables as n (%). HAA, hypoglycaemia requiring medical assistance; HMA, hypoglycaemia requiring any assistance; PHQ-9, nine-item Patient Health Questionnaire; T2DM, type 2 diabetes mellitus; BMI, body mass index; HbA1c, glycated haemoglobin; LDL, low-density lipoprotein cholesterol; DBP, diastolic blood pressure; SBP, systolic blood pressure; GFR, glomerular filtration rate.
Table 1 illustrates the prevalence and incidence of mild or moderate–severe depression based on the PHQ-9 score at both baseline and during follow-up. At baseline, 520 participants (26.6%) exhibited mild depression, while 381 participants (19.5%) met criteria for moderate–severe depression. Figure 1 depicts longitudinal trends in depressive symptom trajectories among participants with complete follow-up data. There was a noticeable reduction in the prevalence of moderate–severe depression over the course of the follow-up duration. Depressive symptoms demonstrated dynamic changes during this period, with half of the participants who initially experienced moderate–severe depression reporting relief in their symptoms. Furthermore, a noteworthy proportion of participants, initially without depression or with mild depression, developed mild or moderate–severe depression, respectively. Nevertheless, participants without depression at the beginning of the study were less likely to progress to moderate–severe depression.
Fig. 1. Depressive symptoms were evaluated at baseline and at 12, 36 and 48 months, illustrating their dynamic changes over time.
Figure 2 illustrates the HbA1c levels and their respective 95% confidence intervals across different degrees of depression groups. Participants with varying degrees of depression exhibited less effective blood glucose control compared to their counterparts without depression. As the severity of depression increased, blood glucose control deteriorated. Notably, participants with persistent moderate–severe depression exhibited the least optimal blood glucose control. However, it is important to acknowledge a limitation in the analysis because of a low sample size in participants with persistent mild or moderate–severe depression over the 60-month period, primarily attributed to loss of follow-up. Consequently, the 95% confidence interval widens in Figs. 2(c) and 2(d), reflecting the impact of this limitation on the precision of the results in those specific groups.
Fig. 2. Comparison of glycated haemoglobin (HbA1c) levels and corresponding 95% confidence intervals between participants with and without depression: (a) ever had depression and never had depression; (b) persistent depression and never had depression; (c) persistent mild depression and never had depression; (d) persistent moderate–severe depression and never had depression.
Table 3 illustrates the association between the PHQ-9, both as a continuous variable and a categorical variable, and the incidence of HAA or HMA. According to Model 3, each unit increase in the PHQ-9 score did not show an associated increase in the risk of HAA or HMA (hazard ratio, 1.00, 95% CI, 0.97–1.03 for HAA; hazard ratio 0.98, 95% CI, 0.95–1.02 for HMA). Even after adjusting for relevant variables, individuals experiencing mild depression or moderate–severe depression did not exhibit a higher risk of HAA or HMA compared to those without depression. Similarly, participants with a history of ever experiencing depression or persistent depression (whether mild or moderate–severe) did not demonstrate a higher risk of HAA or HMA when compared to those who had never experienced depression. Subgroup analysis showed that age, gender and glucose control strategy did not moderate the association between depression measured by the PHQ-9 and HAA or HMA (Supplementary Table 1 available at https://doi.org/10.1192/bjo.2025.10853).
Table 3. Proportional hazard models of depression predicting hypoglycaemia eventsHAA (hazard ratio, 95% CI)HMA (hazard ratio, 95% CI)Model 1Model 2Model 3Model 1Model 2Model 3NoneRef.Ref.Ref.Ref.Ref.Ref.Mild^ a ^ 0.93 (0.68,1.29)0.94 (0.68,1.30)0.91 (0.66,1.26)0.95 (0.65,1.38)0.93 (0.64,1.36)0.90 (0.62,1.32)Moderate–severe^ a ^ 1.04 (0.70,1.53)1.04 (0.70,1.53)0.99 (0.66,1.47)0.81 (0.49,1.34)0.80 (0.48,1.32)0.75 (0.45,1.26) P for trend^ a ^ 1.000.980.770.430.390.27PHQ-9 continuous^ a ^ 1.01 (0.98,1.04)1.01 (0.98,1.04)1.00 (0.97,1.03)0.99 (0.95,1.03)0.99 (0.95,1.03)0.98 (0.95,1.02)Never depressionRef.Ref.Ref.Ref.Ref.Ref.Ever depression (N = 1912)^ b ^ 0.89 (0.66,1.19)0.89 (0.67,1.20)0.87 (0.65,1.17)0.81 (0.58,1.14)0.81 (0.57,1.14)0.78 (0.56,1.11)Persistent depression (N = 1103)^ b ^ 0.87 (0.59,1.30)0.87 (0.59,1.30)0.80 (0.53,1.20)0.67 (0.41,1.09)0.65 (0.40,1.07)0.64 (0.40,1.07)Persistent mild depression (N = 778)^ b ^ 0.79 (0.39,1.61)0.80 (0.39,1.63)0.73 (0.36,1.51)0.70 (0.30,1.66)0.70 (0.30,1.67)0.66 (0.28,1.58)Persistent moderate–severe depression (N = 770)^ b ^ 1.36 (0.74,2.50)1.36 (0.74,2.50)1.36 (0.74,2.50)(0.81 (0.35,1.89)0.80 (0.34,1.88)0.71 (0.30,1.68)Model 1: age, race, gender, glucose control strategy, living along, education status, duration of diabetes, cigarette and alcohol consumption.Model 2: Model 1 in addition to body mass index (BMI), glycated hemoglobinhaemoglobin (HbA1c), glomerular filtration rate (GFR).Model 3: Model 2 in addition to medication including sulphonylurea, biguanide, meglitinide, alpha-glucosidase inhibitor, thiazolidinedione, regular insulin.HAA, hypoglycaemia requiring any assistance; HMA, hypoglycaemia requiring medical assistance; PHQ-9, nine-item Patient Health Questionnaire.aTime-varying Cox.bCox.
Discussion
This epidemiological analysis of data from the ACCORD-HRQL trial revealed the following in T2DM participants with high cardiovascular disease (CVD) risk: (a) depressive symptoms exhibited dynamic fluctuations during follow-up, emphasising the necessity for regular psychological monitoring and timely interventions; (b) depression at baseline or during the follow-up period was not associated with hypoglycaemia events but was associated with suboptimal glucose control, underscoring the critical role of optimised glucose management in this population.
The relationship between depression and glycaemic control remains controversial,^ 19–23 ^ with inconsistencies potentially attributable to methodological heterogeneity across studies. Divergent findings may stem from variations in depression assessment tools (e.g. the PHQ-9 versus the Center for Epidemiologic Studies Depression Scale (CES-D)), differences in study designs (cross-sectional versus longitudinal) and insufficient adjustment for confounders such as medication concordance. Persistent and transient depression may have different impacts on glycaemic control, contributing to conflicting findings. Previous studies primarily consisted of cross-sectional designs with relatively small sample sizes, resulting in weaker statistical power.^ 16–20 ^ Furthermore, the temporal variability of depressive symptoms – where persistent and transient states deferentially affect glucose regulation – introduces additional complexity.^ 24 ^ To address these limitations, this study employed a prospective cohort design to investigate the long-term association between depression severity and glycaemic control. By considering the dynamic changes in depression and blood sugar levels, the study conducted a total of 7187 depression assessments and 23 716 HbA1c measurements, resulting in robust statistical power. Our study found that depression may worsen glycaemic control by impeding effective diabetes self-management. In addition, Li et al observed that suboptimal glycaemic control could predict depression in individuals with T2DM.^ 25 ^ Therefore, further studies are needed to verify the bidirectional relationship.
Previous studies have found that hypoglycaemic events may trigger depression, but there is currently no research on whether depression can lead to hypoglycaemic events. For the first time, our study reveals that depression does not directly cause hypoglycaemic events in individuals with diabetes. Studies have suggested that depression may not directly influence blood glucose levels but rather affect the management of glycaemic control.^ 26 ^ Depressive symptoms may reduce engagement with treatment plans and dietary guidance, potentially contributing to elevated blood glucose levels.^ 23 ^ Depression is closely associated with reduced motivation, which significantly affects treatment concordance. Depressive symptoms often cause patients to disengage from treatment plans and ignore dietary guidance. As a result, instead of leading to hypoglycaemic events, this behavioural change potentially contributes to elevated blood glucose levels. While Heald et al reported a significant association between elevated HbA1c levels and hypoglycaemia-related admissions to hospital in older adults receiving insulin or insulin secretagogues,^ 24 ^ our cohort study failed to replicate this association after rigorous adjustment for antidiabetic medications. Our study uses data from the ACCORD trial, a randomised controlled trial (RCT) with a structured protocol, standardised interventions and close monitoring of participants. In contrast, Heald et al’s analysis draws on primary care databases reflecting real-world clinical practice, where patient management is more heterogeneous. Factors such as treatment adherence, follow-up frequency and intervention variability may differ substantially from those in a controlled trial setting, which could plausibly contribute to the observed differences in findings.
Our study holds significant clinical implications. Clinical physicians should regularly monitor the psychological status of individuals with T2DM, identify potential depression and intervene promptly, conducting regular assessments. We have observed that depression does not increase the risk of hypoglycaemia in individuals with T2DM; rather, it is associated with less effective glycaemic control. Therefore, prioritising glycaemic management is essential to improve the prognosis of individuals with type 2 diabetes and prevent diabetes complications. In real-world settings, where such intensive oversight may be less feasible, patients with depression may face greater challenges in maintaining optimal glucose control. Our findings regarding depression’s independent impact on diabetes outcomes may even underestimate the clinical relevance in routine care, as the combined effects of depression and suboptimal glucose control could further exacerbate adverse outcomes.
Our study has several limitations. First, there were a significant number of participants lost to follow-up for the PHQ-9 data in the fourth year. However, we found no significant differences in baseline characteristics between the lost to follow-up individuals and those with complete data. Second, it is important to acknowledge that the ACCORD study, being a RCT, had all participants’ blood glucose managed by healthcare professionals. This controlled setting may not fully reflect the real-world experiences of all individuals with T2DM. Third, while there is no specific behavioural or adherence data in the ACCORD data-set, the study protocol included regular supervision by healthcare professionals who adjusted medication dosages as needed. Finally, the exclusive recruitment from North America necessitates caution when extrapolating results to other ethnic or geographic populations.
Depressive symptoms fluctuate dynamically in individuals with T2DM, and those experiencing depression tended to exhibit less effective glycaemic control. However, there was no significant association between depression and increased hypoglycaemic events. These findings underscore the necessity for ongoing assessment and management of both mental health and glucose control in individuals with T2DM.
Supporting information
Hong et al. supplementary materialHong et al. supplementary material
The reference list from the paper itself. Each links out to its DOI / PubMed record.
- 1Semenkovich K , Brown ME , Svrakic DM , Lustman PJ. Depression in type 2 diabetes mellitus: prevalence, impact, and treatment. Drugs 2015; 75: 577–87.25851098 10.1007/s 40265-015-0347-4 · doi ↗ · pubmed ↗
- 2Waheed U , Heald AH , Stedman M , Solomon E , Rea R , Eltom S , et al. Distress and living with diabetes: defining characteristics through an online survey. Diabetes Ther 2022; 13: 1585–97.35831740 10.1007/s 13300-022-01291-3PMC 9281294 · doi ↗ · pubmed ↗
- 3Chen Y , Long C , Xing Z. Depression is associated with heart failure in patients with type 2 diabetes mellitus. Front Public Health 2023; 11: 1181336.37304111 10.3389/fpubh.2023.1181336 PMC 10248230 · doi ↗ · pubmed ↗
- 4Pieri BA , Bergin-Cartwright G , Simpson A , Collins J , Reid A , Karalliedde J , et al. Symptoms of anxiety and depression are independently associated with impaired awareness of hypoglycemia in type 1 diabetes. Diabetes Care 2022; 45: 2456–60.36006615 10.2337/dc 21-2482 · doi ↗ · pubmed ↗
- 5Choudhary P , Amiel SA. Hypoglycaemia in type 1 diabetes: technological treatments, their limitations and the place of psychology. Diabetologia 2018; 61: 761–9.29423581 10.1007/s 00125-018-4566-6PMC 6448988 · doi ↗ · pubmed ↗
- 6Yu CY , Hung CH , Wang YY. The impact of prenatal depression and diabetes management self-efficacy on postpartum stress and depression in women with gestational diabetes mellitus. J Clin Nurs 2022; 31: 2867–73.34738289 10.1111/jocn.16113 · doi ↗ · pubmed ↗
- 7Gonzalez JS , Peyrot M , Mc Carl LA , Collins EM , Serpa L , Mimiaga MJ , et al. Depression and diabetes treatment nonadherence: a meta-analysis. Diabetes Care 2008; 31: 2398–403.19033420 10.2337/dc 08-1341 PMC 2584202 · doi ↗ · pubmed ↗
- 8Ciechanowski PS , Katon WJ , Russo JE. Depression and diabetes: impact of depressive symptoms on adherence, function, and costs. Arch Intern Med 2000; 160: 3278–85.11088090 10.1001/archinte.160.21.3278 · doi ↗ · pubmed ↗