The Rising Tide of Coronary Crisis: Decoding Age‐Specific Disparities in Ischemic Heart Disease Burden Through the Global Burden of Disease Study 2021 Revelations: An Ecological Study
Yemin Wang, Jing Li, Hazrat Bilal, Xiao Yu, Lei Sun

TL;DR
This study examines how the burden of ischemic heart disease differs between younger and older adults globally, highlighting the need for age-specific prevention strategies.
Contribution
The study provides new insights into age-specific disparities in ischemic heart disease burden using global data and projections.
Findings
Global IHD prevalence increased, especially among younger adults, while mortality and DALY rates decreased.
Metabolic and behavioral risk factors like high LDL cholesterol and tobacco use are more prevalent in younger adults.
Mortality is projected to decline in both age groups, but prevalence will rise in younger populations.
Abstract
Ischemic heart disease (IHD) remains a critical global public health challenge, yet comparative studies on its burden between younger (20–54 years) and older (55+ years) adults are limited. This study aims to quantify differential IHD burden trajectories across these age groups globally, thereby informing tailored prevention strategies. Using data from the Global Burden of Disease Study 2021 (GBD), we evaluated the IHD burden through prevalence, disability‐adjusted life years (DALYs), and mortality. Trends from 1990 to 2021 were analyzed via estimated annual percentage change (EAPC), and proportional risk contributions were assessed via population attribution scores. Future trends were projected for the next 30 years via a Bayesian age‐period‐cohort model. From 1990 to 2021, the global DALY rates and mortality rates decreased, whereas the prevalence increased, particularly among…
Genes, proteins, chemicals, diseases, species, mutations and cell lines named across the full text — each resolved to its canonical identifier and authoritative record.
Click any figure to enlarge with its caption.
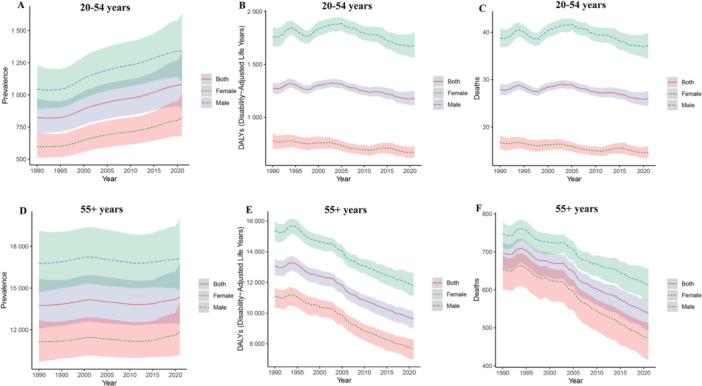 Figure 1
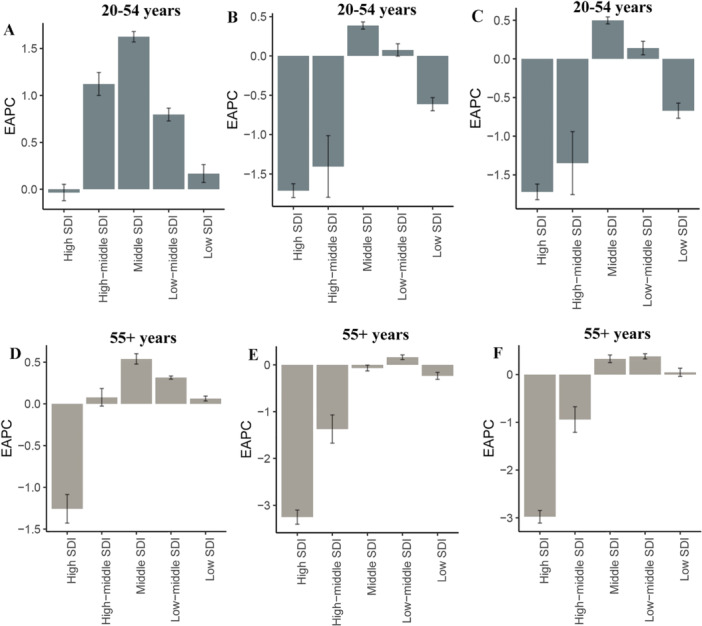 Figure 2
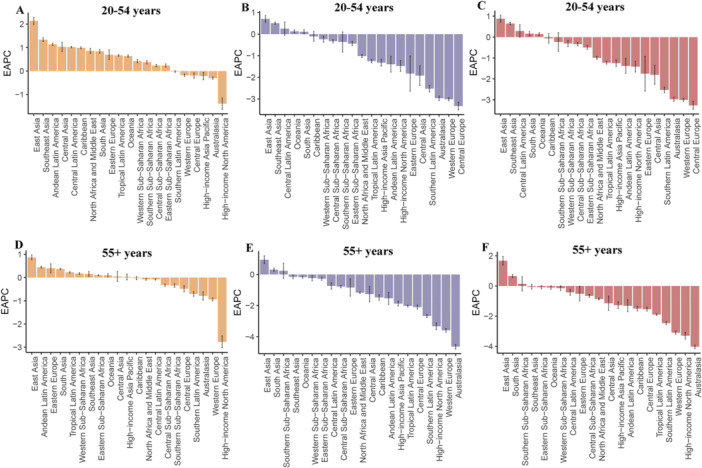 Figure 3
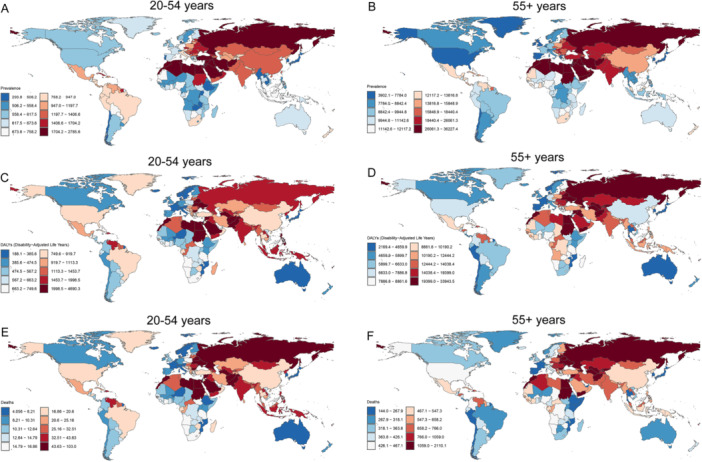 Figure 4
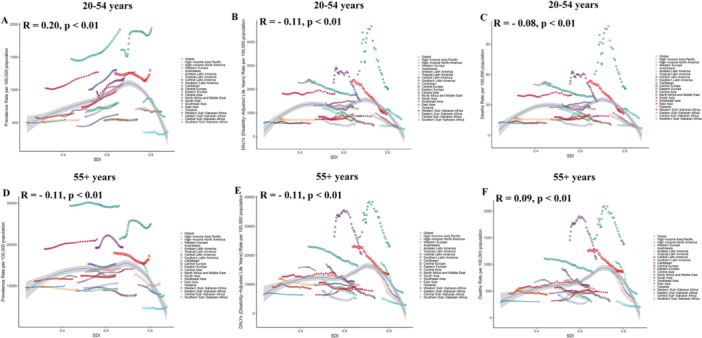 Figure 5
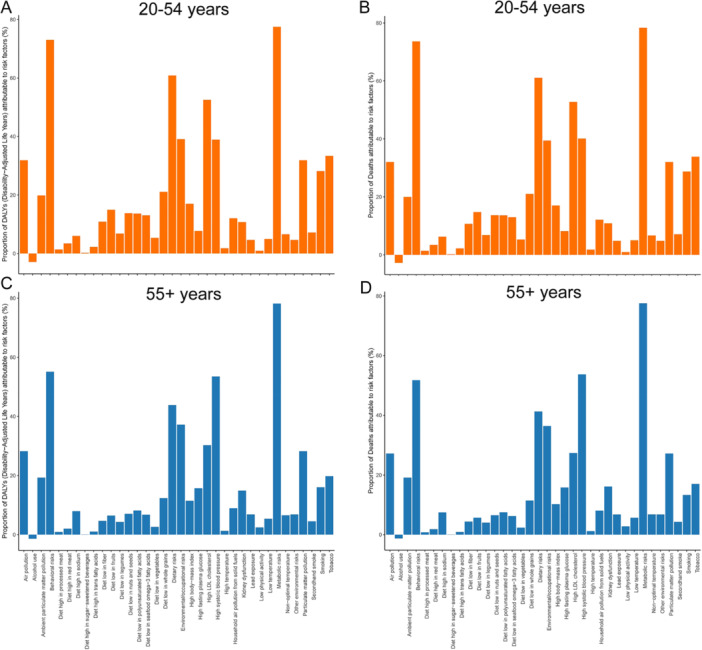 Figure 6
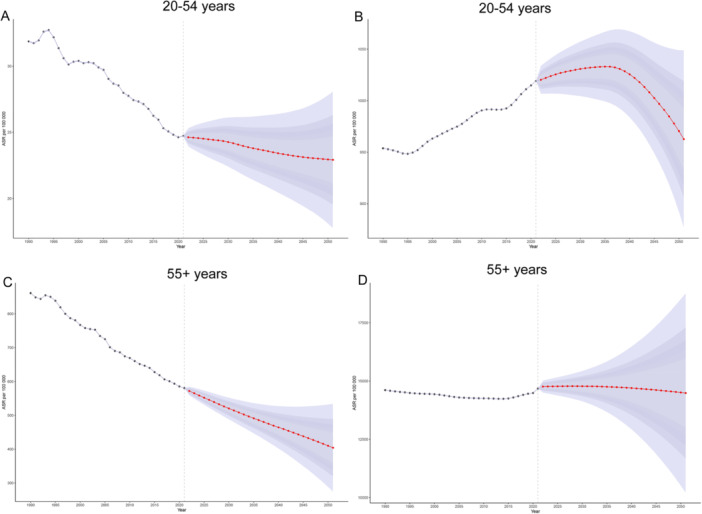 Figure 7
| Prevalence | DALYs | Deaths | |||||||||||||
|---|---|---|---|---|---|---|---|---|---|---|---|---|---|---|---|
| 1990 | 2021 | 1990–2021 | 1990 | 2021 | 1990–2021 | 1990 | 2021 | 1990–2021 | |||||||
| Location | Number | Rate (per 100,000) | Number | Rate (per 100,000) | EAPC | Number | Rate (per 100,000) | Number | Rate (per 100,000) | EAPC | Number | Rate (per 100,000) | Number | Rate (per 100,000) | EAPC |
| Global | 19,807,122.39 (16,915,553.47–23,322,371.69) | 824.05 (703.75–970.30) | 40,741,428.40 (33,729,294.99–50,035,950.55) | 1080.81 (894.79–1327.38) | 0.98 (0.93–1.02) | 30,641,784.56 (29,313,357.73–31,956,855.97) | 1274.82 (1219.55–1329.53) | 44,507,120.07 (41,975,648.24–47,219,100.13) | 1180.71 (1113.55–1252.65) | −0.31 (−0.40 to −0.22) | 670,338.57 (642,923.82–698,512.04) | 27.89 (26.75–29.06) | 979,689.56 (921,164.64–1,041,696.54) | 25.99 (24.44–27.63) | −0.27 (−0.36 to −0.18) |
| SDI quintile | |||||||||||||||
| High SDI | 3,239,968.38 (2,809,555.31–3,725,845.29) | 733.44 (636.01–843.43) | 3,997,057.60 (3,381,229.02–4,723,451.88) | 774.16 (654.88–914.84) | −0.04 (−0.12–0.05) | 4,557,091.37 (4,475,293.55–4,640,349.43) | 1031.60 (1013.08–1050.45) | 3,203,390.22 (3,009,256.35–3,425,415.08) | 620.44 (582.84–663.44) | −1.71 (−1.80 to −1.63) | 103,055.72 (101,351.76–104,805.33) | 23.33 (22.94–23.73) | 72,056.79 (68,038.87–76,674.68) | 13.96 (13.18–14.85) | −1.72 (−1.82 to −1.62) |
| High‐middle SDI | 5,005,773.88 (4,283,679.40–5,908,254.18) | 961.09 (822.45–1134.37) | 8,568,950.83 (7,038,510.86–10,522,260.54) | 1310.25 (1076.24–1608.93) | 1.12 (1.00–1.24) | 7,193,217.18 (6,838,649.62–7,509,843.88) | 1381.08 (1313.00–1441.87) | 6,711,381.66 (6,148,012.75–7,388,722.64) | 1026.22 (940.08–1129.79) | −1.41 (−1.80 to −1.01) | 160,073.47 (152,598.33–167,032.68) | 30.73 (29.30–32.07) | 150,207.14 (136,867.61–165,391.39) | 22.97 (20.93–25.29) | −1.35 (−1.76 to −0.94) |
| Middle SDI | 5,829,113.26 (4,936,211.72–6,965,577.83) | 742.76 (628.98–887.57) | 14,313,450.40 (11,703,206.85–17,787,040.34) | 1164.17 (951.87–1446.70) | 1.63 (1.57–1.68) | 9,057,274.40 (8,556,566.34–9,539,173.59) | 1154.10 (1090.30–1215.50) | 15,567,797.98 (14,531,838.76–16,680,959.59) | 1266.20 (1181.94–1356.73) | 0.39 (0.34–0.43) | 194,028.39 (183,629.99–204,375.57) | 24.72 (23.40–26.04) | 342,530.46 (319,734.07–367,352.67) | 27.86 (26.01–29.88) | 0.50 (0.45–0.54) |
| Low‐middle SDI | 4,332,687.94 (3,682,833.22–5,101,438.88) | 922.66 (784.27–1086.37) | 10,311,731.61 (8,505,859.64–12,536,715.29) | 1126.18 (928.95–1369.17) | 0.80 (0.73–0.87) | 7,763,889.31 (7,140,440.36–8,447,003.63) | 1653.35 (1520.58–1798.82) | 14,721,652.76 (13,536,284.60–15,977,207.23) | 1607.80 (1478.34–1744.92) | 0.08 (−0.00–0.15) | 167,560.55 (154,150.89–182,117.86) | 35.68 (32.83–38.78) | 321,556.03 (295,281.94–349,402.64) | 35.12 (32.25–38.16) | 0.14 (0.05–0.23) |
| Low SDI | 1,377,510.96 (1,180,899.46–1,605,389.64) | 746.96 (640.34–870.52) | 3,517,162.56 (2,922,032.68–4,208,968.41) | 779.65 (647.73–933.01) | 0.17 (0.07–0.26) | 2,029,516.37 (1,780,524.04–2,348,647.13) | 1100.51 (965.49–1273.56) | 4,265,099.63 (3,796,957.27–4,771,318.95) | 945.45 (841.68–1057.66) | −0.61 (−0.70 to −0.53) | 44,712.20 (39,379.83–51,848.64) | 24.25 (21.35–28.12) | 92,499.05 (82,404.57–103,604.90) | 20.50 (18.27–22.97) | −0.67 (−0.77 to −0.57) |
| Region | |||||||||||||||
| East Asia | 4,216,289.68 (3,494,283.58–5,121,880.23) | 693.07 (574.39–841.93) | 9,347,080.35 (7,481,577.59–11,849,841.72) | 1270.50 (1016.93–1610.68) | 2.14 (1.98–2.29) | 4,423,183.90 (3,862,165.39–5,029,240.82) | 727.08 (634.86–826.71) | 6,256,673.99 (5,110,018.14–7,535,650.90) | 850.44 (694.58–1024.28) | 0.70 (0.55–0.85) | 93,563.03 (81,381.34–106,563.41) | 15.38 (13.38–17.52) | 138,266.47 (111,760.59–168,068.70) | 18.79 (15.19–22.84) | 0.88 (0.71–1.04) |
| Southeast Asia | 911,618.65 (782,169.66–1,058,753.88) | 448.49 (384.80–520.88) | 2,230,321.97 (1,862,021.35–2,660,640.94) | 629.18 (525.28–750.58) | 1.34 (1.25–1.42) | 2,665,411.67 (2,428,680.92–2,905,234.32) | 1311.30 (1194.84–1429.29) | 5,196,197.04 (4,570,281.68–5,946,124.58) | 1465.87 (1289.30–1677.43) | 0.51 (0.45–0.56) | 56,506.48 (51,438.49–61,575.71) | 27.80 (25.31–30.29) | 113,814.68 (99,749.85–130,218.21) | 32.11 (28.14–36.74) | 0.65 (0.59–0.71) |
| Oceania | 16,058.71 (14,394.63–18,058.16) | 594.22 (532.65–668.21) | 43,860.03 (37,762.52–50,478.95) | 695.41 (598.74–800.36) | 0.64 (0.59–0.68) | 61,340.30 (48,307.78–78,855.66) | 2269.79 (1787.54–2917.91) | 145,122.99 (115,911.80–179,916.10) | 2300.97 (1837.82–2852.63) | 0.13 (0.06–0.20) | 1351.01 (1068.02–1742.27) | 49.99 (39.52–64.47) | 3197.00 (2557.00–3964.44) | 50.69 (40.54–62.86) | 0.15 (0.08–0.21) |
| Central Asia | 288,994.84 (258,533.61–323,123.48) | 971.94 (869.49–1086.72) | 545,980.56 (475,634.71–622,283.24) | 1170.77 (1019.92–1334.39) | 1.03 (0.83–1.23) | 678,395.88 (644,622.19–710,550.98) | 2281.56 (2167.97–2389.70) | 703,040.42 (617,928.96–792,192.02) | 1507.56 (1325.05–1698.73) | −1.92 (−2.37 to −1.46) | 15,134.59 (14,435.97–15,839.79) | 50.90 (48.55–53.27) | 15,630.39 (13,731.38–17,673.80) | 33.52 (29.44–37.90) | −1.81 (−2.25 to −1.36) |
| Central Europe | 741,584.04 (647,720.14–842,883.11) | 1250.49 (1092.22–1421.31) | 708,728.69 (601,986.64–823,998.05) | 1296.17 (1100.95–1506.98) | −0.19 (−0.31 to −0.08) | 1,373,975.01 (1,347,676.47–1,396,382.21) | 2316.86 (2272.52–2354.65) | 530,895.34 (487,100.22–575,412.51) | 970.94 (890.84–1052.35) | −3.32 (−3.50 to −3.14) | 31,020.70 (30,432.79–31,510.59) | 52.31 (51.32–53.13) | 12,177.84 (11,150.22–13,216.74) | 22.27 (20.39–24.17) | −3.27 (−3.46 to −3.07) |
| Eastern Europe | 1,775,106.32 (1,467,012.27–2,158,548.70) | 1609.01 (1329.75–1956.58) | 1,907,648.31 (1,521,288.38–2,409,192.99) | 1936.29 (1544.13–2445.37) | 0.70 (0.49–0.90) | 2,897,504.12 (2,792,152.65–2,981,910.31) | 2626.39 (2530.89–2702.90) | 1,977,885.18 (1,778,631.06–2,194,571.07) | 2007.59 (1805.34–2227.52) | −1.82 (−2.64 to −1.01) | 66,596.12 (64,276.49–68,473.66) | 60.36 (58.26–62.07) | 45,210.10 (40,555.31–50,317.66) | 45.89 (41.16–51.07) | −1.75 (−2.58 to −0.92) |
| High‐income Asia Pacific | 310,918.39 (259,008.75–371,947.85) | 352.97 (294.04–422.26) | 305,811.29 (251,057.97–363,827.10) | 363.39 (298.33–432.33) | −0.22 (−0.38 to −0.06) | 400,537.44 (382,238.73–420,426.25) | 454.72 (433.94–477.30) | 261,094.41 (250,765.02–271,944.50) | 310.26 (297.98–323.15) | −1.32 (−1.47 to −1.16) | 8751.21 (8366.34–9184.89) | 9.93 (9.50–10.43) | 5836.49 (5628.28–6052.50) | 6.94 (6.69–7.19) | −1.24 (−1.40 to −1.09) |
| Australasia | 70,792.31 (62,330.82–79,472.84) | 703.45 (619.37–789.71) | 98,232.16 (81,637.47–116,198.56) | 673.50 (559.72–796.68) | −0.30 (−0.36 to −0.25) | 92,749.12 (89,548.92–96,499.82) | 921.63 (889.83–958.90) | 53,646.32 (49,907.98–57,199.48) | 367.81 (342.18–392.17) | −2.97 (−3.07 to −2.86) | 2113.21 (2035.85–2192.91) | 21.00 (20.23–21.79) | 1211.98 (1128.29–1292.48) | 8.31 (7.74–8.86) | −2.97 (−3.07 to −2.88) |
| Western Europe | 1,349,162.45 (1,196,952.71–1,527,622.80) | 714.01 (633.46–808.46) | 1,306,908.56 (1,097,206.09–1,534,900.90) | 664.94 (558.25–780.95) | −0.18 (−0.23 to −0.13) | 1,840,021.52 (1,810,122.26–1,869,719.51) | 973.79 (957.97–989.51) | 732,275.68 (709,743.07–754,842.11) | 372.58 (361.11–384.06) | −3.01 (−3.08 to −2.94) | 41,927.90 (41,300.45–42,510.20) | 22.19 (21.86–22.50) | 16,649.00 (16,190.56–17,068.23) | 8.47 (8.24–8.68) | −3.00 (−3.08 to −2.93) |
| Southern Latin America | 119,054.80 (105,978.29–134,756.90) | 535.38 (476.57–605.99) | 183,936.53 (157,799.12–212,409.96) | 549.58 (471.48–634.65) | −0.02 (−0.05–0.01) | 236,319.45 (227,178.71–245,029.04) | 1062.70 (1021.60–1101.87) | 155,799.98 (149,083.48–162,884.01) | 465.51 (445.44–486.68) | −2.52 (−2.67 to −2.37) | 5318.44 (5112.22–5519.67) | 23.92 (22.99–24.82) | 3490.89 (3338.58–3638.61) | 10.43 (9.98–10.87) | −2.53 (−2.66 to −2.40) |
| High‐income North America | 1,148,767.46 (938,024.79–1,417,853.20) | 810.41 (661.74–1000.24) | 996,287.43 (810,945.57–1,223,319.95) | 592.74 (482.47–727.81) | −1.39 (−1.63 to −1.15) | 1,585,056.89 (1,565,001.63–1,604,410.03) | 1118.19 (1104.05–1131.85) | 1,231,847.07 (1,185,915.96–1,271,390.18) | 732.88 (705.56–756.41) | −1.47 (−1.72 to −1.22) | 36,136.01 (35,759.66–36,493.31) | 25.49 (25.23–25.74) | 28,339.35 (27,320.13–29,220.00) | 16.86 (16.25–17.38) | −1.41 (−1.67 to −1.15) |
| Caribbean | 159,038.28 (142,639.02–177,680.92) | 1001.26 (898.02–1118.63) | 298,554.33 (257,593.21–342,844.63) | 1301.59 (1123.01–1494.68) | 0.99 (0.95–1.03) | 220,149.50 (207,361.54–234,679.07) | 1386.00 (1305.49–1477.47) | 285,974.03 (240,315.57–341,502.19) | 1246.74 (1047.69–1488.83) | −0.10 (−0.33–0.13) | 4859.12 (4565.97–5196.94) | 30.59 (28.75–32.72) | 6372.55 (5344.23–7627.48) | 27.78 (23.30–33.25) | −0.06 (−0.29–0.17) |
| Andean Latin America | 92,237.21 (82,486.49–103,369.02) | 588.19 (526.01–659.18) | 260,408.47 (223,443.06–300,509.65) | 799.94 (686.39–923.13) | 1.14 (1.08–1.19) | 117,927.14 (105,461.13–133,014.68) | 752.02 (672.52–848.23) | 166,626.48 (137,165.73–200,625.34) | 511.86 (421.36–616.30) | −1.39 (−1.76 to −1.03) | 2431.39 (2163.70–2751.20) | 15.50 (13.80–17.54) | 3457.53 (2800.47–4226.09) | 10.62 (8.60–12.98) | −1.38 (−1.75 to −1.01) |
| Central Latin America | 500,304.24 (433,677.31–579,219.52) | 733.51 (635.83–849.21) | 1,228,222.05 (1,028,135.41–1,485,029.27) | 982.97 (822.83–1188.49) | 1.02 (0.99–1.05) | 568,895.91 (558,088.11–578,533.29) | 834.08 (818.23–848.21) | 1,161,652.40 (1,036,977.70–1,305,433.78) | 929.69 (829.91–1044.76) | 0.25 (−0.05–0.56) | 12,172.43 (11,934.33–12,367.65) | 17.85 (17.50–18.13) | 25,322.46 (22,512.80–28,510.42) | 20.27 (18.02–22.82) | 0.29 (−0.00–0.59) |
| Tropical Latin America | 445,276.00 (370,045.28–532,778.22) | 653.39 (543.00–781.79) | 938,076.42 (773,877.47–1,156,444.53) | 804.25 (663.48–991.47) | 0.67 (0.64–0.70) | 865,496.27 (846,059.90–883,223.15) | 1270.01 (1241.49–1296.03) | 1,018,579.65 (981,280.98–1,054,190.71) | 873.27 (841.29–903.80) | −1.25 (−1.33 to −1.18) | 19,077.99 (18,669.83–19,451.24) | 27.99 (27.40–28.54) | 22,566.23 (21,726.17–23,319.23) | 19.35 (18.63–19.99) | −1.23 (−1.29 to −1.16) |
| North Africa and Middle East | 1,972,966.16 (1,772,063.16–2,198,302.34) | 1470.65 (1320.90–1638.62) | 5,962,991.61 (5,162,926.79–6,824,356.69) | 1921.84 (1663.99–2199.46) | 0.86 (0.75–0.97) | 3,192,451.09 (2,950,503.11–3,505,064.06) | 2379.66 (2199.31–2612.68) | 5,501,030.26 (4,696,283.36–6,395,895.31) | 1772.96 (1513.59–2061.37) | −1.02 (−1.09 to −0.95) | 69,236.38 (63,964.47–76,075.22) | 51.61 (47.68–56.71) | 120,340.72 (102,557.44–140,440.21) | 38.79 (33.05–45.26) | −0.99 (−1.07 to −0.92) |
| South Asia | 4,678,081.21 (3,832,219.66–5,680,406.23) | 1025.80 (840.32–1245.59) | 11,605,414.23 (9,234,775.89–14,655,693.30) | 1268.65 (1009.51–1602.10) | 0.84 (0.76–0.91) | 8,276,222.02 (7,518,362.51–9,108,007.94) | 1814.79 (1648.61–1997.18) | 16,486,121.42 (14,981,280.67–17,900,750.16) | 1802.19 (1637.69–1956.83) | 0.11 (0.01–0.21) | 179,094.34 (163,212.20–197,269.07) | 39.27 (35.79–43.26) | 360,659.59 (326,761.16–393,075.45) | 39.43 (35.72–42.97) | 0.17 (0.06–0.27) |
| Central Sub‐Saharan Africa | 104,830.84 (93,171.73–116,932.16) | 518.60 (460.92–578.47) | 295,515.07 (253,882.02–339,950.21) | 543.79 (467.18–625.55) | 0.24 (0.19–0.29) | 158,631.77 (118,305.05–210,989.39) | 784.75 (585.26–1043.77) | 385,895.52 (286,745.36–509,593.83) | 710.10 (527.65–937.72) | −0.33 (−0.41 to −0.25) | 3592.33 (2662.86–4763.87) | 17.77 (13.17–23.57) | 8645.73 (6351.47–11,439.81) | 15.91 (11.69–21.05) | −0.34 (−0.43 to −0.26) |
| Eastern Sub‐Saharan Africa | 344,786.69 (297,348.54–398,794.26) | 508.82 (438.81–588.52) | 946,288.76 (797,797.54–1,112,086.35) | 551.85 (465.25–648.54) | 0.24 (0.17–0.31) | 391,531.14 (342,947.04–472,743.35) | 577.80 (506.11–697.65) | 934,945.26 (792,620.61–1,099,523.06) | 545.24 (462.24–641.21) | −0.44 (−0.54 to −0.35) | 8361.45 (7297.73–10,118.41) | 12.34 (10.77–14.93) | 19,635.53 (16,621.95–23,169.49) | 11.45 (9.69–13.51) | −0.50 (−0.60 to −0.41) |
| Southern Sub‐Saharan Africa | 147,498.94 (123,092.23–176,295.67) | 685.00 (571.65–818.74) | 314,874.81 (255,798.04–390,016.87) | 801.13 (650.82–992.31) | 0.37 (0.30–0.45) | 173,834.19 (159,762.98–188,110.32) | 807.30 (741.96–873.60) | 282,524.58 (253,557.81–316,735.08) | 718.82 (645.12–805.86) | −0.37 (−0.83–0.10) | 3711.24 (3399.99–4019.30) | 17.24 (15.79–18.67) | 6234.14 (5556.57–6992.80) | 15.86 (14.14–17.79) | −0.23 (−0.68–0.22) |
| Western Sub‐Saharan Africa | 413,755.18 (355,277.07–480,426.26) | 580.88 (498.78–674.48) | 1,216,286.77 (1,016,337.00–1,456,551.89) | 643.17 (537.44–770.22) | 0.42 (0.36–0.49) | 422,150.25 (338,459.14–505,398.96) | 592.67 (475.17–709.54) | 1,039,292.03 (822,268.38–1,249,460.38) | 549.57 (434.81–660.71) | −0.24 (−0.38 to −0.09) | 9383.20 (7489.07–11,230.18) | 13.17 (10.51–15.77) | 22,630.90 (17,915.21–27,396.44) | 11.97 (9.47–14.49) | −0.31 (−0.45 to −0.17) |
| Prevalence | DALYs | Deaths | |||||||||||||
|---|---|---|---|---|---|---|---|---|---|---|---|---|---|---|---|
| 1990 | 2021 | 1990–2021 | 1990 | 2021 | 1990–2021 | 1990 | 2021 | 1990–2021 | |||||||
| Location | Number | Rate (per 100,000) | Number | Rate (per 100,000) | EAPC | Number | Rate (per 100,000) | Number | Rate (per 100,000) | EAPC | Number | Rate (per 100,000) | Number | Rate (per 100,000) | EAPC |
| Global | 92,289,382.35 (81,067,796.91–105,262,046.95) | 13,745.29 (12,073.98–15,677.40) | 213,453,241.21 (184,076,211.92–249,859,637.02) | 14,364.42 (12,387.48–16,814.40) | 0.05 (0.01–0.09) | 87,824,595.65 (83,702,049.38–90,883,694.86) | 13,080.32 (12,466.32–13,535.93) | 143,185,414.92 (133,394,005.19–151,040,815.63) | 9635.72 (8976.80–10,164.35) | −1.12 (−1.19 to −1.05) | 4,687,253.21 (4,414,722.00–4,860,810.70) | 698.10 (657.51–723.95) | 8,002,785.77 (7,312,844.59–8,503,729.13) | 538.55 (492.12–572.26) | −0.93 (−1.00 to −0.86) |
| SDI quintile | |||||||||||||||
| High SDI | 21,999,850.71 (19,266,297.61–24,944,436.88) | 11,798.49 (10,332.48–13,377.66) | 30,227,014.34 (26,295,362.06–35,004,963.84) | 8761.12 (7621.56–10,145.98) | −1.26 (−1.43 to −1.09) | 27,421,347.69 (25,737,624.37–28,260,872.52) | 14,706.03 (13,803.05–15,156.26) | 20,331,818.06 (18,353,633.84–21,447,304.84) | 5893.06 (5319.69–6216.37) | −3.25 (−3.40 to −3.10) | 1,628,965.11 (1,488,037.09–1,693,327.45) | 873.61 (798.03–908.13) | 1,320,158.44 (1,143,293.57–1,414,389.00) | 382.64 (331.38–409.95) | −2.98 (−3.11 to −2.84) |
| High‐middle SDI | 25,723,348.04 (22,674,794.40–29,178,497.76) | 14,909.95 (13,142.93–16,912.65) | 55,244,951.26 (47,424,484.20–64,705,531.19) | 15,935.56 (13,679.72–18,664.49) | 0.08 (−0.03–0.19) | 26,266,119.99 (25,195,002.75–27,059,184.97) | 15,224.55 (14,603.71–15,684.24) | 37,786,326.10 (34,730,709.70–40,727,348.45) | 10,899.57 (10,018.17–11,747.91) | −1.37 (−1.67 to −1.07) | 1,443,286.67 (1,369,916.90–1,488,494.30) | 836.57 (794.04–862.77) | 2,299,607.02 (2,075,111.74–2,486,156.97) | 663.33 (598.57–717.14) | −0.94 (−1.21 to −0.67) |
| Middle SDI | 22,055,909.64 (19,231,339.58–25,436,778.44) | 12,707.91 (11,080.48–14,655.85) | 71,030,881.59 (61,016,917.99–84,222,279.94) | 15,117.50 (12,986.23–17,925.03) | 0.54 (0.48–0.60) | 17,203,258.04 (16,202,654.76–18,271,163.97) | 9911.96 (9335.45–10,527.26) | 45,468,501.94 (41,862,467.25–48,770,794.10) | 9677.06 (8909.59–10,379.89) | −0.07 (−0.13 to −0.01) | 841,287.33 (787,398.58–894,057.22) | 484.72 (453.67–515.13) | 2,465,761.36 (2,232,696.45–2,654,271.84) | 524.79 (475.18–564.91) | 0.33 (0.25–0.41) |
| Low‐middle SDI | 17,150,840.16 (14,991,660.83–19,685,643.25) | 17,014.58 (14,872.55–19,529.24) | 44,862,747.39 (38,414,745.00–52,713,662.80) | 18,608.84 (15,934.24–21,865.36) | 0.32 (0.30–0.34) | 12,681,419.92 (11,776,525.81–13,528,382.21) | 12,580.67 (11,682.96–13,420.90) | 31,064,868.35 (28,843,166.17–33,159,099.09) | 12,885.55 (11,964.00–13,754.22) | 0.17 (0.12–0.22) | 582,395.83 (537,077.64–623,970.67) | 577.77 (532.81–619.01) | 1,509,310.07 (1,398,963.35–1,611,109.52) | 626.05 (580.28–668.28) | 0.38 (0.33–0.44) |
| Low SDI | 5,238,138.41 (4,573,141.46–5,974,816.97) | 14,040.25 (12,257.80–16,014.83) | 11,891,101.57 (10,095,825.05–14,014,580.44) | 14,491.10 (12,303.28–17,078.87) | 0.06 (0.03–0.09) | 4,104,317.85 (3,632,667.30–4,558,203.43) | 11,001.17 (9736.96–12,217.76) | 8,384,377.81 (7,617,503.70–9,322,450.67) | 10,217.63 (9283.07–11,360.81) | −0.23 (−0.31 to −0.16) | 183,260.09 (162,510.69–202,981.23) | 491.21 (435.59–544.07) | 399,206.87 (362,780.31–439,680.14) | 486.49 (442.10–535.82) | 0.05 (−0.04–0.13) |
| Region | |||||||||||||||
| East Asia | 16,070,428.88 (13,733,423.21–18,778,718.39) | 10,788.92 (9219.97–12,607.14) | 56,019,186.97 (46,742,202.89–67,844,269.40) | 14,286.21 (11,920.36–17,301.88) | 0.87 (0.76–0.98) | 9,576,774.18 (8,486,007.51–10,764,404.25) | 6429.39 (5697.10–7226.71) | 30,466,059.73 (25,510,618.95–35,389,053.08) | 7769.56 (6505.81–9025.04) | 0.94 (0.69–1.20) | 474,600.39 (421,538.13–532,773.51) | 318.62 (283.00–357.68) | 1,868,959.12 (1,566,239.82–2,173,053.63) | 476.63 (399.43–554.18) | 1.68 (1.40–1.97) |
| Southeast Asia | 3,742,100.75 (3,306,299.05–4,245,825.47) | 8837.93 (7808.67–10,027.60) | 10,697,296.84 (9,330,979.51–12,384,159.26) | 9338.16 (8145.44–10,810.70) | 0.16 (0.06–0.26) | 4,092,722.21 (3,689,866.87–4,490,439.82) | 9666.01 (8714.56–10,605.32) | 10,646,731.03 (9,570,229.03–11,585,163.50) | 9294.02 (8354.29–10,113.22) | −0.16 (−0.28 to −0.04) | 195,054.55 (175,393.28–214,233.58) | 460.67 (414.24–505.97) | 523,676.89 (473,047.93–567,186.09) | 457.14 (412.95–495.12) | −0.05 (−0.21–0.11) |
| Oceania | 55,439.60 (49,918.28–61,405.55) | 11,523.79 (10,376.12–12,763.89) | 149,157.46 (132,933.07–168,372.84) | 12,085.70 (10,771.10–13,642.66) | 0.10 (0.03–0.18) | 74,689.10 (62,684.36–89,960.12) | 15,525.03 (13,029.70–18,699.30) | 180,629.37 (151,949.14–212,457.50) | 14,635.76 (12,311.90–17,214.68) | −0.18 (−0.25 to −0.10) | 3170.33 (2681.83–3785.67) | 658.99 (557.45–786.90) | 7922.59 (6747.40–9314.34) | 641.94 (546.72–754.71) | −0.10 (−0.21–0.02) |
| Central Asia | 1,535,792.56 (1,420,391.64–1,671,452.47) | 19,202.09 (17,759.23–20,898.26) | 2,813,253.95 (2,546,858.82–3,102,216.19) | 19,335.36 (17,504.44–21,321.39) | 0.05 (−0.17–0.26) | 2,122,093.94 (2,027,593.86–2,188,327.89) | 26,532.65 (25,351.11–27,360.77) | 2,966,175.40 (2,699,031.72–3,260,216.58) | 20,386.39 (18,550.32–22,407.32) | −1.27 (−1.76 to −0.77) | 116,524.63 (109,385.66–120,752.08) | 1456.91 (1367.65–1509.77) | 159,690.30 (144,655.91–174,996.80) | 1097.54 (994.21–1202.74) | −1.14 (−1.61 to −0.66) |
| Central Europe | 4,767,270.60 (4,223,058.98–5,365,574.95) | 17,975.89 (15,923.84–20,231.91) | 6,378,996.29 (5,569,995.12–7,276,556.19) | 17,227.49 (15,042.65–19,651.49) | −0.48 (−0.61 to −0.35) | 6,063,698.79 (5,880,480.25–6,186,157.83) | 22,864.31 (22,173.45–23,326.07) | 4,992,280.16 (4,582,748.47–5,316,613.92) | 13,482.44 (12,376.44–14,358.36) | −2.10 (−2.23 to −1.96) | 333,001.13 (318,792.19–340,466.38) | 1255.64 (1202.07–1283.79) | 319,089.04 (288,518.75–339,728.23) | 861.75 (779.19–917.49) | −1.54 (−1.66 to −1.42) |
| Eastern Europe | 10,454,779.18 (9,107,584.53–12,000,126.18) | 21,383.05 (18,627.65–24,543.73) | 15,507,312.89 (13,126,393.31–18,402,007.44) | 24,979.96 (21,144.66–29,642.89) | 0.40 (0.21–0.60) | 12,786,862.33 (12,335,434.83–13,033,091.57) | 26,152.84 (25,229.54–26,656.45) | 14,367,404.34 (12,989,595.67–15,690,412.36) | 23,143.74 (20,924.30–25,274.91) | −0.84 (−1.39 to −0.28) | 719,545.52 (684,825.54–735,416.69) | 1471.68 (1400.67–1504.14) | 858,359.28 (768,975.00–943,619.13) | 1382.69 (1238.70–1520.03) | −0.51 (−1.00 to −0.02) |
| High‐income Asia Pacific | 1,615,115.45 (1,382,778.14–1,871,573.92) | 4618.81 (3954.38–5352.21) | 3,519,484.66 (2,997,552.88–4,135,939.65) | 4991.94 (4251.64–5866.30) | 0.03 (−0.10–0.16) | 1,813,535.83 (1,681,705.71–1,889,189.54) | 5186.24 (4809.24–5402.59) | 2,050,794.60 (1,750,444.20–2,228,030.31) | 2908.79 (2482.78–3160.18) | −1.87 (−2.03 to −1.72) | 108,771.78 (98,245.26–113,995.78) | 311.06 (280.96–326.00) | 146,849.65 (118,204.85–163,008.68) | 208.29 (167.66–231.21) | −1.27 (−1.48 to −1.05) |
| Australasia | 504,165.62 (460,237.05–552,972.33) | 12,797.67 (11,682.60–14,036.57) | 957,561.99 (845,958.32–1,100,121.31) | 10,839.20 (9575.89–12,452.91) | −0.79 (−0.97 to −0.61) | 658,901.81 (619,800.55–679,417.01) | 16,725.47 (15,732.93–17,246.23) | 392,520.25 (347,230.54–419,227.70) | 4443.16 (3930.50–4745.48) | −4.64 (−4.80 to −4.49) | 38,042.78 (35,182.43–39,543.71) | 965.67 (893.07–1003.77) | 27,427.46 (23,208.55–29,744.33) | 310.47 (262.71–336.69) | −4.03 (−4.15 to −3.91) |
| Western Europe | 9,917,000.37 (8,731,907.53–11,160,072.11) | 10,211.90 (8991.56–11,491.93) | 11,976,445.80 (10,462,771.19–13,757,358.25) | 8030.64 (7015.66–9224.80) | −0.94 (−1.01 to −0.88) | 13,922,634.58 (13,140,921.53–14,341,040.67) | 14,336.65 (13,531.69–14,767.49) | 7,528,161.42 (6,662,923.38–8,017,444.59) | 5047.90 (4467.73–5375.98) | −3.59 (−3.71 to −3.48) | 837,249.48 (769,321.29–868,634.44) | 862.15 (792.20–894.46) | 526,365.68 (447,278.63–567,424.50) | 352.95 (299.92–380.48) | −3.09 (−3.19 to −2.99) |
| Southern Latin America | 712,494.10 (644,758.43–788,311.51) | 8994.47 (8139.38–9951.58) | 1,157,672.28 (1,037,942.97–1,309,362.61) | 7866.71 (7053.11–8897.49) | −0.70 (−0.80 to −0.61) | 1,024,318.45 (984,723.46–1,053,517.86) | 12,930.91 (12,431.07–13,299.52) | 773,434.62 (723,822.82–806,872.91) | 5255.70 (4918.58–5482.93) | −2.68 (−2.78 to −2.57) | 57,413.40 (54,509.69–59,387.94) | 724.78 (688.13–749.71) | 45,583.43 (41,527.39–48,111.16) | 309.75 (282.19–326.93) | −2.46 (−2.56 to −2.37) |
| High‐income North America | 8,933,357.32 (7,517,137.61–10,510,046.95) | 15,421.46 (12,976.67–18,143.27) | 8,763,626.68 (7,393,037.27–10,506,856.11) | 7787.52 (6569.59–93,36.58) | −2.77 (−3.02 to −2.51) | 10,121,985.55 (9,362,518.85–10,490,683.73) | 17,473.37 (16,162.32–18,109.84) | 8,191,184.37 (7,425,053.89–8,618,181.55) | 7278.83 (6598.04–7658.27) | −3.33 (−3.55 to −3.12) | 608,706.65 (544,384.58–639,286.25) | 1050.80 (939.76–1103.59) | 506,378.47 (440,000.25–543,035.47) | 449.98 (390.99–482.55) | −3.29 (−3.51 to −3.07) |
| Caribbean | 658,291.65 (597,084.77–727,031.85) | 15,274.56 (13,854.35–16,869.56) | 1,419,922.55 (1,268,916.17–1,598,576.20) | 15,336.49 (13,705.48–17,266.11) | −0.03 (−0.10–0.04) | 726,251.81 (693,587.69–754,766.40) | 16,851.46 (16,093.54–17,513.09) | 1,001,843.71 (889,753.82–1,128,956.59) | 10,820.85 (9610.17–12,193.78) | −1.48 (−1.66 to −1.30) | 39,693.59 (37,731.60–41,056.45) | 921.02 (875.50–952.65) | 55,028.44 (49,093.30–61,486.54) | 594.36 (530.25–664.11) | −1.49 (−1.65 to −1.34) |
| Andean Latin America | 317,904.72 (285,552.91–355,641.81) | 9473.04 (8509.01–10,597.55) | 1,058,749.10 (929,930.91–1,194,738.41) | 10,687.49 (9387.14–12,060.23) | 0.45 (0.41–0.49) | 264,055.39 (241,276.49–290,360.66) | 7868.42 (7189.65–8652.28) | 508,922.93 (431,492.63–608,560.47) | 5137.30 (4355.68–6143.08) | −1.54 (−1.93 to −1.15) | 14,553.81 (13,237.55–15,872.26) | 433.68 (394.46–472.97) | 29,422.34 (25,097.50–35,104.99) | 297.00 (253.35–354.37) | −1.31 (−1.70 to −0.91) |
| Central Latin America | 1,682,755.94 (1,491,115.74–1,905,228.23) | 12,400.46 (10,988.23–14,039.89) | 5,318,790.11 (4,642,855.40–6,223,572.08) | 12,436.89 (10,856.36–14,552.54) | −0.08 (−0.11 to −0.05) | 1,427,418.96 (1,373,642.97–1,458,932.57) | 10,518.84 (10,122.56–10,751.07) | 3,831,143.57 (3,453,824.06–4,247,220.28) | 8958.34 (8076.06–9931.25) | −0.75 (−0.95 to −0.54) | 76,448.82 (72,527.73–78,426.95) | 563.36 (534.47–577.94) | 221,427.73 (197,309.78–244,728.84) | 517.76 (461.37–572.25) | −0.42 (−0.61 to −0.22) |
| Tropical Latin America | 1,321,024.12 (1,108,098.88–1,554,578.15) | 8724.62 (7318.37–10,267.11) | 4,144,652.68 (3,464,576.77–4,949,502.54) | 9356.33 (7821.09–11,173.23) | 0.23 (0.20–0.26) | 1,801,771.84 (1,716,271.85–1,853,921.22) | 11,899.68 (11,335.00–12,244.10) | 2,789,144.21 (2,587,573.37–2,913,473.08) | 6296.34 (5841.31–6577.01) | −2.02 (−2.08 to −1.97) | 88,356.66 (82,816.19–91,268.22) | 583.55 (546.95–602.77) | 139,596.28 (126,642.92–147,215.80) | 315.13 (285.89–332.33) | −1.90 (−1.95 to −1.84) |
| North Africa and Middle East | 8,302,900.72 (7,703,316.43–9,013,490.15) | 29,376.44 (27,255.05–31,890.57) | 22,377,731.50 (20,252,164.54–25,032,633.94) | 29,354.08 (26,565.86–32,836.66) | −0.08 (−0.12 to −0.03) | 6,489,532.53 (6,036,486.08–7,040,913.04) | 22,960.57 (21,357.65–24,911.41) | 12,506,390.11 (11,116,329.51–13,959,839.30) | 16,405.31 (14,581.89–18,311.87) | −1.17 (−1.23 to −1.11) | 314,742.10 (291,461.22–341,861.46) | 1113.59 (1031.22–1209.54) | 646,864.42 (574,763.29–713,640.58) | 848.53 (753.95–936.12) | −0.86 (−0.92 to −0.80) |
| South Asia | 17,963,711.67 (15,286,274.90–21,097,276.36) | 18,920.67 (16,100.60–22,221.16) | 52,651,087.86 (43,693,204.92–63,401,984.94) | 21,205.06 (17,597.30–25,534.95) | 0.37 (0.35–0.40) | 12,017,243.66 (10,894,521.37–13,078,261.28) | 12,657.42 (11,474.89–13,774.96) | 33,956,161.23 (31,075,856.04–36,753,272.12) | 13,675.74 (12,515.70–14,802.26) | 0.31 (0.21–0.41) | 526,695.19 (473,100.88–575,036.21) | 554.75 (498.30–605.67) | 1,626,381.88 (1,490,038.44–1,763,123.38) | 655.02 (600.11–710.09) | 0.66 (0.56–0.76) |
| Central Sub‐Saharan Africa | 366,275.58 (329,142.12–409,759.84) | 9740.59 (8753.08–10,897.00) | 825,382.33 (726,547.60–934,985.38) | 9147.01 (8051.71–10,361.65) | −0.32 (−0.38 to −0.27) | 447,920.86 (351,318.72–569,941.82) | 11,911.84 (9342.84–15,156.81) | 902,083.82 (701,024.94–1,153,297.41) | 9997.03 (7768.86–12,781.01) | −0.79 (−0.87 to −0.71) | 19,626.59 (15,532.37–24,789.70) | 521.94 (413.06–659.25) | 41,092.25 (32,095.14–52,095.75) | 455.39 (355.68–577.33) | −0.65 (−0.75 to −0.55) |
| Eastern Sub‐Saharan Africa | 1,165,274.58 (1,013,289.67–1,323,287.21) | 9578.41 (8329.12–10,877.26) | 2,717,529.82 (2,320,874.73–3,185,524.40) | 10,050.93 (8583.88–11,781.84) | 0.11 (0.09–0.13) | 794,861.08 (705,595.82–903,548.68) | 6533.66 (5799.91–7427.06) | 1,721,837.29 (1,495,118.67–1,973,507.59) | 6368.31 (5529.78–7299.13) | −0.28 (−0.38 to −0.19) | 35,306.75 (31,265.59–40,230.54) | 290.22 (257.00–330.69) | 80,844.50 (70,160.02–92,566.26) | 299.01 (259.49–342.36) | −0.08 (−0.18–0.03) |
| Southern Sub‐Saharan Africa | 595,214.73 (510,829.96–694,260.73) | 13,451.86 (11,544.76–15,690.30) | 1,241,478.79 (1,040,360.23–1,498,686.10) | 12,752.36 (10,686.49–15,394.37) | −0.34 (−0.42 to −0.27) | 276,505.95 (234,510.77–309,574.77) | 6249.04 (5299.95–6996.39) | 672,900.53 (626,441.05–726,838.81) | 6911.97 (6434.75–7466.02) | 0.23 (−0.25–0.72) | 14,166.01 (11,926.31–15,896.89) | 320.15 (269.53–359.27) | 33,548.20 (30,978.72–36,180.59) | 344.60 (318.21–371.64) | 0.14 (−0.32–0.61) |
| Western Sub‐Saharan Africa | 1,608,084.22 (1,400,564.93–1,841,752.32) | 11,139.79 (9702.23–12,758.50) | 3,757,920.66 (3,222,918.28–4,402,081.07) | 11,691.21 (10,026.77–13,695.25) | 0.18 (0.14–0.22) | 1,320,816.81 (1,137,755.35–1,532,311.01) | 9149.79 (7881.65–10,614.89) | 2,739,612.22 (2,365,469.66–3,156,390.07) | 8523.17 (7359.18–9819.80) | −0.24 (−0.40 to −0.07) | 65,583.05 (56,470.42–75,565.60) | 454.32 (391.19–523.47) | 138,277.81 (120,686.15–157,663.35) | 430.19 (375.46–490.50) | −0.14 (−0.30–0.02) |
- —This study was supported by grants from the Natural Science Foundation of China (Grant No. 82170276) and the Liaoning Provincial Program for Top Discipline of Basic Medical Sciences.
Peer Reviews
No public reviews on file for this paper yet. If you reviewed it on a platform where reviews are public (OpenReview, ICLR, NeurIPS, ICML), you can paste yours below so the community can read it here.
Videos
No videos yet. Explain this paper in a talk, walkthrough, or lecture? Add one.
Taxonomy
TopicsLiver Disease Diagnosis and Treatment · Alcohol Consumption and Health Effects · Diabetes, Cardiovascular Risks, and Lipoproteins
Introduction
1
Ischemic heart disease (IHD), a leading cause of global morbidity and mortality [1], arises from myocardial hypoxia due to insufficient coronary blood flow [2, 3]. Despite advancements in cardiovascular care, IHD remains a critical public health threat, with 9.14 million deaths and 197 million cases reported in 2019 [4]. Concerningly, its burden is rising alongside demographic shifts and lifestyle changes, even as COVID‐19 dominates global health agendas [5].
Although IHD predominantly affects older adults, increasing evidence suggests a trend toward a younger age of onset, with early‐onset IHD incidence increasing in various regions worldwide [6, 7]. The distinct lifestyles and social environments of younger and older individuals likely contribute to differences in their clinical features and prognoses. While previous studies have examined the IHD burden at the national or regional level [1, 3, 8], there remains a significant lack of comparative analyses focusing separately on the epidemiological characteristics and trends in younger and older populations. In particular, critical gaps persist regarding the dynamic changes in disease burden across different age groups, global disparities revealed through stratified analyses, heterogeneity in risk factor‐driven disease patterns, and multidimensional trend predictions. Furthermore, while traditional cardiovascular risk factors such as diabetes and hypertension are well‐established contributors to IHD burden [9, 10], young adults exhibit unique risk profiles compared with their older counterparts. Given these disparities, a systematic and in‐depth analysis of the IHD burden across age groups is imperative. This includes comparative epidemiological assessments and evaluations of age‐specific risk factors to inform targeted and precise prevention strategies. Moreover, given the dynamic shifts in disease patterns, it is essential not only to gain a comprehensive understanding of the current state but also to incorporate forward‐looking projections. In particular, long‐term forecasts over the next 30 years based on different age groups are vital for guiding the allocation of IHD resources and setting healthcare priorities.
Our study aims to analyze global, regional, and national variations in IHD burden from 1990 to 2021 using age‐stratified (20–54 vs. 55+ years) prevalence, mortality, and disability‐adjusted life years (DALYs) metrics via the Global Burden of Disease Study (GBD) database. It evaluates socioeconomic gradients in disease patterns across both age groups, quantifies age‐specific contributions of behavioral and metabolic risk factors to mortality/DALYs, and applies advanced modeling to forecast 30‐year burden trajectories. Findings aim to inform precision public health strategies targeting IHD prevention across life course stages and resource settings.
Methods
2
Study Population and Data Collection
2.1
This study utilized the GBD 2021 database to analyze epidemiological trends in IHD. Age‐specific data on prevalence, mortality, and DALYs were extracted via the Global Health Data Exchange (GHDx) platform. The study population was divided into two age groups: younger adults (20–54 years) and older adults (55+ years), aligning with demographic and clinical relevance in IHD research.
Socio‐Demographic Index (SDI)
2.2
Countries and regions were stratified into five SDI categories (low, low‐middle, middle, high‐middle, high) based on fertility, education, and income metrics [5]. The SDI framework enabled exploration of socioeconomic disparities in IHD burdens between younger and older populations.
Bayesian Age‐Period‐Cohort (BAPC) Analysis
2.3
To project the future burden of IHD, we employed the BAPC model. This model operates under the assumption that the effects of age, period, and cohort on disease incidence are independent yet interact multiplicatively, creating a synergistic effect on disease trends [11]. This assumption allows the model to flexibly capture variations in disease patterns across different age groups, time periods, and cohorts. Projections for the next 30 years were generated using R (version 4.4.1) software.
Statistical Analysis
2.4
Trends in prevalence, mortality, and DALYs (1990–2021) were assessed via estimated annual percentage change (EAPC). EAPC was derived from linear regression of the natural logarithm of rates over time [12], with significance set at a two‐sided p‐value < 0.05. 95% Uncertainty intervals (UIs) were calculated using the 2.5th and 97.5th percentiles of 1000 GBD‐generated estimates. All analyses were performed in R (version 4.4.1).
Ethical Approval and Consent to Participate
2.5
This study received approval from Dalian Medical University's Ethics Committee (Approval No. DMU‐IRB‐2025‐027). Informed consent was waived as all data were anonymized and non‐identifiable.
Results
3
Global Comparative Burden Analysis
3.1
Global estimates revealed a pronounced age disparity in IHD burden in 2021, with significantly higher case numbers, DALYs, and deaths in adults aged ≥ 55 years compared to those aged 20–54 years (Tables 1 and 2).
From 1990 to 2021, IHD prevalence increased in both age groups, but the rise was markedly steeper among younger adults (EAPC = 0.98 [0.93–1.02]) than older adults (EAPC = 0.05 [0.01–0.09]) (Tables 1 and 2, Figure 1). Crucially, despite rising prevalence, mortality and DALY rates declined significantly in both groups. This decline was substantially greater in the older population (mortality EAPC = −0.93 [−1.00 to −0.86]; DALY EAPC = −1.12 [−1.19 to −1.05]) than in the younger population (mortality EAPC = −0.27 [−0.36 to −0.18]; DALY EAPC = −0.31 [−0.40 to −0.22]) (Tables 1 and 2, Figure 1).
Global trends in IHD prevalence, DALY rates, and death rates, 1990–2021. (A) Prevalence in the 20–54‐year age group; (B) DALY rates in the 20–54‐year age group; (C) Death rates in the 20–54‐year age group; (D) Prevalence in the 55+ age group; (E) DALY rates in the 55+ age group; (F) Death rates in the 55+ age group. DALY, disability‐adjusted life year; IHD, ischemic heart disease.
Males consistently exhibited higher prevalence, mortality, and DALY rates than females across both age groups throughout the study period (Figure 1).
Comparative Analysis of Burden Across SDI Regions
3.2
In 2021, middle‐SDI regions globally carried the highest IHD burden among adults aged 20–54 years, demonstrating the highest prevalence, DALYs, and mortality across all SDI categories (Table 1). Temporal trends revealed divergent patterns by SDI level: while high‐SDI regions experienced a slight decline in prevalence (EAPC = −0.04 [−0.12 to 0.05]), all other SDI quintiles exhibited increasing prevalence, with the most pronounced rise observed in middle‐SDI regions (EAPC = 1.63 [1.57–1.68]). Conversely, mortality and DALY rates increased in middle‐ and low‐middle‐SDI regions but declined significantly in high‐SDI regions (Figure 2). Among adults aged ≥ 55 years, middle‐SDI regions similarly bore the greatest disease burden (Table 2). Notably, mortality and DALY rate trends in middle/low‐SDI regions showed opposing patterns compared to younger populations (Figure 2).
EAPC of IHD prevalence, DALY rates, and mortality rates across five SDI regions, 1990–2021. (A) EAPC of prevalence in the 20–54‐year age group; (B) EAPC of DALY rates in the 20–54‐year age group; (C) EAPC of mortality rates in the 20–54‐year age group; (D) EAPC of prevalence in the 55+ age group; (E) EAPC of DALY rates in the 55+ age group; (F) EAPC of mortality rates in the 55+ age group. DALY, disability‐adjusted life year; EAPC, estimated annual percentage change; IHD, ischemic heart disease.
Comparative Analysis Across GBD Regions
3.3
From 1990 to 2021, IHD prevalence increased across most regions in both age groups, with marked regional disparities. East Asia experienced the most pronounced growth among adults aged 20–54 years (EAPC = 2.14 [1.98–2.29]), followed by Southeast Asia (EAPC = 1.34 [1.25–1.42]). Similarly, in those aged ≥ 55 years, East Asia showed the largest increase (EAPC = 0.87 [0.76–0.98]). In sharp contrast, high‐income North America demonstrated significant declines in both age groups (20–54 years: EAPC = −1.39 [−1.63 to −1.15]; ≥ 55 years: EAPC = −2.77 [−3.02 to −2.51])—the steepest reductions globally (Tables 1 and 2, Figure 3).
EAPC of IHD prevalence, DALY rates, and mortality rates across 21 GBD regions, 1990–2021. (A) EAPC of prevalence in the 20–54‐year age group; (B) EAPC of DALY rates in the 20–54‐year age group; (C) EAPC of mortality rates in the 20–54‐year age group; (D) EAPC of prevalence in the 55+ age group; (E) EAPC of DALY rates in the 55+ age group; (F) EAPC of mortality rates in the 55+ age group. DALY, disability‐adjusted life year; EAPC, estimated annual percentage change; GBD, global burden of disease; IHD, ischemic heart disease.
While DALY rates decreased in most regions, East Asia exhibited concerning increases for both younger (EAPC = 0.70 [0.55–0.85]) and older adults (EAPC = 0.94 [0.69–1.20]). In addition, mortality rates attributable to IHD exhibited patterns similar to those of DALY rates across regions and age groups (Tables 1 and 2, Figure 3).
Comparative National Burden Analysis
3.4
Significant national disparities in IHD burden emerged in 2021. Among 20–54‐year‐olds, the United Arab Emirates (UAE) had the highest global prevalence (2785.63/100,000), while Brunei had the lowest (293.76/100,000). For ≥ 55‐year‐olds, Lebanon showed peak prevalence (36,227.41/100,000) while Brunei again had the minimum (3902.13/100,000) (Tables 1 and 2).
Temporally, Northern Mariana Islands led prevalence growth in younger adults (EAPC = 2.97 [2.50–3.44]), contrasting Finland's steepest decline (EAPC = −1.60 [−1.92 to 1.29]). Among older adults, Guam had maximal increase (EAPC = 1.27 [1.19–1.35]) opposed by the United States' sharpest reduction (EAPC = −2.88 [−3.14 to 2.61]) (Figure 4 and Supporting Information S1: Figure S1).
IHD prevalence, DALY rates, and mortality rates across 204 countries and territories in 2021. (A) Prevalence in the 20–54‐year age group; (B) Prevalence in the 55+ age group; (C) DALY rates in the 20–54‐year age group; (D) DALY rates in the 55+ age group; (E) Mortality rates in the 20–54‐year age group; (F) Mortality rates in the 55+ age group. DALY, disability‐adjusted life year; IHD, ischemic heart disease.
Notably, Nauru consistently bore the highest DALY burden across both age groups, with San Marino and South Korea exhibiting the respective lowest rates in younger and older populations. Mortality trends paralleled DALY patterns globally (Figure 4 and Supporting Information S1: Figure S1).
Correlation Analysis With the SDI
3.5
Correlation analyses revealed a paradoxical age‐dependent relationship between SDI and IHD metrics: among adults aged 20–54 years, prevalence increased with SDI (R = 0.20, p < 0.01) whereas mortality decreased (R = −0.08, p < 0.01); conversely, in those ≥ 55 years, prevalence declined with SDI (R = −0.11, p < 0.01) but mortality increased (R = 0.09, p < 0.01). Crucially, DALY rates exhibited consistent inverse correlations with SDI across both age groups (R = −0.11, p < 0.01 each) (Figure 5). Nation‐level analyses of 204 countries validated these regional patterns, though older adult mortality showed a marginally inverse correlation with SDI at finer geographic resolution (Supporting Information S1: Figure S2).
Correlation between SDI and IHD prevalence, DALY rates, and mortality rates in 2021 across 21 GBD regions. (A) Prevalence versus SDI in the 20–54‐year age group; (B) DALY rates versus SDI in the 20–54‐year age group; (C) Mortality rates versus SDI in the 20–54‐year age group; (D) Prevalence versus SDI in the 55+ age group; (E) DALY rates versus SDI in the 55+ age group; (F) Mortality rates versus SDI in the 55+ age group. DALY, disability‐adjusted life year; GBD, global burden of disease; IHD, ischemic heart disease; SDI, socio‐demographic index.
Comparative Analysis of Risk Factors
3.6
The GBD 2021 identified 33 metabolic, environmental, and behavioral risk factors for IHD mortality and DALYs (Supporting Information S2: Table S1 and Supporting Information S3: Table S2). Age‐stratified analyses revealed that adults aged 20–54 years showed heightened susceptibility to tobacco use, high body mass index (BMI), elevated low‐density lipoprotein cholesterol (LDL‐C), and suboptimal diets, whereas those ≥ 55 years were predominantly affected by high blood pressure, elevated fasting plasma glucose, and renal dysfunction (Figure 6). Regionally, high‐SDI areas were characterized by high BMI, elevated fasting plasma glucose, and smoking dominance, contrasting with low‐SDI regions where ambient particulate matter pollution constituted the primary risk driver (Supporting Information S1: Figure S3A–D). Interestingly, we observed that alcohol consumption was inversely associated with the risk of IHD in both younger and older populations (Figure 6).
Global 2021 IHD DALYs and death proportions by risk factors across age groups. (A) DALYs in 20–54 age group; (B) Deaths in 20–54 age group; (C) DALYs in 55+ age group; (D) Deaths in 55+ age group. DALY, disability‐adjusted life year; IHD, ischemic heart disease.
Forecasting Trends Using the BAPC Model
3.7
BAPC model projections indicate that over the next three decades, the mortality rate of IHD among the global population aged 20–54 will steadily decline, reaching approximately 22.92 per 100,000 by 2051, while the prevalence rate in this age group is expected to peak around 2035 at 1033.12 per 100,000 before gradually decreasing. For individuals aged 55 and older, mortality rates will continue their downward trend, hitting about 404.28 per 100,000 by 2051, with prevalence rates maintaining long‐term stability (Figure 7).
Projected global trends in IHD prevalence and death rates from 2021 to 2051 based on the BAPC model. (A) Death trends in the 20–54‐year age group; (B) Prevalence trends in the 20–54‐year age group; (C) Death trends in the 55+ age group; (D) Prevalence trends in the 55+ age group. ASR, age‐standardized rate; BAPC, Bayesian age‐period‐cohort; IHD, ischemic heart disease.
Discussion
4
Our study reveals three pivotal innovations in understanding global IHD burden: the rising prevalence contrasts sharply with the continuing decline in mortality across all age groups; regions with moderate SDI bear the highest absolute disease burden; metabolic and behavioral risk factors are the main drivers among young people, while environmental risk factors have a particularly significant impact in low‐SDI regions. These insights establish a novel, granular analytical framework for decoding the evolving dynamics of the global IHD crisis.
Recent GBD studies have illuminated the profound impact of population aging on IHD trends while projecting future cardiovascular mortality and DALYs through 2050 [13, 14]. However, these macro‐level analyses often overlook age‐specific dynamics, particularly for IHD subtypes. Our findings demonstrate that while mortality and DALYs rates for IHD have declined across all age groups, the prevalence of IHD in young adults aged 20–54 years has exhibited a marked surge since 1990. This increase significantly outpaces the rate observed in individuals aged ≥ 55 years. The reduction in mortality and DALYs rates is largely attributable to widespread adoption of evidence‐based medical practices, including standardized pharmacological therapies, acute myocardial infarction reperfusion techniques, and expanded secondary prevention programs [15, 16]. Conversely, the escalating prevalence among younger populations correlates with deteriorating metabolic risk profiles (e.g., obesity, diabetes, dyslipidemia), sedentary behavioral patterns, and increased psychosocial stressors‐trends that collectively underscore the epidemiological shift toward earlier disease onset [17, 18]. Notably, while age‐specific mortality rates have improved among older adults, the absolute disease burden continues to grow due to global demographic aging. Projections indicate that the proportion of individuals aged ≥ 65 years will double by 2050 [19], creating a dual burden: reduced per‐capita mortality risk coexists with expanding total case numbers driven by the growing elderly population. These findings highlight the urgency for tailored public health strategies: prioritizing primary prevention in younger cohorts through lifestyle interventions while strengthening geriatric care systems to mitigate the compounded effects of aging and comorbidities.
Our study revealed persistent gender disparities in IHD burden across age groups from 1990 to 2021 with males showing higher global prevalence mortality and DALY rates than females suggesting greater susceptibility potentially linked to behavioral factors like higher smoking alcohol consumption and occupational physical strain among men [20] and biological factors including premenopausal estrogen's protective effects on lipid homeostasis and endothelial function reducing women's atherosclerosis risk [21]. These differences highlight the need for sex‐specific prevention and management strategies.
The IHD burden reveals stark regional disparities across SDI quintiles, reflecting deep inequities in risk factor exposure and healthcare access. High‐SDI regions have achieved declines in prevalence, mortality, and DALYs through advanced preventive care, effective risk factor management, and widespread adoption of guideline‐directed therapies—including beta‐blockers, angiotensin‐converting enzyme inhibitors/angiotensin receptor blockers, and novel agents like sodium‐glucose cotransporter‐2 inhibitors—which have transformed heart failure outcomes [22]. Conversely, middle‐SDI regions bear the highest disease burden among younger adults, a trend linked to developmental challenges such as fragmented healthcare systems, workforce shortages, and limited access to modern pharmacological treatments [23]. Older populations in these regions face comparably severe outcomes, exacerbated by underinvestment in revascularization technologies like second‐generation drug‐eluting stents and hybrid procedures, which remain critical but underutilized tools for complex coronary disease [23]. Socioeconomic disparities worsen cardiovascular risks in low‐ and middle‐SDI regions where smoking, obesity, and hypertension hit younger populations hardest [24, 25]—older adults gain limited intervention benefits while younger groups lack prevention, perpetuating early disease and disability. Closing these gaps needs technology transfer from high‐SDI areas and policies targeting root health causes to harmonize progress and counter aging population impacts with persistent risks.
Across 21 GBD regions, the majority showed declines in mortality and DALYs, with Central Europe (younger) and Australasia (older) leading—a testament to high‐income regions' healthcare advancements [26]. Conversely, East Asia saw starkest rises in prevalence, especially among elders, fueled by aging demographics, prolonged lifespans, and lifestyle shifts, underscoring the urgency of tailored interventions for aging societies [27]. Nationally, the UAE, Lebanon, and Nauru ranked highest in IHD burden, while Brunei, San Marino, and South Korea held the lowest. Lebanon's elderly surge may be linked to conflict‐disrupted care [28]; the UAE's youth‐driven trends may be tied to urbanization and metabolic risks [29]. Such disparities highlight the necessity for country‐specific policies that address unique epidemiological, geopolitical, and socioeconomic drivers.
Our analysis highlights distinct risk factor profiles for IHD across age groups, driving disparities in disease burden. Among younger populations, high LDL‐C emerges as the dominant risk factor, contributing to over half of IHD‐related deaths (52.74%) and DALYs (52.56%), with 3.81 million cardiovascular deaths globally linked to elevated LDL‐C in 2021 [30]. This underscores the critical role of lipid management in mitigating young adult cardiovascular risk, aligning with evidence that LDL‐C control substantially reduces disease incidence [31]. In contrast, older populations face escalating burdens from high systolic blood pressure, which affected 4.06 billion individuals by 2019 and accounted for 76.65 million DALYs and 4.3 million deaths, exacerbated by comorbid diabetes and kidney disease [4]. Geographically, risk factor prevalence mirrors socioeconomic gradients: high‐SDI regions grapple with tobacco and diet‐driven risks, while low‐SDI areas confront environmental challenges like air pollution. Paradoxically, alcohol intake exhibited a consistent inverse association with IHD risk across ages, reflecting a potential “J‐shaped” dose–response pattern where moderate consumption may confer protection compared to abstention or heavy use [32, 33]. These findings emphasize the need for age‐ and context‐specific strategies to address modifiable risks, from lipid control in youth to hypertension management in aging societies, while leveraging regional insights to tailor interventions.
Our findings indicate global IHD mortality will decline for all age groups over the next 30 years due to medical advances and prevention efforts [34, 35, 36, 37], though younger populations will see initial prevalence increases until 2035 from unhealthy lifestyles that health education may reverse, while older groups will maintain stable prevalence as aging effects counterbalance healthcare gains [19]. Future age‐specific healthcare planning will be essential to manage IHD burdens.
This study has several limitations. First, it relies on multiple data sources, which may vary in quality and coverage, particularly in low‐ and middle‐income countries, potentially introducing biases. To mitigate this, we strictly adhered to GBD standardized data processing protocols and incorporated UIs for all estimates to quantify potential variability. Second, while the GBD database is regularly updated, it may not fully capture rapidly changing factors such as socioeconomic shifts or public health crises, including the COVID‐19 pandemic. We therefore limited our analysis to the 1990–2021 period to avoid pandemic‐related trend distortions. Third, the lack of detailed subcategorization of IHD (e.g., myocardial infarction, angina, or heart failure) in the GBD database limits the ability to distinguish acute from chronic presentations. As partial compensation, we will validate the consistency of this key trend through clinical literature in the future. Despite these limitations, our findings provide valuable insights into the global burden of IHD, emphasizing the need for adaptive public health strategies tailored to evolving demographic and regional characteristics.
Conclusions
5
Over the past three decades global IHD prevalence has risen across age groups while mortality and DALY rates declined with persistent disparities by age gender SDI region and country—future policies should prioritize age‐specific hypertension management lifestyle changes environmental improvements and targeted resource allocation in low‐middle‐income countries to reduce IHD burden and enhance global health outcomes.
Author Contributions
Yemin Wang: writing – original draft, data curation, formal analysis. Jing Li: investigation, validation. Hazrat Bilal: conceptualization, software. Xiao Yu: writing – review and editing, funding acquisition. Lei Sun: writing – review and editing, supervision, resources. All authors have read and approved the final version of the manuscript.
Conflicts of Interest
The authors declare no conflicts of interest.
Transparency Statement
The lead authors, Xiao Yu and Lei Sun, affirm that this manuscript is an honest, accurate, and transparent account of the study being reported; that no important aspects of the study have been omitted; and that any discrepancies from the study as planned (and, if relevant, registered) have been explained.
Supporting information
Supplementary File 2. Figure S1: EAPC of IHD prevalence, DALY rates, and death rates across 204 countries and territories, 1990‐2021. Figure S2: Correlation between SDI and IHD prevalence, DALY rates, and death rates in 2021 across 204 countries and territories. Figure S3: Proportion of IHD DALYs and deaths attributable to risk factors in the five SDI regions.
Supplementary File 2.
Table S1: Proportion of DALYs and deaths due to major risk factors in people aged 20‐54 years by SDI region, 2021.
Table S2: Proportion of DALYs and deaths due to major risk factors in people aged 55+ years by SDI region, 2021.
The reference list from the paper itself. Each links out to its DOI / PubMed record.
- 1M. A. Khan , M. J. Hashim , H. Mustafa , et al., “Global Epidemiology of Ischemic Heart Disease: Results From the Global Burden of Disease Study,” Cureus 12, no. 7 (2020): e 9349.32742886 10.7759/cureus.9349 PMC 7384703 · doi ↗ · pubmed ↗
- 2P. H. Stone , P. Libby , and W. E. Boden , “Fundamental Pathobiology of Coronary Atherosclerosis and Clinical Implications for Chronic Ischemic Heart Disease Management—The Plaque Hypothesis: A Narrative Review,” JAMA Cardiology 8, no. 2 (2023): 192–201.36515941 10.1001/jamacardio.2022.3926 PMC 11016334 · doi ↗ · pubmed ↗
- 3C. Guan , S. Wu , W. Xu , and J. Zhang , “Global, Regional, and National Burden of Ischaemic Heart Disease and Its Trends, 1990–2019,” Public Health 223 (2023): 57–66.37604031 10.1016/j.puhe.2023.07.010 · doi ↗ · pubmed ↗
- 4G. A. Roth , G. A. Mensah , C. O. Johnson , et al., “Global Burden of Cardiovascular Diseases and Risk Factors, 1990–2019,” Journal of the American College of Cardiology 76, no. 25 (2020): 2982–3021.33309175 10.1016/j.jacc.2020.11.010PMC 7755038 · doi ↗ · pubmed ↗
- 5GBD 2021 Diseases and Injuries Collaborators , “Global Incidence, Prevalence, Years Lived With Disability (YL Ds), Disability‐Adjusted Life‐Years (DAL Ys), and Healthy Life Expectancy (HALE) for 371 Diseases and Injuries in 204 Countries and Territories and 811 Subnational Locations, 1990–2021: A Systematic Analysis for the Global Burden of Disease Study 2021,” Lancet 403, no. 10440 (2024): 2133–2161.10.1016/S 0140-6736(24)00757-8PMC 1112211138642570 · doi ↗ · pubmed ↗
- 6S. Arora , G. A. Stouffer , A. M. Kucharska‐Newton , et al., “Twenty Year Trends and Sex Differences in Young Adults Hospitalized With Acute Myocardial Infarction,” Circulation 139, no. 8 (2019): 1047–1056.30586725 10.1161/CIRCULATIONAHA.118.037137 PMC 6380926 · doi ↗ · pubmed ↗
- 7J. P. Collet , M. Zeitouni , N. Procopi , et al., “Long‐Term Evolution of Premature Coronary Artery Disease,” Journal of the American College of Cardiology 74, no. 15 (2019): 1868–1878.31601367 10.1016/j.jacc.2019.08.1002 · doi ↗ · pubmed ↗
- 8F. Wang , Y. Yu , S. Mubarik , et al., “Global Burden of Ischemic Heart Disease and Attributable Risk Factors, 1990–2017: A Secondary Analysis Based on the Global Burden of Disease Study 2017,” Clinical Epidemiology 13 (2021): 859–870.34584461 10.2147/CLEP.S 317787 PMC 8464307 · doi ↗ · pubmed ↗