Diagnostic Performance of Prostate Cancer Disease‐Specific Phenotypes Identified Using Real‐World Databases: A Systematic Review
Ami Vyas, Shweta Kamat, Sadie Thomas, Connor Gambino, Britny R. Brown, Amit D. Raval

TL;DR
This paper reviews how well different prostate cancer phenotypes can be identified using real-world data, showing that some methods are accurate but more validation is needed.
Contribution
The study systematically summarizes the diagnostic accuracy of prostate cancer phenotypes using real-world databases.
Findings
Prediction models for metastasis and bone metastasis show high accuracy with AUC > 0.7 and specificity above 90%.
Claims-based algorithms for biochemical recurrence have low sensitivity but high specificity.
Further validation is needed for phenotypes as therapeutic options for prostate cancer evolve.
Abstract
Research using real‐world databases (RWD) often requires the development of computable phenotypes based on clinical reasoning‐based algorithms or prediction models with validation through a reference standard such as chart review. While there are studies reporting different phenotypes for key prostate cancer (PC) disease or outcomes, these have not been summarized systematically. To conduct a systematic review (SR) to summarize validation statistics on PC‐specific phenotypes, including metastasis, biochemical recurrence (BCR), castration‐resistant prostate cancer (CRPC), hormone‐sensitive prostate cancer (HSPC), progression‐free survival, and performance status. We conducted a SR in accordance with the Preferred Reporting Items for Systematic Reviews and Meta‐Analysis of Diagnostic Test Accuracy Studies guidelines. We systematically searched PubMed/Medline and EMBASE for studies…
Genes, proteins, chemicals, diseases, species, mutations and cell lines named across the full text — each resolved to its canonical identifier and authoritative record.
Click any figure to enlarge with its caption.
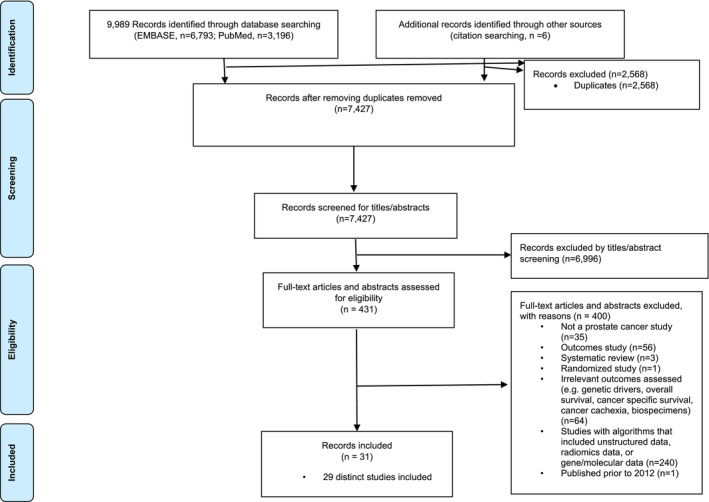 FIGURE 1
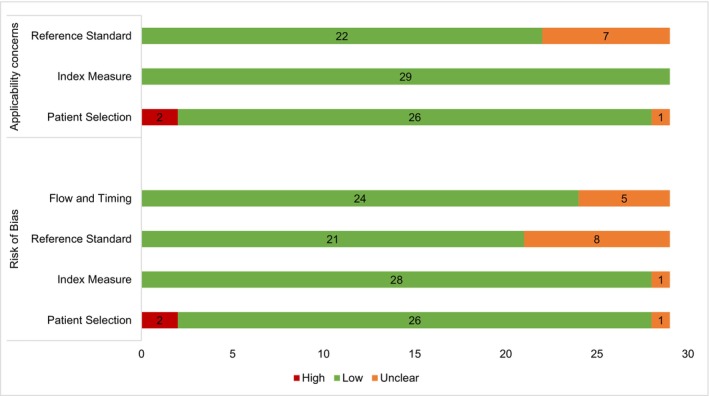 FIGURE 2
| Phenotypes | Author, year of publication | RWD type | Source | Country | Study period | Cohort size |
|---|---|---|---|---|---|---|
| BCR | Abdul et al. (2019) | EMR/Registry | Radiation Oncology Cancer Registry | Singapore | 1998–2010 | 549 |
| BCR | Hu et al. (2014) | EMR | NR | Germany | 1999–2007 | 1575 |
| BCR | Vincini et al. (2023) | EMR | IEO European Institute of Oncology | Italy | 2015–2018 | 949 |
| BCR | Hassett et al. (2014) | Claims | HMO/CRN | USA | 2000–2005 | 1151 |
| BCR | Danciu et al. (2022) | EMR | VHA | USA | 2002–2017 | 118 788 |
| BCR, M1 | Leapman et al. (2023) | EMR‐Claims | Decipher genomic classifier‐Clarivate | USA | 2013–2022 | 92 976 |
| BCR, DM | Xiang et al. (2021) | EMR; Registry | iv. Multicountry EMR, ev. SEER and NCD | Multicountry | 1995–2018 | iv. 5275, ev. 23 989, 88 909 |
| M1 | Alba et al. (2021) | EMR | VHA | USA | 2000–2020 | 1 144 610 |
| M1 | Dolan et al. (2012) | EMR | Robert Wood Johnson University Hospital | USA | 1986–2007 | 292 |
| M1 | Nordstrom et al. (2012) | EMR‐Claims | EMR‐SDI Health | USA | 2004–2010 | 267 |
| M1 | Preisser et al. (2020) | Registry | SEER | USA | 2010–2014 | 201 224 |
| M1 | Shui et al. (2022) | EMR | VHA | USA | 2012–2017 | 722 |
| M1 | Thomsen et al. (2020) | Registry | Prostate Cancer Registry | Sweden | 2006–2016 | 102 076 |
| M1 | Yang et al. (2022) | EMR | VHA | USA | NR | 6211 |
| M1, DM, BM | Ehrenstein et al. (2015) | Registry | Danish Registry | Denmark | 2005–2010 | 212 |
| BM | Bai et al. (2021) | EMR | NR | China | 2014–2019 | 332 |
| BM | Dong et al. (2022) | Registry‐Claims | SEER‐Medicare | USA | 2010–2015 | 132 601 |
| BM | Liu et al. (2021) |
Registry; EMR | iv. SEER database, ev. Nanchung University EMR | USA, China | 2010–2017 | iv. 207 137, ev. 644 |
| BM | Onukwugha et al. (2014) | Registry‐Claims | SEER‐Medicare | USA | 2005–2007 | 2708 |
| BM | Sathiakumar et al. (2017) | Claims | Medicare | USA | 2005–2006 | 835 |
| LNM | Jeong et al. (2012) | EMR | Seoul National University Hospital | Korea | 1993–2009 | 2129 |
| LNM | Sabbagh et al. (2023) | EMR | iv. University Medical Center Hamburg, ev. University of California‐San Francisco | USA, Germany | 1990–2020 | iv. 20 267, ev. 1322 |
|
mHSPC, mCRPC | Freedland et al. (2021) | Claims | Optum; Medicare | USA | 2014–2019 | 21 675, 90 284 |
| mCRPC | Thurin et al. (2021) | EMR | French Nationwide | France | 2009–2014 | 386 127 |
| mHSPC, mCRPC, nmHSPC, nmCRPC | Du et al. (2020) | EMR, Claims | Optum | USA | 2007–2018 | 125 505, 51 299 |
| nmCRPC | Arnold et al. (2019) | EMR | SAIL | Wales | 2000–2015 | 38 021 |
| nmCRPC | Malone et al. (2022) | Claims | Ontario Health Services, Alberta Health Services | Canada | 2008–2019 | 866 |
| PS/HS/DS | Davidoff et al. (2013) | Survey‐Claims | MCBS‐Medicare | USA | 2001, 2003, 2005 | 14 788 |
| PS | Sheffield et al. (2018) | EMR‐Claims | EMR‐MarketScan | USA | 2007–2015 | 8442 |
| Study ID | Condition (ICD‐9) | Condition (ICD‐10) | Medications | Procedures | Sensitivity % (95% CI) | Specificity % (95% CI) | PPV % (95% CI) | AUC % (95% CI) | Reference method |
|---|---|---|---|---|---|---|---|---|---|
| Claims‐based algorithms | |||||||||
| C | |||||||||
| Hassett (2014) | 197–198.82 | — | — | — | 10 (5–19) | 98 (96–98) | 31 | — | CR |
| Leapman (2023) | — | R97.21 | — | — | — | — | — | 96 | Decipher test |
| C or M | |||||||||
| Hassett (2014) | 197–198.82 | — | Chemo | Chemo | 19 (12–30) | 83 (80–86) | 11 | — | CR |
| M | |||||||||
| Hassett (2014) | — | — | Chemo | Chemo | 3 (1–9) | 98 (97–99) | 13 | — | CR |
| Prediction‐based models | |||||||||
| Type of prediction‐based model (predictors) | |||||||||
| Hu (2014) | (GS) | 9 (7–11) | — | 72 (68–75) | PSA values | ||||
| Hu (2014) | (PSA) | 19 (17–21) | — | 62 (58–66) | PSA values | ||||
| Hu (2014) | ANN (Age, PSA, % free PSA, prostate weight, DRE status, pathological stage, margin status, GS) | — | 35 (33–38) | — | 75 (72–79) | PSA values | |||
| Hu (2014) | LR (Age, PSA, % free PSA, prostate weight, DRE status, pathological stage, margin status, GS) | — | 37 (34–39) | — | 75 (72–79) | PSA values | |||
| Danciu (2022) | ML (Age, race, ethnicity, GS, AJCC stage group, SEER summary stage, computed stage value, PSA, the penultimate PSA over the last 5 years, and their rate of change) | — | — | — | 76 (76–76) | NR | |||
| Vincini (2023) | GBDT (Age, comorbidities, risk class, PSA, T‐stage, N‐stage, preoperative GS and ISUP) | — | — | — | 59 | NR | |||
| Abdul (2019) | NP (PSA, T‐stage, N‐stage, GS [primary, secondary, total]) | — | — | — | — | NR | |||
| Xiang (2021) | NP (PSA, biopsy GGG, % positive cores, T‐stage) | — | — | — | 63 (61–65) | CR | |||
| Study ID | Condition (ICD‐9 or 10) | Medications | Laboratory | Procedures | Sensitivity % (95% CI) | Specificity % (95% CI) | PPV % (95% CI) | AUC % (95% CI) | Reference method |
|---|---|---|---|---|---|---|---|---|---|
| Any metastasis | |||||||||
| Claims‐based algorithms | |||||||||
| C | |||||||||
| Dolan (2012) | 197.0, 197.7, 198.3, OR 198.5 | — | — | — | 95 (80–96) | 100 (98–100) | 100 (94–100) | — | CR |
| Dolan (2012) | 198.5 | — | — | — | 90 (80–96) | 100 (98–100) | 100 (94–100) | — | CR |
| Alba (2021) | (198.1, 198.5, 196.5, 196.6) OR (C79.11, C79.51, C79.52, C77.4, C77.5) | — | — | — | 81 | 95 | 88 | — | CR |
| Yang (2022) |
(196.x, 197.x, 198.x, 199.x) OR (C77.x, C78.x, C79.xx, C7B.0x, C7B.1, C7B.8) | — | — | — | 73 | 86 | 78 | — | RR |
| Shui (2022) |
| — | — | — | 73 (66–79) | 92 (89–94) | 79 | — | CR |
| Leapman (2023) |
| — | — | — | NR | NR | NR | 95 | Decipher test |
| C or M | |||||||||
| Alba (2021) | (198.1, 198.5, 196.5, 196.6) OR (C79.11, C79.51, C79.52, C77.4, C77.5) | ARPI | — | — | 90 | 92 | 93 | — | CR |
| Nordstrom (2012) | 197.xx‐198.xx, 199.xx | ARPI, CHEMO, BHA | — | — | 81 | 75 | 86 | 82 | EMR |
| Shui (2022) |
| Metastatic PC drugs | — | — | 80 (74–86) | 89 (86–91) | 75 | — | CR |
| M | |||||||||
| Alba (2021) | — | ARPI | — | — | 60 | 100 | 78 | — | CR |
| C + L | |||||||||
| Ehrenstein (2015) | C77‐C79 | — | PSA > 50 ng/mL | — | NR | NR | 16 (6–32) | — | CR |
| C + L + | |||||||||
| Ehrenstein (2015) | C77‐C79 | — | PSA > 50 ng/mL | BSc | NR | NR | 28 (14–47) | — | CR |
| C + L+(M or P) | |||||||||
| Ehrenstein (2015) | C77‐C79 | BHA | PSA > 50 ng/mL | BSc | NR | NR | 15 (6–30) | — | CR |
| Prediction‐based models | |||||||||
| Type of prediction‐based model (predictors) | |||||||||
| Preisser (2020) | LR (GGG, PSA, tumor stage) | — | — | — | 94 (94–94) | DR | |||
| Thomsen (2020) | Age, year, mode of detection, TNM, PSA, T‐stage, GGG, primary treatment, CCI, education, marital status | — | — | — | 88 | DR | |||
| Bone metastasis | |||||||||
| Claims‐based algorithms | |||||||||
| C | |||||||||
| Onukwugha (2014) | 198.5 | — | — | — | 60 (57–62) | 54 (51–57) | 68 (66–71) | — | DR |
| C+(M or P) | |||||||||
| Onukwugha (2014) | 198.5 | BHA | — | BSc, BB | 56 (53–58) | 58 (55–61) | 69 (67–72) | — | DR |
| C + | |||||||||
| Sathiakumar (2017) | 198.5 | — | — | BM‐related procedures | 92 (78–97) | 99 (96–100) | 92 (78–97) | — | CR |
| C + L | |||||||||
| Ehrenstein (2015) | C77‐C79 | — | PSA > 50 ng/mL | — | NR | NR | 11 (3–25) | — | CR |
| C + L + | |||||||||
| Ehrenstein (2015) | C77‐C79 | — | PSA > 50 ng/mL | BSc | NR | NR | 9 (2–25) | — | CR |
| C + L+(M or P) | |||||||||
| Ehrenstein (2015) | C77‐C79 | BHA | PSA > 50 ng/mL | BSc | NR | NR | 5 (1–17) | — | CR |
| Prediction‐based models | |||||||||
| Type of prediction‐based model (predictors) | |||||||||
| Bai (2021) | NP (Age, tumor stage, PSA, GS, prostate volume, red cell distribution width, SAP, neutrophil/lymphocyte %) | — | — | — | 96 (93–98) | Bone Scan/MRI | |||
| Dong (2022) | NP (Age, race, marital status, grade, PSA, ISUP, T‐stage, N‐stage, brain/liver/lung metastasis) | — | — | — | 95 | DR | |||
| Liu (2021) | ML‐XGB (Age, race, grade, PSA, GS, T‐stage, N‐stage, marital status) |
91 91 |
88 88 | — |
96 96 | DR | |||
| Liu (2021) | ML‐DT (Age, race, grade, PSA, GS, T‐stage, N‐stage, marital status) |
88 85 |
83 88 | — |
94 94 | DR | |||
| Liu (2021) | ML‐RF (Age, race, grade, PSA, GS, T‐stage, N‐stage, marital status) |
90 88 |
88 87 | — |
95 95 | DR | |||
| Liu (2021) | ML‐MLP (Age, race, grade, PSA, GS, T‐stage, N‐stage, marital status) |
90 91 |
88 87 | — |
95 95 | DR | |||
| Liu (2021) | ML‐LR (Age, race, grade, PSA, GS, T‐stage, N‐stage, marital status) |
87 87 |
85 85 | — |
90 91 | DR | |||
| Liu (2021) | ML‐NBC (Age, race, grade, PSA, GS, T‐stage, N‐stage, marital status) |
89 91 |
88 86 | — |
94 93 | DR | |||
| Lymph node metastasis | |||||||||
| Prediction‐based models | |||||||||
| Type of prediction‐based model (predictors) | |||||||||
| Jeong (2012) | NP (PSA, stage, GS, % positive cores) |
84 97 | PA | ||||||
| Sabbagh (2023) | ML‐SLR (Age, PSA, T‐stage, % positive cores, primary and secondary GS) | — | — | — |
81 (80–82) 81 | NR | |||
| Sabbagh (2023) | ML‐LRE (Age, PSA, T‐stage, % positive cores, primary and secondary GS) | — | — | — |
81 (80–82) 81 | NR | |||
| Sabbagh (2023) | ML‐XGB (Age, PSA, T‐stage, % positive cores, primary and secondary GS) | — | — | — |
82 (81–83) 82 | NR | |||
| Distant metastasis | |||||||||
| Claims‐based algorithms | |||||||||
| C + L | |||||||||
| Ehrenstein (2015) | C77‐C79 | — | PSA > 50 ng/mL | — | NR | NR | 5 (1–18) | — | CR |
| C + L + | |||||||||
| Ehrenstein (2015) | C77‐C79 | — | PSA > 50 ng/mL | BSc | NR | NR | 19 (7–36) | — | CR |
| C + L+(M or P) | |||||||||
| Ehrenstein (2015) | C77‐C79 | BHA | PSA > 50 ng/mL | BSc | NR | NR | 10 (3–24) | — | CR |
| Prediction‐based models | |||||||||
| Type of prediction‐based model (predictors) | |||||||||
| Xiang (2021) | NP (PSA, GGG, % positive cores, T‐stage) | — | — | — | 69 (66–71) | EMR | |||
| Study ID | Criteria | Condition (ICD‐9 or 10) | Medications | Laboratory | Procedures | Sensitivity (95% CI) | Specificity (95% CI) | PPV (95% CI) | % with Outcomes | Reference method |
|---|---|---|---|---|---|---|---|---|---|---|
| Metastatic castration‐resistant prostate cancer | ||||||||||
| Freedland (2021) | Criteria 1: C, | Z19.2 | — | — | — | NR | NR | NR |
Optum: 12%; Medicare: 13% | NR |
| Criteria 2: | — | — | Rise in PSA after SC | SC | ||||||
| Criteria 3: | Z19.2 after SC | — | — | SC | ||||||
| Criteria 4: M + L, | — | MC (≥ 90 days of ADT) | Rise in PSA during MC | — | ||||||
| Criteria 5: M + C, | R97.21 during MC | MC (≥ 90 days of ADT) | — | — | ||||||
| Criteria 6: | First metastases post 90 days of SC | — | — | SC | ||||||
| Criteria 7: M + C, | First metastases post 90 days of MC | MC (≥ 90 days of ADT) | — | — | ||||||
| Criteria 8: M | — | mCRPC medications only | — | — | ||||||
| Du (2020) | Criteria 1: (C + (M or P)) | PC diagnosis | MC | — | SC |
Optum EMR: 3%; Optum claims: 2% | NR | |||
| Criteria 2: (C or M or L) | Z19.2 post‐PC diagnosis | New ARPI initiation | Rise in PSA after SC/MC | — | ||||||
| Thurin (2021) | Criteria 1: (C or M or P) | C77, C78, C79 | (BHA) or (mCRPC prescription 90 days post‐ADT) | — | RT | 77% | 100% | 97% (93%–100%) | — | CR |
| Criteria 2: (M or P) | — | ADT and CRPC/mCRPC prescriptions post 90 days of PC diagnosis | — | SC | ||||||
| Nonmetastatic castration‐resistant prostate cancer | ||||||||||
| Du (2020) | Criteria 1: (M or P) | — | MC | — | SC | — | — | — |
Optum EMR: 10%; Optum claims: 34% | NR |
| Criteria 2: (C or M or L) | Z19.2 post‐SC/MC | New ARPI Initiation post‐SC/MC | Rise in PSA after SC/MC | — | ||||||
| Arnold (2019) | C or M or P or L | No metastases | ADT | PSA results | No metastases | — | — | — | 4% (3%–4%) | NR |
| Malone (2022) | (M or P) + L | — | 1 year of ADT use | PSA < 20 ng/mL within 90 days prior to ADT initiation | SC | 53% | 80% | 36% | — | CR |
| Malone (2022) | M + L | — | 1 year of ADT use | PSA < 20 ng/mL within 90 days prior to ADT initiation | — | 61% | 68% | 28% | — | CR |
| Malone (2022) | (M or P) + L | — | ADT use | PSA < 20 ng/mL within 90 days prior to ADT initiation | SC | 57% | 70% | 28% | — | CR |
| Metastatic hormone‐sensitive prostate cancer | ||||||||||
| Freedland (2021) | Criteria 1: (C or M or L or P) | No evidence of CRes premetastasis | No evidence of CRes premetastases | No evidence of CRes premetastases | No evidence of CRes premetastases | — | — | — |
Optum: 32%; Medicare: 22% | NR |
| Criteria 2: C or ( | Z19.1 within 12 months premetastasis | MC (≥ 90 days of ADT prior to metastasis) | ≥ 2 PSA rise results following SC/MC and within 12 months premetastasis | SC | ||||||
| Du (2020) | C + M | First metastasis between PC and ADT | ADT use post‐PC diagnosis | — | — | — | — | — |
Optum EMR: 1%; Optum claims: 2% | NR |
| Nonmetastatic hormone‐sensitive prostate cancer | ||||||||||
| Du (2020) | C + M + L + | No metastasis between PC and ADT | ADT use post‐PC | No rise in PSA | No metastasis | — | — | — |
Optum EMR: 3%; Optum claims: 30% | NR |
- —Bayer HealthCare Pharmaceuticals Inc.
Peer Reviews
No public reviews on file for this paper yet. If you reviewed it on a platform where reviews are public (OpenReview, ICLR, NeurIPS, ICML), you can paste yours below so the community can read it here.
Videos
No videos yet. Explain this paper in a talk, walkthrough, or lecture? Add one.
Taxonomy
TopicsProstate Cancer Treatment and Research · Prostate Cancer Diagnosis and Treatment · Cancer, Lipids, and Metabolism
Summary
- Information in real‐world databases cannot directly identify complex clinical constructs, especially in oncology.
- This is first comprehensive review that assessed the validity of algorithms for prostate cancer phenotypes in real‐world databases.
- We identified the acceptable diagnostic performance of several prostate cancer specific disease outcomes including metastasis, biochemical recurrence, and performance status, identified from the real‐world databases.
- Our study helps researchers who utilize large databases to identify patients with prostate cancer with specific outcomes or key characteristics from the real‐world databases.
Introduction
1
Real‐world databases (RWD) represent an enormous opportunity to conduct epidemiology and outcomes research studies. Administrative claims and electronic health/medical records (EMR) are the most common sources of RWD. However, claims/EMR are healthcare by‐products of transactional data generated for billing and reimbursement purposes, and hence, epidemiological research often encounters several challenges in accurately identifying complex clinical constructs using RWD. Much of the coded and structured information in RWD cannot directly identify complex clinical constructs, especially in oncology. Phenotypes are developed using clinical rationale or advanced machine‐learning or prediction models. However, it is essential to establish the validity of phenotypes compared to the gold standard measure in epidemiology research.
Prostate cancer (PC) is the most commonly occurring cancer in the United States (US) men [1] and the second most commonly occurring cancer in men worldwide [2]. Using RWD to identify the disease population across the continuum of PC care can be challenging. For example, most newly diagnosed cases present with localized stages managed through primary therapy of either active surveillance/watchful waiting, surgery (radical prostatectomy), or radiation therapy with or without adjuvant androgen deprivation therapy (ADT) [3]. Over time, men with localized PC may progress to biochemical recurrence (BCR) state, which is characterized by a rise in prostate‐specific antigen (PSA) level after primary therapy. Medical castration or surgical castration is one of the mainstay therapies for BCR. Many of those with BCR may stop responding to ADT (called castration‐resistant PC [CRPC]), or spread outside the prostate gland (metastases). Metastatic PC where the cancer spreads outside the prostate gland but still responds to ADT is considered metastatic hormone‐sensitive PC (mHSPC); conversely, a state where cancer cells spread outside the prostate gland and no longer respond to ADT is considered metastatic CRPC (mCRPC). RWD do not either have direct diagnosis codes to denote these disease states or codes that are not consistently utilized. Phenotypes could be developed using clinical reasoning‐based criteria/algorithm or a prediction model with a gold standard measure for such complex measures.
Several studies have been conducted to validate the criteria of assessing metastasis [4], BCR [5], CRPC [6], and functional status [7, 8] in patients with PC using RWD. However, studies on specific algorithms, criteria, and measures of PC‐specific disease population and outcomes in RWD have not been systematically summarized. We conducted a systematic review to summarize and report key validation statistics on phenotypes available for key characteristics of PC including metastasis, mCRPC, nmCRPC mHSPC, BCR, and functional status/performance status.
Methods
2
This systematic review was performed in accordance with the Preferred Reporting Items for Systematic Reviews and Meta‐Analysis of Diagnostic Test Accuracy (PRISMA‐DTA) Studies guidelines [9].
Inclusion Criteria for the Systematic Review
2.1
Studies eligible for inclusion were real‐world (RW) observational studies published in English. The PIRD (population, index test, reference test, and diagnosis of interest) criteria used to determine study eligibility identified studies for inclusion if they included patients with PC, had an index measure or an algorithm/model used to identify at least one of the relevant key PC characteristics or outcomes, and, if available, had a reference standard to compare with the index measure. Studies that reported the development and validation of machine‐learning methods or nomogram prediction models that did not have a reference standard were also eligible, as such studies could provide important RWD‐based predictive models used to identify patients with disease phenotypes. Some studies that assessed the validity of functional status/performance status included the entire cancer population. These studies were also considered eligible for inclusion due to the ease of application of claims‐based indicators of functional status/performance status in the PC population and the unavailability of studies specific to the PC population.
Systematic Literature Search
2.2
We conducted a systematic search of RW studies in EMBASE and PubMed using a combination of keywords for prostate cancer, cancer, real‐world evidence, and each diagnosis of interest, from 2012 through October 2023 (Table S1). References of included studies and relevant systematic reviews were also searched.
Study Selection, Data Extraction, and Study Quality Assessment
2.3
Two reviewers (A.V., S.K.) screened the titles and abstracts of studies independently to determine eligibility for the full‐text review and then examined full‐text reports. Disagreements were resolved through discussion and/or by the third reviewer (B.B.).
Two reviewers (S.T., C.G.) extracted data from the included studies, and the third reviewer (A.V.) performed a quality check and resolved discrepancies. Data on study characteristics, patient population, and each diagnosis of interest, including the measure type, specific index measure/algorithm, sensitivity, specificity, and predictive values, along with 95% confidence intervals, C‐statistic, and area under the curve (AUC) statistic were extracted.
One reviewer (A.V.) appraised the risk of bias and applicability of eligible studies using version 2 of the Quality Assessment of Diagnostic Accuracy Studies (QUADAS‐2) tool [10] as per the recommendation of the PRISMA 2020 guideline [11]. Two reviewers (S.T., C.G.) independently validated data by performing the quality check of data on the study quality assessment to ensure that decisions were not solely reliant on one reviewer and hence reduced the risk of error.
Results
3
Out of 7427 retrieved records, 29 unique studies [4, 5, 6, 7, 8, 12, 13, 14, 15, 16, 17, 18, 19, 20, 21, 22, 23, 24, 25, 26, 27, 28, 29, 30, 31, 32, 33, 34, 35] (31 citations) met the inclusion criteria (Figure 1).
Preferred reporting items for systematic reviews and meta‐analysis (PRIMSA) flow diagram for study selection.
Study Characteristics and Patient Characteristics
3.1
All studies were retrospective studies, with several including US RWD (n = 18) (Table 1). Twenty‐three studies were full publications, while six studies were conference proceedings only. The patient sample size ranged from 212 to 1 144 610. Nineteen studies utilized at least an EMR or EMR linked to administrative claims data, while six studies used disease registry data, two studies used disease registry data linked to administrative claims data, and four studies used only administrative claims data.
Overall, the majority of studies included patients diagnosed with PC, with additional inclusion criteria used in several studies (Table S2). For instance, the Hu et al. study, which assessed the diagnostic accuracy of BCR, included patients with PC who underwent laparoscopic radical prostatectomy [21].
BCR
3.2
Seven studies assessed BCR phenotype [5, 12, 16, 21, 23, 33, 34] (Tables 2 and S3). Two studies that reported only ICD‐9/10 diagnosis code‐based definitions of BCR [5, 23] showed that such BCR definitions resulted in high specificity (98%) [5] or AUC value (96%) [23] when compared with the chart review or Decipher test, but low sensitivity (10%) and low positive predictive value (PPV) (31%) [5]. Hassett et al. added a criterion for chemotherapy initiation in addition to ICD‐9 codes, which led to an increase in sensitivity (19%); however, specificity (83%) and PPV (13%) declined when compared to the chart review [5].
Five studies reported the diagnosed accuracy of model‐based prediction for BCR. One study used artificial neural network and logistic regression (LR) prediction models with age and tumor characteristics and reported a specificity of 35% at a sensitivity value of 90%, with AUCs of 75% for both models [21] when compared to PSA values reported in the data, while another study used a machine‐learning model with tumor characteristics and demographic factors and reported an AUC of 76% (95% CI: 76%–76%) [16]. Yet another study used a nomogram prediction model with tumor characteristics and reported an AUC of 63.0% (95% CI: 61.0%–65.0%) [34], while Vincini et al. used a Gradient‐boosted decision tree model with clinical variables and tumor characteristics and reported an AUC of 59.0% [33].
PC Metastasis
3.3
Any Metastasis
3.3.1
Nine studies [4, 13, 17, 20, 23, 27, 30, 31, 35] assessed the metastasis phenotype (Tables 3 and S4). Four studies [13, 17, 30, 35] used only ICD‐9/10 diagnosis code‐based definitions of metastasis, which reported a high sensitivity in the range of 73% [30, 35] to 95% [17], a high specificity of 92% [30] to 100% [17], and also a high PPV of 78% [35] to 100% [17]. Alba et al. added a criterion for androgen receptor pathway inhibitors (ARPI) along with ICD‐9/10 codes, resulting in an increase in sensitivity from 81% to 90% but a slight decline in specificity from 95% to 92% [13]. Two studies that used a combination of ICD‐9/10 codes with ARPI, chemotherapy, and/or other drugs indicated for metastatic PC reported a sensitivity of approximately 80%, specificity in the range of 75% [4] and 89% [30], and PPV of 75% [30] to 86% [4]. Alba et al. also reported a sensitivity of 60%, specificity of 100%, and PPV of 78% for the algorithm of only ARPI use [13]. A study that combined ICD‐10 codes with PSA > 50 ng/mL with or without bone scintigraphy and bone health agents reported lower PPVs in the 16%–28% range [20]. All these studies used chart review or radiology reports as a reference standard for validation purposes.
A study that used a LR model of tumor characteristics reported an AUC of 94% (95% CI: 94%–94%) [27], while another study that used a prediction model of tumor characteristics and demographic factors reported an AUC of 88% [31]. Both the studies that used prediction‐based models utilized data from the disease registry as the reference standard.
Bone Metastasis
3.3.2
Six studies [15, 18, 20, 24, 26, 29] assessed the bone metastasis (BM) phenotype (Tables 3 and S4). Three studies reported only claims‐based definitions of BM [20, 26, 29]. One study with a combination of an ICD‐9 code and BM‐related procedures resulted in a sensitivity of 92% (95% CI: 78%–97%), a specificity of 99%, and PPV of 92% when compared with data from chart review [29], while another study that used an ICD‐9 code with or without bone scans and bone health agents when compared with data from the disease registry resulted in a sensitivity of 56%–60%, a specificity of 54%–58%, and PPV of around 69% [26]. Yet another study that used a combination of ICD‐10 codes with PSA > 50 ng/mL with or without bone scintigraphy and bone health agents reported lower PPVs in the 5%–11% range when compared with data from chart review [20].
Three studies reported the diagnostic accuracy of model‐based prediction for the BM phenotype using data from bone scans or the disease registry as the reference standard [15, 18, 24]. Bai et al. [15] and Dong et al. [18] used nomogram prediction models based on tumor characteristics and reported AUCs of 96% and 95%, respectively. While another study used machine‐learning models of tumor characteristics and demographic factors and described AUCs of 90% from the LR model and 96% from the eXtreme Gradient Boosting model, and sensitivity in the 87%–91% range when compared with the data from the disease registry [24].
Lymph Node Metastasis
3.3.3
Two studies reported the diagnostic accuracy of model‐based prediction for LNM using data from hospital EHR (Tables 3 and S4). Jeong et al. used a nomogram prediction model of tumor characteristics and reported an AUC of 97% [22]. Sabbagh et al. used machine‐learning models of tumor characteristics and reported AUCs of 82.0% [28].
Distant Metastasis
3.3.4
One study reported the diagnostic accuracy of model‐based prediction for distant metastasis phenotype (Tables 3 and S4) and reported an AUC of 69% [34], while another study that used a combination of ICD‐10 codes with PSA > 50 ng/mL with or without bone scintigraphy and bone health agents reported lower PPVs in the range of 5%–19% when compared with data from chart review [20].
Advanced PC Phenotypes
3.4
CRPC
3.4.1
Three studies assessed the mCRPC phenotype [6, 19, 32], while three studies [14, 19, 25] assessed the nmCRPC phenotype (Tables 4 and S5). Thurin et al., reported only a claims‐based definition of mCRPC, which had a sensitivity of 77%, a specificity of 100%, and a PPV of 97% using data from chart review as a reference standard [32]. A study that used an algorithm of claims‐based codes and/or laboratory values reported that the algorithm identified approximately 12%–13% of patients with mCRPC from the databases they utilized [6]. Another study used an algorithm with a combination of claims‐based codes and laboratory values and identified < 5% of patients with mCRPC [19]. None of the latter two studies assessed the diagnostic accuracy of algorithms. Malone et al., assessed three separate algorithms for nmCRPC using a combination of claims for either surgical or medical castration along with PSA values and reported sensitivity in the 53%–57% range, specificity in the 68%–80% range, and PPV in the 28%–36% range using data from chart review as a reference standard [25], while Du et al., used claims‐based codes and laboratory values and identified 34% of patients with nmCRPC from the dataset used in the study [19].
HSPC
3.4.2
Two studies assessed the mHSPC phenotype [6, 19], while one study assessed the nmHSPC phenotype [19] (Tables 4 and S5). Freedland et al. used an algorithm that combined claims‐based codes and laboratory values and found that the algorithm identified 22%–32% of patients with mHSPC from the databases they utilized [6], while another study that used only claims‐based codes identified < 5% of patients with mHSPC [19]. Du et al. also used a combination of claims and laboratory values and identified 30% of patients with nmHSPC from the database they utilized [19]. None of these studies assessed the diagnostic accuracy of algorithms.
Performance Status
3.5
Two studies [7, 8] assessed the diagnostic accuracy of performance status using claims‐based predictors in patients with cancer (Table S6). Sensitivity was reported in both studies and was at least 75%, while specificity was 92% in one study [8] and 75% in another study [7]. PPV was 48% and negative predictive value was 98% in one study [8]. Both studies used data from self‐reports and/or patient‐reported outcomes as a reference standard.
Quality Assessment
3.6
A total of 17 studies (58.6%) were deemed to be at low risk of bias on all domains and also of low concern with regard to applicability (Table S7), while two studies [7, 8] had a high risk of bias and applicability concerns with regard to patient selection due to their inclusion of the entire cancer patient populations (Figure 2).
Study quality assessment using QUADAS‐2 tool. The red, green, and orange color indicates the level of risk of bias and applicability concerns as assessed using the QUADAS‐2 tool.
Discussion
4
To the best of our knowledge, this is the first comprehensive systematic review that addressed the validity of algorithms for PC phenotypes in RWD from published and unpublished data. We identified several validation studies of PC key phenotypes, ranging from two studies that assessed performance status to nine studies that assessed any metastasis.
Our systematic review reported several noteworthy findings. Findings for BCR indicate that the prediction‐based models have AUC values < 75% [21, 33, 34], indicating that such models may not sufficiently identify all patients with BCR from RWD. However, ICD‐9 or ICD‐10‐based algorithms resulted in high specificity/AUC values, but very low sensitivity compared to data from chart reviews [5, 23]. Hence, there is an urgent need to develop and validate algorithms for identifying BCR with high sensitivity and specificity values from RWD.
Findings on any metastasis showed that the ICD‐9 or ICD‐10 codes for secondary neoplasm without [13, 30] or with other common metastatic cancer treatments [4, 30] in the US EMR data systems resulted in relatively high sensitivity and specificity when compared to data from chart review, thereby signaling that claims‐based algorithms could be used to identify patients with metastasis from RWD. However, as new metastatic agents become available and existing agents are incorporated into the guidelines to treat earlier stages of disease and as new disease classification systems become available (ICD‐9 to ICD‐10), these algorithms may need to be updated and/or revised and further validated. For instance, enzalutamide and darolutamide are now approved for the earlier stages of PC, and hence the algorithms of prescription of these medications for identifying patients with metastasis should not be used. The use of only ARPI to identify patients with any metastasis had lower validation parameters when compared to data from the chart review [13]. Hence, ICD codes should be used along with the codes to identify metastatic agents to accurately identify patients with PC metastasis. The combination of ICD‐10 codes and PSA value > 50 ng/mL with or without bone scintigraphy and bone health agents had low PPV values [20] indicating that such algorithms may not be helpful to accurately identify patients with metastasis from RWD. The lower PPV values in the later algorithms may be due to several reasons. First, the algorithms required a patient to meet both the criteria of ICD codes and PSA values. Higher PSA levels may precede the development of metastasis, and it is likely that not all components of the algorithm may be fulfilled when metastasis is assessed. Second, serum PSA levels alone can provide very little information about the presence of metastasis, especially in those with a new cancer diagnosis. We also found that studies that used prediction models [27, 31] had AUCs > 88% when compared to data from the disease registry as a reference standard, indicating that such models could be used to identify patients with metastasis in disease registries when claims‐based codes are not available.
Using only the secondary malignant neoplasm of bone and bone marrow 195.8 ICD‐9 code with or without procedure codes for bone scan, bone biopsy, and/or intravenous bisphosphonates resulted in relatively low sensitivity and specificity values compared to data from the disease registry [26], suggesting that such claims‐based algorithms may not sufficiently capture all patients with BM. However, using a combination of 198.5 ICD‐9 code with procedure codes for radiation therapy for BM, fracture, spine fracture, spine cord compression, or evaluation and management from the Medicare claims data [29], resulted in sensitivity, specificity, and PPV values > 92% compared to data from chart review as a reference standard, indicating that an appropriate combination of ICD‐9 codes with certain procedure codes could be utilized to identify patients with BM using administrative claims and EMR databases. The combination of ICD‐10 codes and PSA > 50 ng/mL with or without bone scintigraphy and bone health agents had very low PPV values when compared to the data from chart review, thereby suggesting that such algorithms may not be utilized to identify patients with BM from RWD. Future studies that validate algorithms using ICD‐10 codes along with bone‐metastasis related procedures are needed. Nomogram prediction models using tumor characteristics [15, 18] and machine‐learning models of tumor characteristics and demographic factors [24] to predict BM generated AUCs > 90% and sensitivity and specificity values of ~90%, respectively, when compared to data from the disease registry or bone scans, suggesting that such prediction models could be used to identify patients with BM from EMR and/or disease registries in the absence of claims‐based codes.
Prediction‐based models of LNM using tumor characteristics with or without demographic factors generated relatively high AUC values [22, 28] indicating the utility of such algorithms in the absence of direct measures from RWD. However, these predictive models were based on data from hospital EMR, suggesting limited generalizability. Such predictive models based on tumor characteristics may be used to identify patients with LNM from the disease registry databases and EMRs. Importantly, the models did not use a reference standard or an index test. Hence, future validation studies using a reference standard should be conducted. Our findings about the predictive ability of claims and laboratory values‐based algorithms [20] for distant metastasis indicate that such algorithms are not suitable for identifying patients with distant metastasis due to very low PPV. However, the predictability of distant metastasis from a nomogram model based on tumor characteristics was relatively higher [34]. Algorithms that help identify distant metastasis in patients with PC from RWD need to be developed and validated.
A French nationwide healthcare data study [32] that used claims‐based codes with or without laboratory values to identify patients with mCRPC had a relatively high sensitivity, specificity, and PPV when compared to data from the chart review, indicating that such an algorithm can sufficiently identify patients with mCRPC from RWD. However, medications for CRPC were also a component of the algorithm; hence, as new agents become available and/or guidelines for treating CRPC change, the algorithm may need to be updated, revised, and further validated. Freedland et al., used an algorithm with claims‐based codes with or without laboratory values to identify the proportion of patients with mCRPC [6] but did not assess its diagnostic accuracy. Similarly, Du et al. developed algorithms using a combination of claims‐based variables and laboratory values for mCRPC and nmCRPC but did not validate the algorithm [19]. Future studies that validate these algorithms in RWD are warranted. A study by Malone et al., has three different algorithms based on the combination of claims‐based codes and laboratory values to identify patients with nmCRPC [25]; however, sensitivity, specificity, and PPV were relatively low compared to the reference standard (chart review), and hence such algorithms could not sufficiently identify all patients with the disease phenotype from the EMR. Similarly, Freedland et al., used an algorithm with claims‐based codes with or without laboratory values to identify the proportion of patients with mHSPC [6]; however, they did not assess its diagnostic accuracy. Future studies assessing the validity of the algorithms for identifying patients with HSPC from RWD are warranted.
Our findings suggest that claims‐based algorithms for performance status have high specificity and relatively acceptable sensitivity, comparing such data with patient‐reported outcomes or self‐reports as a reference standard, indicating the utility of such algorithms for identifying patients with poor performance status, especially when such patient‐reported data is not directly available in EMR or administrative claims data.
This is the only comprehensive systematic review of the largest number of RW studies conducted in the last decade to summarize the diagnostic accuracy of algorithms for identifying PC‐specific phenotypes. Also, the overall quality of the studies included in the systematic review was assessed as good. There were some concerns about patient selection in the two studies that evaluated performance status due to their inclusion of the entire cancer patient population. However, this may not affect the findings as claims‐based algorithms for performance status can also be applied to PC patients following further validation. Moreover, several algorithms that utilized ICD‐9 codes with or without other claims‐based indicators and utilized data for years 2015 and earlier need to be updated and validated for ICD‐10 codes to ensure consistent performance. In our review, two studies that used ICD‐9 [17] and ICD‐9/10 codes [13], respectively, to identify metastasis had relatively similar validation estimates. However, studies that used ICD‐9 codes along with other claims‐based procedure codes from data prior to 2015 [4, 29] need to be updated and validated for ICD‐10 codes. Furthermore, algorithms that incorporate procedure codes or medication use as a part of the case definition may have limited applicability for certain research topics such as treatment patterns. For instance, if a medication is used to define the outcome, then it may not be independently assessed as an exposure. Hence, it is important to consider the components of the algorithm in the context of its use.
Some studies in our review had limited sample sizes, were specific to certain geographic regions, and a specific patient population (e.g., Medicare only). The studies also varied in terms of patient inclusion–exclusion criteria. Even though several studies did not assess the diagnostic accuracy of algorithms, we included such studies so that the researchers can have comprehensive information on all published and unpublished algorithms on relevant PC key characteristics and outcomes. In our study, one reviewer assessed the quality of included studies; however, we had two other independent reviewers validate study quality appraisal to ensure that decisions were not solely reliant on one reviewer.
Conclusion
5
We conclude that RWD can be used to identify key characteristics of PC and PC‐specific phenotypes, using several claims‐based algorithms and prediction models. Our findings will aid researchers who would like to identify PC patients with specific outcomes or key characteristics from EMR and/or administrative claims databases.
Plain Language Summary
5.1
Studies that developed algorithms to identify patients with different disease outcomes using healthcare databases need to be summarized. Many studies have reported the validity of PC outcomes identified from healthcare databases, but these studies are not systematically summarized. In this paper, we provide a comprehensive review of the healthcare studies conducted to summarize the validity of models to identify several PC outcomes, including the spread of disease. This paper provides useful information to researchers who utilize large healthcare databases to identify patients with PC with specific outcomes or disease characteristics.
Ethics Statement
As this is a systematic review study that involves summarizing existing literature on a topic, the University of Rhode Island Institutional Review Board deemed this study nonhuman subjects research.
Consent
The authors have nothing to report.
Conflicts of Interest
This study was funded by Bayer Pharmaceuticals. Drs. Ami Vyas and Britny R. Brown were partially supported by this funding. Dr. Britny R. Brown also reported funding from Eli Lilly. Dr. Shweta Kamat was a graduate student at the University of Rhode Island when this study was conducted; she is now an employee of Open Health. Dr. Amit D. Raval is an employee and stockholder of Bayer Pharmaceuticals. The other authors declare no conflicts of interest.
Supporting information
Data S1: pds70236‐sup‐0001‐Supinfo.pdf.
Data S2: pds70236‐sup‐0002‐Tables.docx.
The reference list from the paper itself. Each links out to its DOI / PubMed record.
- 1American Cancer Society , Cancer Facts & Figures 2025 (American Cancer Society, 2025), accessed February 18, 2025, https://www.cancer.org/content/dam/cancer‐org/research/cancer‐facts‐and‐statistics/annual‐cancer‐facts‐and‐figures/2025/2025‐cancer‐facts‐and‐figures‐acs.pdf.
- 2World Cancer Research Fund International , “Worldwide Cancer Data,” accessed February 18, 2025, https://www.wcrf.org/cancer‐trends/worldwide‐cancer‐data/.
- 3S. Brawley , R. Mohan , and C. D. Nein , “Localized Prostate Cancer: Treatment Options,” American Family Physician 97, no. 12 (2018): 798–805.30216009 · pubmed ↗
- 4B. L. Nordstrom , J. L. Whyte , M. Stolar , C. Mercaldi , and J. D. Kallich , “Identification of Metastatic Cancer in Claims Data,” Pharmacoepidemiology and Drug Safety 21, no. Suppl 2 (2012): 21–28.10.1002/pds.324722552976 · doi ↗ · pubmed ↗
- 5M. J. Hassett , D. P. Ritzwoller , N. Taback , et al., “Validating Billing/Encounter Codes as Indicators of Lung, Colorectal, Breast, and Prostate Cancer Recurrence Using 2 Large Contemporary Cohorts,” Medical Care 52, no. 10 (2014): e 65–e 73.23222531 10.1097/MLR.0b 013e 318277 eb 6f PMC 3600389 · doi ↗ · pubmed ↗
- 6S. J. Freedland , X. Ke , M. H. Lafeuille , et al., “Identification of Patients With Metastatic Castration‐Sensitive or Metastatic Castration‐Resistant Prostate Cancer Using Administrative Health Claims and Laboratory Data,” Current Medical Research and Opinion 37, no. 4 (2021): 609–622.33476184 10.1080/03007995.2021.1879753 · doi ↗ · pubmed ↗
- 7K. M. Sheffield , L. Bowman , D. M. Smith , et al., “Development and Validation of a Claims‐Based Approach to Proxy ECOG Performance Status Across Ten Tumor Groups,” Journal of Comparative Effectiveness Research 7, no. 3 (2018): 193–208, 10.2217/cer-2017-0040.29533694 · doi ↗ · pubmed ↗
- 8A. J. Davidoff , I. H. Zuckerman , N. Pandya , et al., “A Novel Approach to Improve Health Status Measurement in Observational Claims‐Based Studies of Cancer Treatment and Outcomes,” Journal of Geriatric Oncology 4, no. 2 (2013): 157–165.23795223 10.1016/j.jgo.2012.12.005PMC 3685201 · doi ↗ · pubmed ↗