Comprehensive Computational Study of a Novel Chromene-Trione Derivative Bioagent: Integrated Molecular Docking, Dynamics, Topology, and Quantum Chemical Analysis
P. Sivaprakash, A. Viji, S. Krishnaveni, K. M. Kavya, Deokwoo Lee, Ikhyun Kim

TL;DR
This study explores a new compound, DMDCT, using computational methods to assess its potential as a therapeutic agent due to its stable electronic structure and biological activity.
Contribution
The novelty lies in the comprehensive computational analysis of DMDCT, integrating molecular docking, dynamics, and quantum chemical methods.
Findings
DMDCT exhibits stable electronic configurations and biologically relevant active sites.
The compound shows promising vibrational and electronic behaviors for therapeutic applications.
Second-order perturbation theory revealed stabilization energies from donor–acceptor interactions.
Abstract
This work thoroughly investigated the compound 4-(2,5-Dimethoxyphenyl)-3,4-dihydrobenzo[g]chromene-2,5,10-trione (DMDCT) using molecular docking, quantum chemical analysis, and vibrational spectroscopy methodology. The medicinal chemistry group has been particularly interested in chromene and benzochromene derivatives due to their wide range of pharmacological actions, including anticancer, antibacterial, anti-inflammatory, antioxidant, antiviral, and neuroprotective capabilities. In this connection, DMDCT has been explored to evaluate its biological, electrical, and structural properties. DFT using the B3LYP functional and 6–31G basis was established to conduct theoretical computations with the Gaussian 09 program. The findings from these computations provide insight into the following topics: NBO interactions, optimal molecular geometry, Mulliken charge distribution, frontier…
Genes, proteins, chemicals, diseases, species, mutations and cell lines named across the full text — each resolved to its canonical identifier and authoritative record.
Click any figure to enlarge with its caption.
 Figure 1
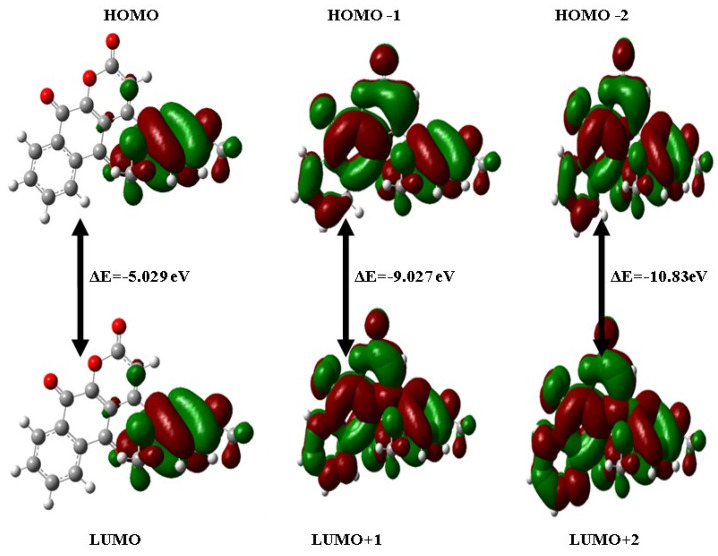 Figure 2
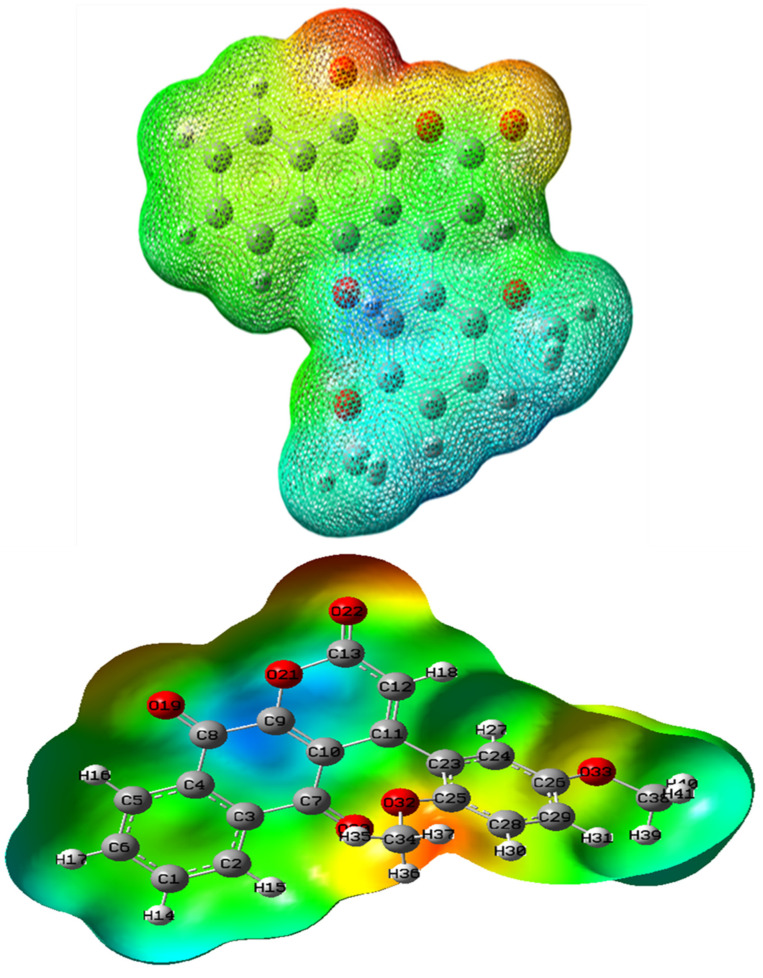 Figure 3
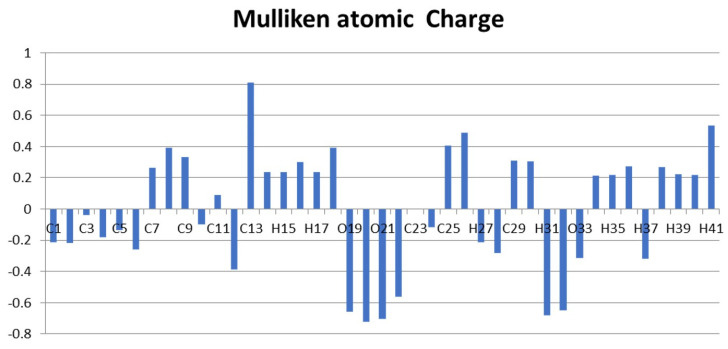 Figure 4
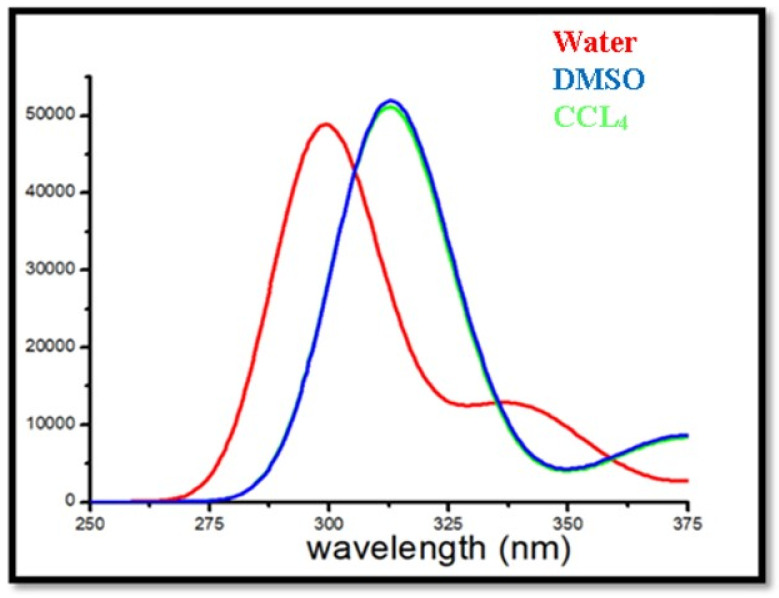 Figure 5
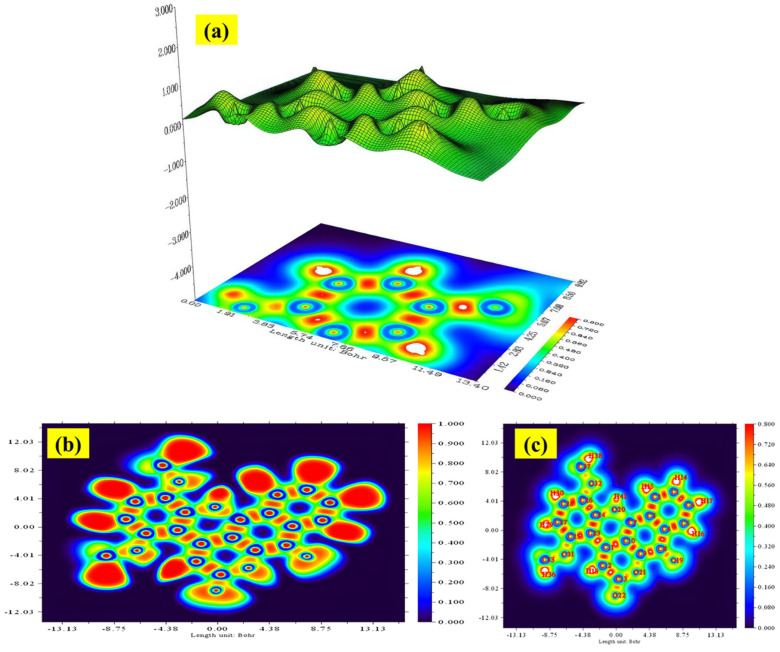 Figure 6
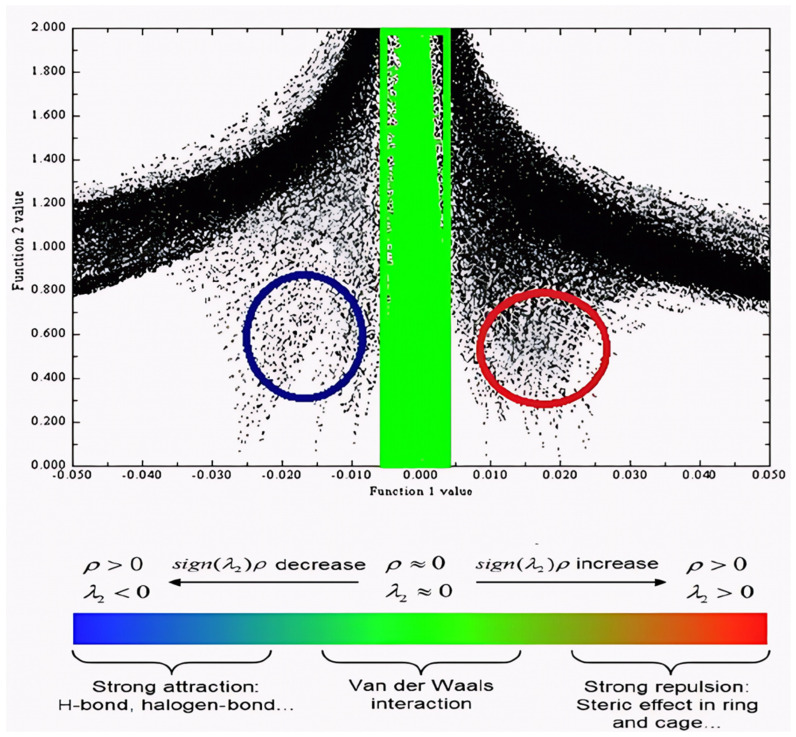 Figure 7
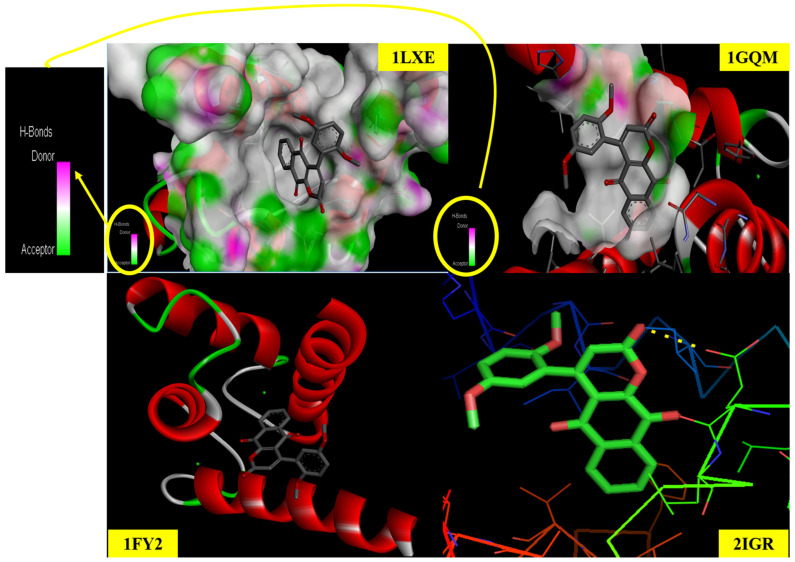 Figure 8
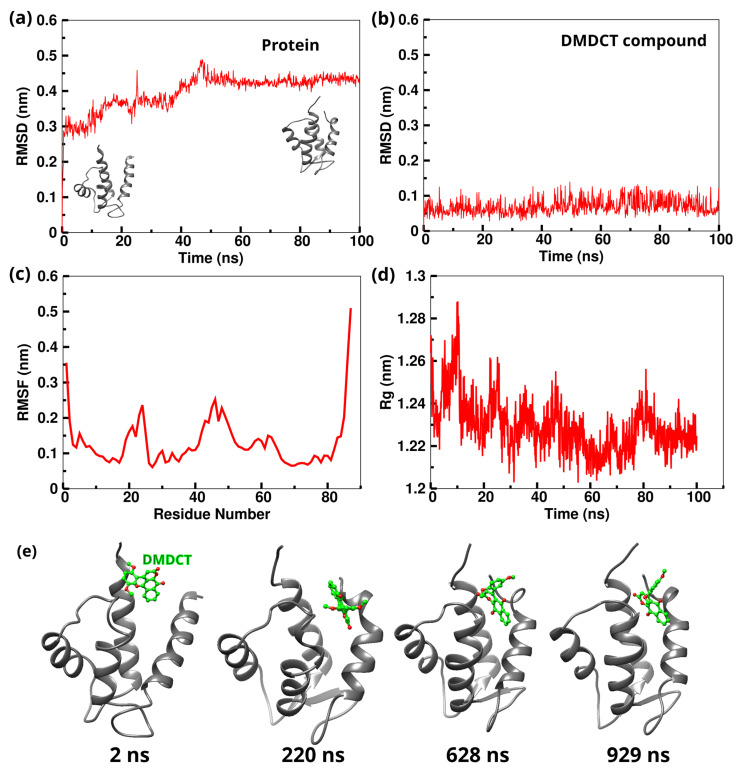 Figure 9
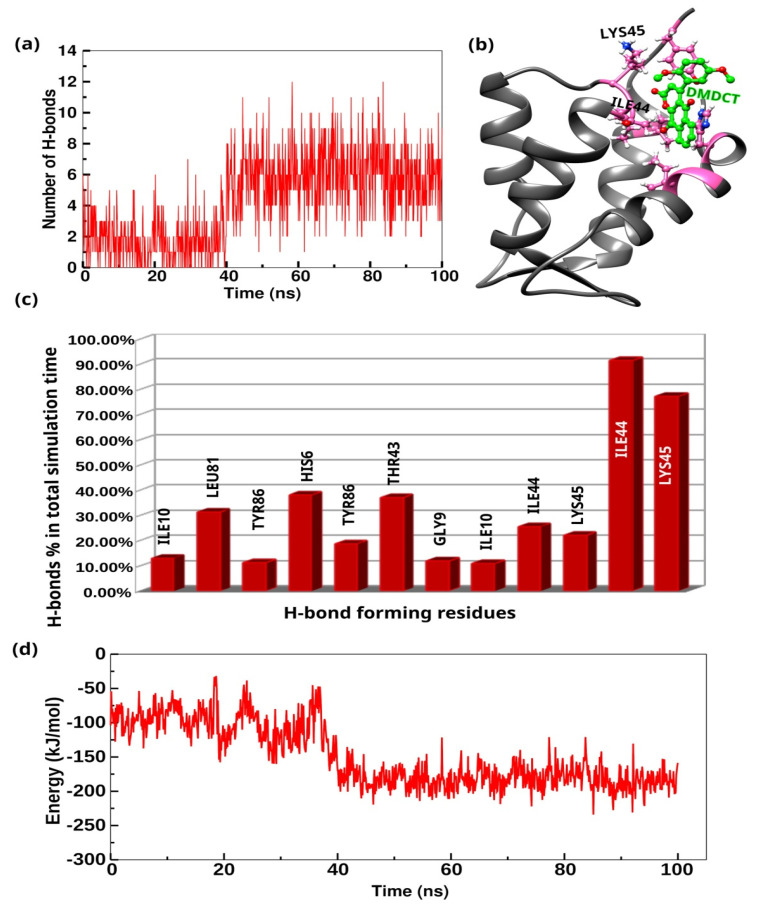 Figure 10
- —Bisa Research Grant of Keimyung University
Peer Reviews
No public reviews on file for this paper yet. If you reviewed it on a platform where reviews are public (OpenReview, ICLR, NeurIPS, ICML), you can paste yours below so the community can read it here.
Videos
No videos yet. Explain this paper in a talk, walkthrough, or lecture? Add one.
Taxonomy
TopicsNonlinear Optical Materials Research · Synthesis and biological activity · Synthesis and Characterization of Heterocyclic Compounds
1. Introduction
The continuous detection of novel bioactive molecules with enhanced pharmacological efficiency is now of primary importance in drug research and development. The natural and manufactured heterocyclic compounds have attracted greater attention owing to their extensive array of biological functions and medicinal uses [1]. In pharmaceutical chemistry, chromene and benzochromene derivatives are remarkable structures. Many compounds have been recognized for their pharmaceutical potential, including benzochromenes, which combine benzene and a chromene ring to enhance the drug-likeness and target binding [2]. Many synthetic and natural compounds have this main structure, confirming the wide range of biological activities. It has anti-inflammatory, hypolipidemic, antihypertensive, estrogenic, anticoagulant, analgesic, and antispasmodic activities [3,4,5,6]. Meanwhile, the benzochromene derivatives perform antiviral, antioxidant, central nervous, and antiplatelet aggregation system activities [7,8,9,10]. These compounds have been demonstrated to be antimicrobial [11,12,13,14], anti-tubercular [15,16], cardiovascular [17], vascular disrupting [18], antileishmanial [19,20], anti-rheumatic [21], neuroprotective (Alzheimer’s preventive) [22], anti-HIV [23], antiproliferative [24], anticancer [25], and anti-tumor [26,27]. The structural alterations in these compounds can appreciably involve their pharmacokinetic properties, receptor affinity, and metabolic stability, consequently influencing their therapeutic efficacy. In this study, DMDCT possesses critical pharmacophores, including methoxy-substituted phenyl rings and chromene structures. These features have been previously linked to enhanced biological activity and receptor specificity. Methoxy groups increase electron-donating actions, possibly enhancing interactions with biomolecular targets through π–π stacking and hydrogen bonding. Additionally, the dihydrobenzo[g]chromene-2,5,10-trione structure provides a stiff, planar configuration that facilitates advantageous docking contacts with enzymes or receptors associated with essential disease processes.
Molecular docking functions as a prediction instrument in structure-based drug design, facilitating the assessment of interactions between small compounds and target biomacromolecules, such as enzymes or receptors. It aids in evaluating the binding affinity, orientation, and conformational flexibility of ligands within the protein’s active site. In this work, molecular docking was used to evaluate the binding affinity of DMDCT with certain protein targets associated with cancer and neurological diseases. Docking simulations elucidate the binding mechanism and structural requirements of the ligand by analyzing hydrogen bonds, hydrophobic interactions, and electrostatic forces. MD simulations were achieved to evaluate the dynamic manners and permanence of the DMDCT–protein compound over time, complementing the docking experiments. Docking offers a static representation of interactions, whereas molecular dynamics simulations replicate authentic physiological conditions by including conformational flexibility, solvent interactions, and temperature variations. Key parameters, such as RMSD, Rg, and RMSF, are investigated to evaluate the overall stability and compactness of the ligand–receptor complex. The findings assist in corroborating the docking predictions and elucidating the dynamic properties of the recognition of molecules.
Quantum chemistry studies using DFT provide significant insights into the electrical and structural properties of molecules. This work employed DFT calculations using the B3LYP functional and the 6–31G basis set to enhance the geometry of DMDCT and identify several molecular descriptions. The optimized structural properties, which are attributed to bond lengths, bond angles, and dihedral angles, clarify the conformational preferences of the molecule and impact its binding efficiency. Electronic descriptors, such as HOMO and LUMO energies, are vital for understanding a molecule’s chemical reactivity and stability. The energy disparity between the HOMO and LUMO, referred to as the band gap, indicates the molecule’s kinetic stability and its potential for charge transfer interactions. A low energy gap indicates elevated chemical reactivity, making the molecule a suitable candidate for biological activity [28]. MEP maps were generated to depict the electron-rich and electron-deficient regions of the molecule, which are likely sites for interactions with nucleophiles and electrophiles in biological targets. The NBO analysis was employed to clarify intra- and inter-molecular charge transfer interactions, emphasizing critical donor–acceptor relationships and stabilization energies that affect the molecule’s electrical properties.
The DMDCT pharmacological potential can be assessed using vibrational spectroscopy, molecular docking, quantum chemistry, and RDG screening. The compound’s structural stability, binding affinity, electrical properties, and pharmacokinetics are detailed and explained in this study. These research findings may enable the systematic development of safer and more effective analogs or derivatives. Here, electron pair localization and chemical bonding in molecules are stimulated using the ELF and LOL analyses. Using these analytical techniques, one can more readily accept the properties of reactivity regions, high spatial resolution, and the nature of bonds and lone pairs.
Innovations in multifunctional chemicals with high bioavailability and target specificity are highly needed to combat global cancer and neurological illnesses. Hence, the chromene-based structure and advantageous functional group, DMDCT, is a good foundation for therapeutic research. In the present research, the findings were used to understand and develop computational chemistry and molecular biology for next-generation pharmaceutical applications.
2. Result and Discussion
2.1. Molecular Geometry
DMDCT’s molecular structure and atom numbering are shown in Figure 1. For a non-linear molecule of N atoms, the maximum number of potentially active fundamental vibrational modes is determined by the formula (3N − 6), which accounts for the exclusion of three translational and three rotational degrees of freedom. For DMDCT, including 41 atoms, the overall count of normal vibrational modes is 117 (i.e., 3 × 41 − 6 = 117). The vibrational modes are distributed throughout several symmetry species and are often categorized as in-plane and out-of-plane vibrations. In DMDCT, 117 normal modes include 38 in-plane vibrations and 38 out-of-plane vibrations, with the remaining modes associated with various stretching, bending, and torsional motions inside the molecule.
2.2. Structural Properties
DMDCT consists of five substituents: three carbonyl groups (C=O) and two methoxy groups (–OCH_3_). At the B3LYP/6–31G theoretical level, Gaussian 09 software calculated optimized geometric parameters, such as bond lengths, bond angles, and dihedral angles, as shown in Table 1. The molecule has 12 single C–C bonds, 7 C=C bonds, 3 C=O bonds, and 6 C-O bonds. The calculated C-C bond lengths vary from 1.36 to 1.43 Å. The longest C–C bond, measuring 1.43 Å, is found between C1-C6, C2-C3, C3-C4, C4-C5, C7-O20, C8-O19, C9-C10, C9-O21, C10-C11, C12-C13, C13-O22, C25-O32, C26-O33, O32-C34, and O33-C38. The bond lengths of C1-C2, C5-C6, and C13-O21 are equivalent, each measuring 1.36 Å. Similarly, C23-C25, C24-C26, C28-C29, C23-C25, and C24-C26 have an identical bond length of 1.39 Å. The C–O bond lengths vary from 1.36 Å to 1.432 Å, with the longest bond found in C13-O22 and the smallest in C13-O21, and the C–H bond lengths range from 1.07 Å to 1.43 Å, as determined at the B3LYP/6–31G level.
2.3. Vibrational Assignments
Table 2 presents the comprehensive vibrational assignments of the basic modes of DMDCT, including the measured and computed frequencies as well as normal mode descriptions. All computed vibrational frequencies were scaled using the standard B3LYP/6–31G scaling factor of 0.9 to correct for the systematic overestimation inherent in harmonic frequency calculations. This scaling ensures better agreement between the calculated and experimental FT-IR/FT-Raman spectra.
2.3.1. C-H Vibration
The carbon–hydrogen stretching vibrations in the phenyl ring of DMDCT are detected within the range of 3082–2820 cm^−1^. Aromatic carbon–hydrogen stretching vibrations generally manifest in the infrared band between 3100 cm^−1^ and 3000 cm^−1^ [28], and the FT-IR bands detected at 3100, 3036, and 3030 cm^−1^ in this work are defined as aromatic carbon–hydrogen stretching modes [29]. The scaled vibrational frequencies, calculated using the B3LYP/6-31 + G(d,p) theoretical framework, demonstrate remarkable concordance with the experimental results. The in-plane bending vibrations of carbon–hydrogen bonds in aromatic rings often occur within the range of 1300–1000 cm^−1^. The Raman spectra of DMDCT reveal vibrations at 1282 cm^−1^, 1208 cm^−1^, and 1120 cm^−1^. Furthermore, for the DMDCT molecule, the C–H in-plane bending modes are computed to manifest at 1243 cm^−1^, 1223 cm^−1^, and 1216 cm^−1^. The carbon–hydrogen out-of-plane bending vibrations, which exhibit significant coupling with other modes, are generally detected within the range of 950–800 cm^−1^ [30]. In the present investigation, clearly identifies the modes at 948 cm^−1^, 933 cm^−1^, 932 cm^−1^, and 917 cm^−1^. These findings confirm the presence of characteristic aromatic ring vibrations in the DMDCT molecule and further validate the accuracy of the computational results.
2.3.2. Carbon=Carbon, Carbon–Carbon, and Carbon–Carbon–Carbon Vibration
The stretching vibrations of carbon=carbon and carbon–carbon in aromatic rings often occur within the ranges of 1625 cm^−1^–1400 cm^−1^ and 1380 cm^−1^–1280 cm^−1^, respectively [31]. These vibrations are referred to as semicircle stretching vibrations due to the related ring deformation [32]. The ongoing examination of DMDCT identifies Carbon=Carbon stretching vibrations at 1626 cm^−1^ and 1565 cm^−1^ in the FT-IR spectra and at 1551 cm^−1^ and 1546 cm^−1^ in the FT-Raman spectrum. The C–C stretching vibration of the DMDCT molecule is seen at 1026 cm^−1^ in the FT-IR spectrum and at 994 cm^−1^ in the FT-Raman spectrum [33]. In a comparable system, Singh [34] previously documented the C–C–C stretching vibration at 1003 cm^−1^ (Raman) and 983 cm^−1^ (FT-IR). The C–C–C stretching mode for DMDCT is observed at 844 cm^−1^ in FT-IR and 840 cm^−1^ in FT-Raman in this study. The B3LYP/6–31G technique yielded a theoretical value that supports this observation. Additionally, the in-plane bending vibrations of the C–C–C group are seen at 796 cm^−1^, 774 cm^−1^, and 761 cm^−1^, whereas the out-of-plane bending vibrations are noted at 749 cm^−1^, 740 cm^−1^, and 718 cm^−1^. Theoretical models forecast a comparable bending mode at 695 cm^−1^.
2.3.3. Methyl Group (CH3) Vibrations
In the vibrational analysis of substituted benzene rings, the existence of a methyl (–CH_3_) group results in nine distinctive fundamental modes, encompassing symmetric and asymmetric stretching, symmetric and asymmetric deformations, in-plane rocking (δ rock), in-plane bending (δ), out-of-plane rocking (γ rock), out-of-plane bending (γ), and twisting (ΓCH_3_) vibrations [35]. In the molecular structure of DMDCT, two methyl (CH_3_) groups are replaced on the aromatic ring system [36]. Typically, symmetric and asymmetric CH_3_ stretching vibrations are observed between the range of 2942 cm^−1^ and 2879 cm^−1^. N. Shanmugapriya et al. [37] report that CH_3_ asymmetric stretching vibrations are seen in FT-IR spectra at 2929 cm^−1^ (weak) and in the FT-Raman spectrum at 2947 cm^−1^ and 2933 cm^−1^. Sivakumar et al. [38] similarly identified pronounced peaks at 2922 cm^−1^, 2855 cm^−1^, and 2869 cm^−1^, which are equivalent to the symmetric and asymmetric CH_3_ stretching modes in both FTIR and FT-Raman spectra. Benzon [39] detected CH_3_ deformation vibrations at 1458, 1455, 1450, and 1435 cm^−1^, but Parveen et al. [40] attributed CH_3_ deformation to 1355 cm^−1^ in the IR spectra. In the current investigation, CH_3_ in-plane bending vibrations are designated at 1380 cm^−1^ and 1359 cm^−1^ in the FT-IR and FT-Raman spectra. The theoretical wavenumbers, computed by the B3LYP/6–31G approach, forecast the subsequent bending modes: δᵒᵖ = 695 cm^−1^, δⁱᵖᵇ = 589 cm^−1^, δˢᵇ = 528 cm^−1^, δᵒᵖʳ = 472 cm^−1^, and δⁱᵖʳ = 458 cm^−1^, corroborating the experimental results.
2.3.4. C=O Vibration
The C=O stretching vibration of the carbonyl group is generally linked to a significant dipole moment and a pronounced stretching band, commonly detected in the spectral range of 1740–1660 cm^−1^, and the FT-IR spectra exhibited a moderate-intensity band at 1698/cm, attributable to the C=O stretching mode. An experimentally measured value exhibits a little divergence from the theoretically expected frequency of 1659 cm^−1^, determined using the B3LYP/6-311G computational method [41]. The in-plane bending vibrations of the carbonyl (C=O) group generally manifest within the 820–630 cm^−1^ range. Raajaraman et al. [42] documented the C=O in-plane bending vibration at 694 cm^−1,^ and the present study identifies a weak-intensity peak at 694 cm^−1^ in the FT-IR spectra, which corresponds to the C=O in-plane bending mode. The theoretical calculation employing the B3LYP/6–31G approach predicts this mode at roughly 695 cm^−1^, aligning well with the experimental result.
2.4. HOMO-LUMO Analysis
The HOMO–LUMO energy levels of the DMDCT molecule were determined via DFT with the B3LYP/6–31G basis set. The HOMO signifies the molecule’s potential to donate electrons, whereas LUMO denotes its ability to accept electrons. The FMO offers vital information regarding the compound’s chemical reactivity, kinetic stability, and electrical properties [43]. The HOMO–LUMO energy gap is a critical parameter for evaluating a molecule’s chemical stability, optical polarizability, and hardness–softness properties. A larger energy gap signifies a more rigid (less reactive) molecule, whereas a smaller gap denotes a more pliable (more reactive) character. The global hardness (η) of a molecule is determined by the formula [44]:
This electronic spectrum transforms from the ground state to the first excited state, mostly due to a single electron excitation between the HOMO and LUMO orbitals. The HOMO energy is directly associated with the ionization potential, while the LUMO energy relates to the molecule’s electron affinity. Table 3 displays the calculated energies of the HOMO and LUMO, along with other orbitals such as HOMO-1, HOMO-2, LUMO+1, and LUMO+2. Figure 2 depicts the pertinent orbital plots and energy diagrams obtained using the B3LYP/6–31G method.
2.5. Global Chemical Reactivity Descriptors (GCRD)
We used the DFT method to look at the GCRD of the title compound. These include its global softness (σ), electronegativity (χ), global hardness (η), ionization potential (I), chemical potential (µ), electron affinity (A), and global electrophilicity index (ω), which were evaluated using density functional theory (DFT)-derived descriptors. Koopmans’ theory posits that the E_HOMO is directly correlated with the ionization potential (I), whereas the E_LUMO serves to approximate the electron affinity (A) [44].
The chemical potential (µ), which signifies the propensity of electrons to depart from an equilibrium system, is a crucial parameter in elucidating molecular reactivity. These reactivity descriptors also provide insight into the molecule’s chemical stability, electrophilic/nucleophilic character, and reactive behavior. The FMO analysis was performed utilizing B3LYP with the 6–31G basis set, yielding valuable information on electronegativity, chemical hardness, and softness. The computed values of these descriptors are summarized in Table 3, supporting the understanding of the molecule’s potential applications in reactivity and biological interactions.
2.6. MEP Analysis
The MEP around a molecule represents its net electrostatic effect from its total charge distribution at that location. It correlates closely with molecular properties such as partial atomic charges, dipole moment, chemical reactivity, and electronegativity. The MEP analysis offers a visual approach to understanding the relative polarity of different regions within a molecule.
In this study, an electron density iso-surface was generated and mapped with the electrostatic potential surface, highlighting possible reactive sites of the molecule. The electrostatic potential is shown using several colours: Red signifies areas with the lowest potential, whereas potential ascends in the sequence Red < Orange < Yellow < Green < Blue, with Blue denoting the highest potential zones. The DFT B3LYP technique with the 6–31G basis set in Gauss View [45] software (Gauss view 5.0) generated the compound DMDCT MEP surface. Figure 3 visualization aids in pinpointing prospective locations for electrophilic (negatively charged) and nucleophilic (positively charged) assaults. The red zones on the MEP surface are deemed strongly electronegative, promoting nucleophilic assault, whereas the blue portions are electron-deficient.
2.7. Natural Bond Orbital Analysis
In quantum chemistry, NBOs denote confined orbitals characterized by maximal electron density, providing a lucid representation of bonding interactions inside a molecule [46]. NBO analysis is an effective technique for investigating intramolecular charge transfer mechanisms, particularly the transference of electron density from occupied (donor) orbitals to empty (acceptor) orbitals. These interactions are essential for molecule stability, since they elucidate the mechanics of electron delocalization. The intensity of each donor–acceptor interaction is measured by the second-order stabilization energy, referred to as E(2), which is determined by second-order perturbation theory. This number indicates the extent of delocalization due to orbital overlap, enhancing comprehension of the molecule’s conjugation and stability.
The E(2) value is influenced by parameters including the occupancy of the donor orbital, the diagonal components (ɛᵢ and ɛj) representing the energies of the donor and acceptor orbitals, and the off-diagonal Fock matrix element, F(i,j), which characterizes the interaction between these orbitals [44]. An elevated E(2) value signifies a more robust donor–acceptor contact and a pronounced hyperconjugative effect, implying improved conjugation within the molecular structure. The interactions and their associated stabilization energies are presented in Table 4 and Table 5. The second-order perturbation analysis utilizing the NBO approach indicates considerable intramolecular hyperconjugative interactions, particularly with π-electrons, which greatly enhance the electronic stability of the molecule.
2.8. Mulliken Charge Calculation
Mulliken atomic charge analysis is essential in quantum chemistry investigations of molecular systems, as it offers insights into charge distribution, which profoundly influences features such as dipole moment, molecular polarizability, and electronic structure. Table 6 and Figure 4 display the computed Mulliken atomic charges, derived from the electron population linked to the basic functions of each atom. The charge distribution in the specified molecule reveals that all hydrogen atoms, in addition to carbon atoms C7, C8, C9, C11, C13, C23, C25, and C26, exhibit positive charges. Conversely, the oxygen atoms and carbon atoms C1, C2, C3, C4, C5, C6, C10, C12, C24, H27, and C28 have a negative charge. C13, possessing a charge of +0.811, is among the most electropositive atoms, indicating a pronounced propensity to attract electrons. Conversely, the oxygen atoms O19 (−0.658) to O21 (−0.704) have considerable negative charges, signifying elevated electronegativity. Moreover, all hydrogen atoms bonded to the phenyl rings show electropositive characteristics, aligning with their anticipated chemical properties [47].
2.9. UV-Visible Spectra
DFT analyses, employing the B3LYP/6–31G theoretical framework, were performed to evaluate several optical properties of the title compounds’ absorbance, oscillator strengths, excitation energies, and optimal geometry in the ground state. These simulations were essential for predicting the electronic absorption spectra of the molecule. Theoretical investigations have been conducted in many solvent environments, including carbon tetrachloride (CCl_4_), benzene, dimethyl sulfoxide (DMSO), and water, enabling a comparison of solvent effects on electronic transitions. In contrast to semi-empirical approaches for medium-sized molecules, DFT provides a dependable and computationally effective means of assessing electronic absorption spectra, as seen in Figure 5.
Table 7 summarizes the expected energy (E), absorption wavelengths, excitation, oscillator strengths (f), and the primary electronic transitions involved. The oscillator strength is a crucial parameter that signifies the probability of electronic transitions and may also be utilized to assess the LHE of the compound, which is vital for optoelectronic applications. The LHE may be computed using the following equation [48]:
2.10. ELF and LOL Analysis
Topological investigations of the ELF and LOL are essential methodologies for examining the electrical structure of molecules. These approaches provide insights that are independent of the arbitrary choice of molecular orbitals and are directly based on the electron density distribution. Both ELF and LOL depict the electrical structure via localization domains (designated as η(r)) and attractors, which represent areas of covalent bonding, lone pairs, core electrons, and valence shells. The spatial arrangement of these attractors facilitates the categorization of core basins, often centered on atomic nuclei (except hydrogen), and valence basins, characterized by their connectedness to the core areas. This topological method offers a solid framework for defining chemical bonding based on electron localization.
In ELF mapping, areas with minimal Pauli repulsion are depicted in blue, whereas areas of significant Pauli repulsion are illustrated in red. Regions with ELF < 0.5, signifying charge delocalization, are depicted in blue, whereas ELF > 0.5 areas—linked to covalent bonding—are represented in red. The ELF color gradient transitions from red (value about 1.0) to blue (value approximately 0.0). Figure 6a,b illustrates the electron density, ELF, and LOL plots for the chemical DMDCT. Figure 6c illustrates the LOL map, depicting the impact of electron localization with values spanning from 0.8 to 0.0. The areas of C–C and C–O covalent bonds display elevated LOL values, signifying substantial electron localization. Conversely, low localization zones manifest as blue, annular areas surrounding nuclei, particularly between valence and inner shells in heavier atoms. The illustrations also vividly illustrate the lone pairs on oxygen atoms.
2.11. RDG Analysis
The RDG function serves as a potent computational instrument for the visualization and analysis of non-covalent interactions (NCIs) in molecular structures [48]. It functions by assessing the real-space distribution of electron density, ρ(r), together with its first derivative. RDG aids in identifying and differentiating weak intermolecular interactions that influence molecular stability and reactivity.
In RDG analysis, two-dimensional charts are created by graphing the RDG versus sign(λ2)ρ, where λ2 is the second eigenvalue of the electron density Hessian matrix. This product facilitates the categorization of interaction types: the sign of λ_2_ differentiates between attractive and repulsive interactions, and the size of ρ(r) signifies their intensity.
The molecule DMDCT exhibits various non-covalent interactions as indicated by the RDG iso-surface and accompanying plot (Figure 7), based on sign(λ2)ρ values. Hydrogen bonding interactions are observable throughout the range of −0.050 to −0.015 a.u., characterized by prominent peaks in the negative area. Van der Waals interactions manifest within the range of −0.015 to 0.010 a.u., generally represented as wide and shallow characteristics. Steric repulsions, or exchange repulsion effects, range from 0.010 to 0.050 a.u., frequently appearing as peaks in the positive zone. In the RDG iso-surface maps, interaction types are color-coded for clarity: blue regions represent attractive interactions (e.g., hydrogen bonding), green regions identify weak dispersive forces (van der Waals), and red regions indicate repulsive interactions (steric effects). This graphical depiction provides a lucid and comprehensive comprehension of the molecule’s non-covalent interaction profile.
2.12. Molecular Docking Studies
MD simulations, collective with AI-powered drug design, have deeply progressed the competence of drug discovery by analyzing probable curative molecules with exactitude while reducing the need for wide lab experiments. These highly developed techniques enable the effective showing of vast compound libraries, calculation of binding strengths, and assessment of the immovability of drug–receptor composites at the molecular level. The integration of artificial intelligence enhances both the speed and dependability of these processes, and the creative drug development is further cost-effective and smoother than conventional approaches. By reducing protracted experimental measures and increasing early-stage recognition of valuable compounds, these computational strategies hasten innovation, improve protection, and lessen overall development costs.
The ligand demonstrates significant binding affinities with many target proteins, as evidenced by its molecular docking interactions. Protein 1GQM engages with the ligand in its third conformer, demonstrating a minimum binding energy of −7.57 kcal/mol and an inhibition constant (Ki) of 2.82 µM. The protein 1FY2 demonstrates interaction through the sixth conformer of the ligand, with a binding energy of −7.11 kcal/mol and a Ki value of 6.17 µM. Similarly, protein 1LXE engages with the ligand in its first conformer, exhibiting a binding energy of −6.67 kcal/mol and an inhibition constant of 12.89 µM. The most robust interaction occurs with protein 2IGR, where the ligand’s second conformer has a minimum binding energy of −7.73 kcal/mol and an inhibition constant of 2.17 µM. Figure 8 depicts the ligand–protein binding interactions, while Table 8 and Table 9 summarize the associated binding energy values and inhibition constants.
2.13. MD Simulations
MD simulations assessed the stability of the S100A12 protein complexed with the DMDCT compound. The 100 ns trajectories obtained from the MD simulations were analyzed for RMSD, RMSF, Rg, trajectory visualization, and hydrogen bonds (H-bonds). RMSD analysis revealed that the S100A12 protein remained stable in the presence of the DMDCT compound (Figure 9a). The RMSD of the 9s compound also indicated that it remained stable throughout the simulation time (Figure 9b). RMSF results highlighted fluctuations primarily in the loop regions of the protein (Figure 9c). The Rg analysis provided insights into the compactness of the simulated complexes, showing a decrease in the Rg value over the simulation time, which suggests that the complex became more compact (Figure 9d). Visualization of the trajectory frames revealed structural variations over time, indicating the structural transitions adopted by the protein under the influence of the DMDCT compound (Figure 9e). Further analysis of H-bond interactions between the protein and the DMDCT compound showed an increase in the number of H-bonds after 40 ns, indicating structural changes responsible for these increased interactions (Figure 10a). Notably, Lys45 (involved in 77.35% of the total simulation time) and Ile44 (involved in 91.42% of the total simulation time) were the primary residues forming H-bonds with the 9s compound for a significant portion of the simulation time (Figure 10b,c). These results collectively highlight the stability of the 9s compound in the protein binding pocket and its role in influencing the protein’s structural dynamics. In addition, non-bonded interaction energy calculations, including van der Waals and Coulombic contributions, demonstrated that the DMDCT compound exhibited a favorable interaction energy with the S100A12 protein (Figure 10d). These results collectively highlight the stability of the DMDCT compound in the protein binding pocket and its role in influencing the protein’s structural dynamics.
3. Experimental Method
Using a Perkin Elmer Spectrometer equipped with an MCT detector, a KBr beam splitter, and a “globar source” [Resolution of ±1 cm^−1^], the FTIR spectra of DMDCT were recorded from 4000 to 450 cm^−1^, at room temperature [model: Perkin Elmer, Waltham, MA, USA]. The Bruker instrument equipped with RFS27 Raman accessories measured the FT-Raman spectrum from 4000 to 0 cm^−1^ [Model: RFS27, Bruker, Billerica, MA, USA]. An Nd:YAG (1064 nm) with 200 mW power was used to excite the sample.
4. Computational Method
4.1. Density Functional Theory
The DFT calculations, including optimized bond lengths, dihedral angles, HOMO, LUMO, MEP, ESP, NBO, bond angles, UV, and Mulliken, were performed utilizing Becke’s B3LYP (3-parameter hybrid model and the Lee–Young–Parr correlation functional) approach via Gaussian 09 software [49]. The 6–31G basis set was used to ascertain the electronic molecular structure. To learn about the various locations where the molecule is attacked by electrophiles and nucleophiles, a molecular electrostatic potential diagram has been shown. As a result, the calculated frequencies, vibrational activity, polarization, MEP, hardness, softness, and bandgap were obtained. The Donor and Fock matrices in the NBO framework for the DMDCT molecule were computed using the B3LYP technique with a 6–31G basis set [45]. Stabilization energy was derived from second-order perturbation theory.
4.2. MD (Molecular Docking) Studies
MD analyses with AutoDock (AUTO DOCK 1.5.6) were performed to examine the binding interactions between the ligand and the target protein, DMDCT. The 3D structure of the target protein was acquired from the PDB and processed by eliminating water molecules and heteroatoms, then including polar hydrogens and Kollman charges. The ligand structure was subjected to energy minimization and subsequently translated to PDBQT format via AutoDock Tools [50]. The grid box specifications were set to include the protein’s active region, and the LGA was employed as the docking approach. Various docking conformations were produced, and the optimal posture was chosen based on binding energy and interaction patterns. The binding affinity (in kcal/mol), as well as hydrogen bonds, hydrophobic interactions, and π–π stacking, were evaluated to determine the stability and specificity of the protein–ligand complex. The results offer substantial insights into the potential of DMDCT as a therapeutic lead compound.
4.3. MD Simulations
The stability and finding affinity of the S100A12 protein MD complexed with the 9s were assessed using GROMACS 2023 software MD simulations [51,52,53,54,55,56]. The initial step involved separating the S100A12 protein and the DMDCT compound from the docked protein PDB file using the UCSF Chimera software (UCSF Chimera 1.18) [57]. Then, topology parameters for the S100A12 protein were assigned based on the CHARMM36 force field [58], while the topology information for the DMDCT compound was obtained from the CGenFF server [59]. The S100A12 protein bound to the DMDCT compound was then placed at the center of a triclinic box, ensuring a minimum distance of 1.2 nm between the protein and the box edges to avoid edge effects. The complex was solvated using the SPC water model [60], and Cl− and Na+ ions were added to neutralize the system’s net charge, and the decrease in energy minimization was executed to remove the steric effect. Following energy minimization, NVT equilibration was conducted at 300 K for 1 ns using the Berendsen thermostat [61]. Subsequently, NPT equilibration was carried out at 1 bar pressure for 1 ns, using the Parrinello–Rahman method for barostat pressure coupling [62]. Here, the PME method was used to deal with long-range electrostatic interactions [63], and H-bond constraints were enforced using the Linear Constraint Solver (LINCS) [64]. After equilibration, the systems were subjected to 100 ns of MD simulation.
The resulting trajectories were analyzed for RMSD, RMSF, and Rg using GROMACS in-built packages (Gromacs 2023). Additionally, H-bond analysis between the S100A12 protein and the DMDCT compound was conducted using VMD (Visual Molecular Dynamics) software (VMD 1.9.4) [65]. Visualization and image rendering were performed using VMD and Chimera packages. Graphs were drawn using Gnuplot (GNUPLOT 5.4).
4.4. Topological Investigations Studies
Topological investigation is crucial for inspecting the molecular structure and individuality of chemical compounds by centering on the connectivity and understanding of atoms and self-governing of their numerical form. This move is particularly precious in theoretical chemistry and pharmaceutical research, as it sheds light on a molecule’s immovability, reactivity, and e^-^ distribution. Through topological methods, scientists can expect biological functions, identify vital pharmacophores, and better realize structure–activity relationships (SAR). Key compensation of this technique embraces its short computational cost, high efficiency, and its capacity to improve and support experimental and quantum chemical findings, finally leading to the tactical development of new, effective, and safer drug candidates.
Analyses utilizing the RDG, LOL, and ELF were conducted with Multiwfn software (Multi wave 3.8 (dev)) to investigate the non-covalent interactions, electron localization, and bonding properties of DMDCT. The wavefunction file (.wfn or .fchk) produced by the DFT optimization using Gaussian 09 was utilized as input in Multiwfn [66]. RDG analysis was conducted to elucidate hydrogen bonds and weak intermolecular interactions, including van der Waals forces, utilizing scatter plots of RDG vs. sign(λ2)ρ to differentiate between attractive and repulsive interactions. The ELF and LOL functions were calculated to assess electron pair localization and delocalization within the molecular structure. ELF maps delineate areas of significant electron localization, including lone pairs and bonding zones, whereas LOL offers supplementary perspectives on the characteristics of orbital localization. The topological investigations provided a comprehensive knowledge of intra- and inter-molecular electron distribution, aiding in the interpretation of the molecule’s stability and reactivity.
5. Conclusions
The vibrational spectra of DMDCT were comprehensively examined in this study. Theoretical assumptions and empirically derived frequencies are in strong agreement. The FT-Raman and FTIR spectra of DMDCT were utilized to attribute all vibrational bands to various modes of vibration. The comprehensive vibrational assignments were evaluated according to PED. The optimal geometric dimensions and vibrational frequency assignments of the fundamental modes of the title compounds were ascertained by DFT/B3LYP/6–31G level calculations. The decreased values of the HOMO-LUMO energy gap indicate the biological activity of the compound, suggesting that these compounds exhibit significant nucleophilic reactivity. The NBO investigation indicates that the UV transitions’ maximum obtained wavelength is related to a number of probable intra- and intermolecular transitions. The tile molecule demonstrates non-covalent interactions, claims the RDG research. ELF and LOL analyses extensively describe the chemical structure, molecular bonding, and reactivity when applied for the quantitative analysis of aromaticity. The docking results demonstrated good to moderate antibacterial effectiveness against all tested pathogens when compared to a conventional drug. The chosen protein’s functional sites were docked with the ligand, and the lowest docking energy value was assessed. The planning of molecular dynamics simulation learn offers fundamental metrics such as RMSD, RMSF, and radius of gyration, revealing the consistent activity of the combinations throughout the simulation. In this study, we validated the stability of the DMDCT compounds within the S100A12 protein pocket through molecular dynamics simulations. The analysis of RMSD of DMDCT, hydrogen bond interactions, and electrostatic and van der Waals interactions between the DMDCT and the S100A12 protein confirmed that the DMDCT remains stable within the protein binding pocket through intermolecular interactions with the S100A12 protein. Notably, residues Ile44 and Lys45 of the S100A12 protein contributed significantly to hydrogen bond formation with the DMDCT compounds.
The reference list from the paper itself. Each links out to its DOI / PubMed record.
- 1da Silva A.J. Buarque C.D. Brito F.V. Aurelian L. Macedo L.F. Malkas L.H. Hickey R.J. Lopes D.V. Noël F. Murakami Y.L. Synthesis and preliminary pharmacolgical evaluation of new (±) 1,4-naphthoquinones structurally related to lapachol Bioorganic Med. Chem.2002102731273810.1016/S 0968-0896(02)00100-112057662 · doi ↗ · pubmed ↗
- 2Mofakham H. Ghadari R. Shaabani A. Pedarpour M. Ghasemi S. “On-water” organic synthesis: L-proline catalyzed synthesis of pyrimidine-2,4-dione-, benzo[g]- and dihydropyrano [2,3-g]chromene derivatives in aqueous media J. Iran. Chem. Soc.20131030731710.1007/s 13738-012-0160-x · doi ↗
- 3Verma V.S. Badwaik H.R. Vaishnav Y. Alexander A. Synthesis, characterization, molecular modelling and biological evaluation of substituted benzo (h) Chromene-3-carboxylate derivatives as a potential agent for the treatment of hyperlipidemia Indian J. Pharm. Sci.20228445346410.36468/pharmaceutical-sciences.939 · doi ↗
- 4Kajal C. Prima F. Callypyrones from marine Callyspongiidae sponge Callyspongiadiffusa: Antihypertensive bis-γ-pyrone polypropionates attenuate angiotensinconverting enzyme Nat. Prod. Res.2021355801581210.1080/14786419.2020.183781933131327 · doi ↗ · pubmed ↗
- 5Mayada M.E. Nermeen A.E. Ahmed M.A. Ahmed M.B. Khaled M.D. Sameh S.E. Mostafa M.S. Safwat A.A. In vivo determination of analgesic and anti-inflammatory activities of isolated compounds from Cleome amblyocarpa and molecular modelling for the top active investigated compounds RSC Adv.202414245032451510.1039/d 4ra 04496 g 39108954 PMC 11299235 · doi ↗ · pubmed ↗
- 6Mohd K.H. Mohammad F.K. Shahnaaz K. Abdullah G.A. Chromenes M.S. Phytomolecules with immense therapeutic potential Plant-derived Bioactives: Chemistry and Mode of Action Springer Singapore 202018520410.1007/978-981-15-2361-8_8 · doi ↗
- 7Maddahi M. Asghari S. Pasha G.F. A facile one-pot green synthesis of novel 2- amino-4 H-chromenes: Antibacterial and antioxidant evaluation Res. Chem. Intermed.20234925327210.1007/s 11164-022-04893-5 · doi ↗
- 8Triveena M.R. Maha A.E. Eman A.F. Synthetic coumarin derivatives with anticoagulation and antiplatelet aggregation inhibitory effects Med. Chem. Res.2023322269227810.1007/s 00044-023-03148-1 · doi ↗