Right Ventricular Myocardial Metabolism and Cardiorespiratory Testing in Patients with Idiopathic Pulmonary Arterial Hypertension
Natalia Goncharova, Aelita Berezina, Daria Ryzhkova, Irina Zlobina, Kirill Lapshin, Anton Ryzhkov, Aryana Malanova, Elizaveta Korobchenko-Andreeva, Olga Moiseeva

TL;DR
This study shows that cardiopulmonary exercise testing can help identify low-risk versus higher-risk patients with pulmonary arterial hypertension by linking it to heart metabolism and function.
Contribution
The study is the first to correlate CPET parameters with RV myocardial metabolism and perfusion in IPAH patients.
Findings
Low-risk IPAH patients differ significantly from intermediate-to-high-risk patients in CPET and RV metabolism/perfusion parameters.
CPET parameters correlate with RV [18F]-FDG and [13N]-ammonia uptake, oxygen consumption, and ventilation metrics.
CPET is a reliable non-invasive tool for risk stratification in IPAH patients.
Abstract
Background: Non-invasive diagnostic tools for the assessment of pulmonary arterial hypertension (PAH) are currently being intensively studied. Positron emission tomography (PET)/computed tomography (CT) with [18F]-fluorodeoxyglucose ([18F]-FDG) and [13N]-ammonia is the gold standard for assessing myocardial metabolism and perfusion. The relationship between right ventricle (RV) myocardial metabolism and perfusion and cardiopulmonary exercise testing (CPET) has not been studied. Objective: to evaluate correlations between the CPET parameters and RV perfusion and metabolism in IPAH patients. Methods: The study comprised 34 IPAH patients (34.2 ± 8.9 years, 4 males, 6 prevalent). Myocardial metabolism and perfusion were assessed using PET/CT with [18F]-FDG and [13N]-ammonia, respectively. CPET, cardiac MRI and invasive hemodynamics were also evaluated. Results: Significant negative…
Genes, proteins, chemicals, diseases, species, mutations and cell lines named across the full text — each resolved to its canonical identifier and authoritative record.
Click any figure to enlarge with its caption.
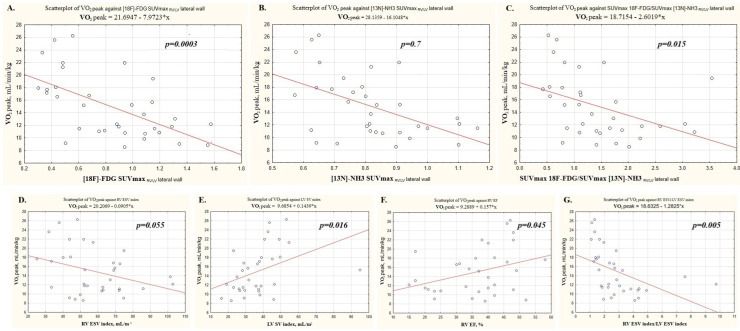 Figure 1
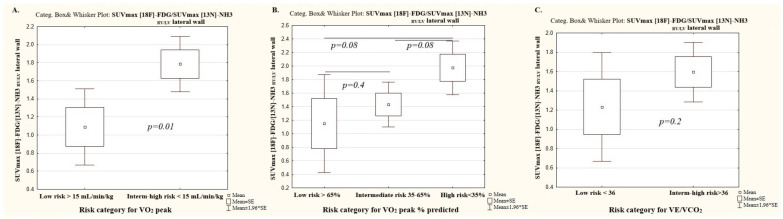 Figure 2
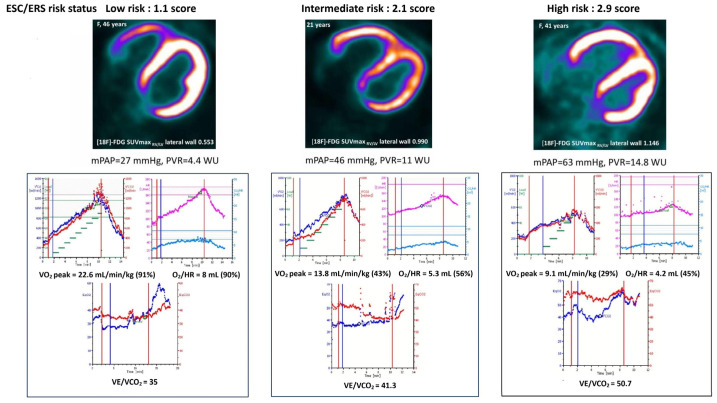 Figure 3
- —Russian Science Foundation
Peer Reviews
No public reviews on file for this paper yet. If you reviewed it on a platform where reviews are public (OpenReview, ICLR, NeurIPS, ICML), you can paste yours below so the community can read it here.
Videos
No videos yet. Explain this paper in a talk, walkthrough, or lecture? Add one.
Taxonomy
TopicsPulmonary Hypertension Research and Treatments · Cardiovascular Function and Risk Factors · Cardiac Imaging and Diagnostics
1. Introduction
Right ventricular heart failure is the leading cause of death in patients with pulmonary arterial hypertension (PAH) [1]. The mechanisms of the RV maladaptation closely related to the cardiomyocyte metabolism changes [2]. Adenosine triphosphate deficiency with inefficient oxidative phosphorylation [3] leads to the shift from fatty acid oxidation to an anaerobic pathway of glycolysis in myocardium [4]. Reactive oxygen species and lactate alter the functioning of cellular structures, primarily mitochondria [5]. Thus, a vicious circle of discrepancy arises between the RV energy consumption and the possibility of its provision. Elevated cellular glucose consumption is a marker of increased metabolic demand. PET/CT with [18F]-FDG and [13N]-ammonia are the reference methods for myocardial metabolism and perfusion assessment. [18F]-FDG uptake in the RV myocardium has been tightly associated with the severity of PAH [4,6,7]. The high cost and the radiation exposure determine infrequent use of radionuclide methods for maladaptive remodeling assessment in patients with IPAH.
CPET is of great interest as it evaluates the adequacy of oxygen delivery and utilization by tissues [8], identifies the “suffering” system (cardiovascular, respiratory or muscular) and the mechanisms of compensation [9]. CPET indices closely correlate with hemodynamics and the right heart remodeling in patients with IPAH [10,11]. CPET is a perspective non-invasive diagnostic method for the risk assessment during follow-up in addition to the established ESC/ERS 2022 four-strata tools (PAH functional class (WHO), six minute walk test (6MWT) distance and N-terminal pro-brain-type natriuretic peptide (NT-proBNP)) [12]. No data regarding CPET and the RV metabolic and perfusion indices currently exist in IPAH patients.
We hypothesize that there is a close correlation between the RV myocardial metabolism and perfusion and CPET parameters depending on the current concept of PAH severity assessment.
The study aimed to evaluate the correlation between the CPET parameters and RV myocardial perfusion and metabolism using PET/CT with [13N]-ammonia and [18F]-fluorodeoxyglucose ([18F]-FDG) in IPAH patients. The relationships between the CPET parameters and the cardiac MRI, invasive hemodynamics were analyzed for the integrity of the study hypothesis.
2. Methods
2.1. Data Collection
According to the 2020 national guidelines for the management of pulmonary hypertension [13], the following hemodynamic criteria for PAH were used in the study: mean pulmonary artery pressure (PAP) ≥25 mmHg, pulmonary capillary wedge pressure (PCWP) < 15 mmHg, and pulmonary vascular resistance (PVR) ≥3 Wood units. Pulmonary arterial compliance (PAC) was calculated using invasive hemodynamic data obtained with the right heart catheterization (RHC), as follows: stroke volume/(systolic PAP-diastolic PAP) [14,15]. The exclusion criteria for the study were as follows: PAH, etiologies other than IPAH, moderate to severe lung disease (forced vital capacity <70%; forced expiratory volume in one second <80%; diffusion capacity of the lungs for carbon monoxide <40%), left heart disease, established malignancies, diabetes mellitus, thyroid disease, severe kidney or liver dysfunction, inflammatory diseases, and mental disorders.
All patients underwent standard evaluation with symptoms and demographics assessment; exercise tolerance, via 6MWT distance and CPET; RHC and N-terminal pro-brain-type natriuretic peptide (NT-proBNP); C-reactive protein (CRP); hemoglobin; and estimated glomerular filtration rate (eGFR), calculated according to the CKD-EPI equation. PET/CT with two radiopharmaceuticals, [13N]-ammonia and [18F]-fluordeoxiglucose ([18F]-FDG), was performed no later than 1 month after the RHC. Cardiac MRI was undertaken in all patients using a MAGNETOM Trio A Tim System 3 Tesla (Siemens AG, Erlangen Germany).
All patients underwent cardiopulmonary exercise testing (CPET) on a bicycle ergometer (Ebike, GE HealthCare, Milwaukee, WI, USA) with an increasing load of 10 W/min (RAMP protocol) until they achieved maximum tolerated exertion limited by symptoms. Gas exchange was measured by the respiratory cycle method using a calibrated Oxycon Pro device (Cardinal Health, Halberstadt, Germany).
ESC/ERS 2022 3-strata risk stratification was performed in all patients using an online calculator [https://www.pahinitiative.com/hcp/risk-assessment/calculators] (URL accessed on 14 January 2025).
2.2. PET/CT Protocol
Cardiac PET/CT («Discovery 710», GE Healthcare, Waukesha, WI, USA) with [18F]-FDG and [13N]-ammonia was performed in all patients in two separate days. Myocardial glucose metabolism was assessed by [18F]-FDG PET/CT. Patients fasted at least 6 h before the [18F]-FDG PET/CT procedure. The hyperinsulinemic euglycemic clamp was performed as described in the publication by R. A. De Fronzo (1979) [16]. A polyethylene cannula was inserted into the cubital vein to infuse insulin and 10% glucose solution through a three-way stopcock. Insulin was administrated at a constant rate of 40 mIU/min/m^2^. The rate of intravenous glucose infusion was adjusted manually. Glucose level in the blood was checked every 5 min. Stable euglycemia was considered to be achieved if three consecutive blood glucose measurements differed from each other within ±5%. Stable euglycemia was usually achieved 1 h after the start of insulin and glucose infusion. A standard dose of 5 MBq/kg (<550 MBq) [18F]-FDG was administered intravenously, when stable glycemia was established (optimal glycemia was 5 mmol/L). Cardiac PET/CT scans were acquired 40 min after [18F]-FDG intravenous administration in a static mode. Low dose CT scan was performed immediately prior to PET for attenuation correction. PET perfusion scanning was performed at rest, 5 min after intravenous administration of 10 MBq/kg [13N]-ammonia in a static mode immediately after low dose CT transmission.
The regions of interest (ROIs) of the left ventricle (LV) and RV myocardial uptake were identified visually. The regions of interest (ROIs) were drawn on the RV free wall, and LV lateral wall on the static transaxial images in order to measure the LV and RV myocardial uptake of both [18F]-FDG and [13N]-ammonia [7]. The maximal standardized uptake values of radiopharmaceuticals (SUVmax) were recorded in each ROI using AWS 4.6 software (GE Healthcare, USA). The right ventricular myocardium metabolism (SUVmax RV/LV metabolism) and perfusion (SUVmax RV/LV perfusion) were calculated as the ratio of SUVmax RV free wall and SUVmax LV lateral wall for the [18F]-FDG and [13N]-ammonia PET images, respectively. To assess the relationship between perfusion and metabolism in the right heart myocardium, the ratio of metabolism SUVmax RV/LV to perfusion SUVmax RV/LV was calculated.
The study was conducted in accordance with the Declaration of Helsinki and approved by the ethics committee of the center (protocol N 04-23, approved on 17 April 2023). Informed consent was obtained from all subjects participating in the study. Written informed consent was obtained from all patients for publication in the article.
2.3. Study Population
The study population comprised 34 adult (18–52 years old) Caucasian IPAH patients prospectively recruited in a single-PH referral center between February 2020 and October 2024. Patients were divided into three groups depending on ESC/ERS 2022 risk status: low risk (n=11), intermediate risk (n = 17) and high risk (n = 6) (Table 1). Twenty-eight incident patients underwent initial PAH diagnostics and were treatment naïve. Six prevalent patients were enrolled into the study within 6 to 12 months from the initial diagnosis of IPAH in the center. Three prevalent IPAH patients with positive acute vasoreactive testing (AVT) received calcium channel blockers (CCB). Two III–IV functional class (FC) (WHO) patients received triple combination therapy, including riociquate, sildenafil, macitentan, ambrisentan, iloprost and selexipag. One III FC patient received sildenafil and ambrisentan. Prevalent patients received CCB or PAH-specific therapy for at least three months after the diagnosis of IPAH was established. All procedures, including RHC, MRI and PET/CT, were undertaken on a background PAH therapy in prevalent patients. Acute vasoreactive testing was performed as a part of first follow-up assessment of CCB therapy efficacy in AVT positive prevalent patients according to the guideline [14,15]. Three-strata ESC/ERS 2022 risk stratification was performed in prevalent patients using all parameters obtained at the time of the study conduction. Survival data were not provided, as no deaths have been reported to date.
2.4. Statistical Analysis
Demography, PAH FC (WHO), smoking status, invasive hemodynamics, NT-proBNP, hemoglobin, CRP and eGFR, CPET, MRI parameters and PET/CT indices were compared in three risk groups. Variables were tested for normality, and numerical parameters with a normal distribution were presented as mean ± standard deviation (M ± SD), while numerical parameters with an abnormal distribution were presented as median and interquartile range (IQR; M ± 25%, 75%). Categorical variables were presented as absolute numbers and percentages and compared using Fisher’s exact test, as appropriate. The mean values of two groups were compared using the t-test and ANOVA test for comparison of means of three groups, as appropriate. Pearson’s correlation analysis was used to assess the direction and statistical strength between continuous variables. A statistically significant difference was determined with a two-tailed p value less than 0.05. We evaluated cardiac MRI and PET/CT parameters using univariate and multivariate linear regression analysis to determine the independent predictors for the peak oxygen (O_2_) consumption and minute ventilation per unit carbon dioxide production. The statistical analyses of the data were conducted with Statistica for Windows, version 10.0 (StatSoft: Tulsa, OK, USA).
3. Results
3.1. Patients’ Characteristics Depending on ESC/ERS Risk Status
Patients of the three ESC/ERS 2022 risk groups did not differ in age, body mass index, smoking, eGFR, or hemoglobin level. Low-risk patients differed significantly from the intermediate-to-high risk population in terms of exercise tolerance, hemodynamics and right heart remodeling, NT-proBNP level and RV myocardial metabolism, and perfusion. No significant difference was revealed between intermediate- and high-risk patients in FC (WHO), 6MWT distance and CPET parameters, cardiac MRI and hemodynamics (mean PAP, right atrial pressure, PCWP, PVR), arterial oxygen saturation, and RV myocardial metabolism and perfusion (Table 1).
No significant correlations were found between age and hemodynamics, RV ESV index, RV EF and LV SV index obtained using cardiac MRI, and PET/CT and CPET parameters (Table S1). No significant differences were registered between prevalent (n = 6) and incident patients in [18F]-FDG SUVmax RV/LV lateral wall (0.924 ± 0.476 vs. 0.825 ± 0.348, p = 0.5), [13N]-NH3 SUVmax RV/LV lateral wall (0.825 ± 0.176 vs. 0.815 ± 0.157, p = 0.8) and SUVmax 18F-FDG/SUVmax [13N]-NH3 RV/LV lateral wall (1.699 ± 0.967 vs. 1.381 ± 0.763, p = 0.4). Similar values of VO_2_ peak (12 [11.1; 18] vs. 14.5 [11.1; 17.9] mL/min/kg, p = 0.9), VO_2_ peak predicted (54.2 ± 31 vs. 54.5 ± 16.9%, p = 0.9) and VE/VCO_2_ (44.6 ± 9.6 vs. 49.7 ± 13.7, p = 0.4) were observed in prevalent and incident patients.
3.2. CPET Parameters According to the ESC/ERS 2022 Risk Status
Low-risk patients differed significantly in predicted workload, peak oxygen consumption in absolute (VO_2_ peak) and predicted values (%VO_2_ peak predicted), the ratio between oxygen consumption and workload (ΔVO_2_/ΔWR), and heart rate slope (HR/Vkg) when compared with the intermediate-to-high-risk patients, whereas no significant difference was observed between the intermediate- and high-risk groups (Table 1). No significant difference was registered in ventilatory equivalents, exercise desaturation and predicted breathing reserve (% BR predicted) between the three risk groups. Low-risk patients had significantly lower ventilatory equivalent for carbon dioxide on anaerobic threshold (VE/VCO_2_ AT) when compared with the intermediate- and high-risk patients.
3.3. Correlations Between CPET and Hemodynamics
Significant inverse correlations were identified between the mPAP and the workload, peak O_2_ consumption, oxygen pulse, and PetCO_2_, and a direct correlation was observed with VE/VCO_2_ (Table 2). No significant correlations were registered between mean RAP and CPET parameters. Significant positive correlations were recorded between cardiac index and the workload, VO_2_ peak, and oxygen pulse, and an inverse correlation was observed with the heart rate slope (HR/Vkg), VE/VCO_2_ and anaerobic work efficiency (ΔVO/ΔWR). A positive correlation was registered between the cardiac index and the PetCO_2_. A direct correlation was recorded between PAC and the predicted load, O_2_ consumption, oxygen pulse and PetCO_2_.
3.4. Correlations Between CPET and Cardiac MRI Parameters
We assessed the relationship between CPET parameters with established MRI determinants of prognosis in PAH patients, as follows: right ventricular end–systolic volume index (RV ESV index), left ventricular stroke volume index (LV SV index), and right ventricular ejection fraction (RV EF). In addition, we assessed the ratio of the RV ESV index/LV ESV index (Table 3, Figure 1).
A significant inverse correlation was registered between RV ESV index and the predicted workload, O_2_ consumption at peak of exertion, and at anaerobic threshold, PetCO_2_.
A significant positive correlation was found between the LV stroke volume index and predicted load, O_2_ consumption at peak of exertion and at anaerobic threshold, oxygen pulse, PetCO_2_ peak, and dO_2_/dW and an inverse correlation was observed with VE/VCO_2_.
No reliable correlations were found between the RV ejection fraction and the CPET indices.
The largest number of correlations were observed between the CPET parameters identified with the ratio of the RVESVindex/LVESVindex. Significant negative correlations were found between the ratio of the RVESVindex/LVESVindex and predicted workload, O_2_ consumption, oxygen pulse, PetCO_2_ and dO_2_/dW. A direct correlation was recorded between the RVESVindex/LVESVindex and VE/VCO_2_.
3.5. Correlations Between CPET Parameters and [18F]-FDG and [13N]-Ammonia RV Myocardial Uptake
Significant inverse correlations were registered between the SUVmax RV/LV metabolism and O_2_ consumption and PetCO_2_. Direct significant correlations were recorded between the RV/LV metabolism and VE/VCO_2_.
Significant inverse correlations were recorded between the values of the SUVmax RV/LV perfusion and workload, O_2_ consumption and PetCO_2_. Direct correlations were recorded between the value of the SUVmax RV/LV perfusion and the magnitude of dead space ventilation increase during exercise, heart rate slope and VE/CO_2_. The inverse correlation was observed between PetCO_2_ AT and the SUVmax RV/LV perfusion value.
A direct significant correlation was found between the ratio of metabolism to perfusion of the RV/LV myocardium and heart rate slope, and negative correlations were observed with workload and O_2_ consumption (Figure 1, Table 4).
3.6. Changes in [18F]-FDG and [13N]-Ammonia Uptake by the RV Myocardium Depending on Risk Categories of the Main CPET Determinants of Prognosis
The values of [18F]-FDG SUVmax RV/LV lateral wall and [13N]-NH3-ammonia SUVmax RV/LV lateral wall have not been validated in terms of the mortality risk scores in patients with PAH. Therefore, we divided patients into three risk groups for VO_2_ peak, %VO_2_ peak predicted, and VE/VCO_2_ according to the established ESC/ERS 2022 risk categories [14]. Given the small number of patients in the intermediate risk category for VO_2_ peak and VE/VCO_2_ (n = 4), intermediate- and high-risk patients were pooled and compared with low-risk patients (shown in Figure 2) (Table 5).
3.7. Peak Oxygen Consumption Category
Significant differences in [18F]-FDG and [13N]-ammonia uptake by the RV myocardium were observed between patients in the low and intermediate-to-high risk VO_2_ peak categories. No significant differences in perfusion and the ratio of metabolism to perfusion of the RV/LV myocardium were registered between the intermediate-risk and high-risk VO_2_ peak categories.
3.8. The Percent of Predicted Peak Oxygen Consumption Category
Significant differences in the SUVmax RV/LV metabolism were recorded between patients in the low and high-risk VO_2_ peak % predicted categories, as well as between intermediate- and high-risk categories, while the SUV max RV/LV metabolism did not differ significantly between patients in the low and intermediate-risk VO_2_ peak % predicted category.
The SUV max RV/LV perfusion differed significantly across all risk groups in the VO_2_ peak % predicted category.
No significant differences in the ratio of metabolism to perfusion of the RV/LV myocardium were found depending on the risk category of the peak VO_2_% predicted (Table 5).
3.9. The Ratio of Minute Ventilation to Carbon Dioxide Production Category
There was a significant difference in SUVmax RV/LV metabolism and SUV max RV/LV perfusion between low and high-risk VE/VCO_2_ category patients. The ratio of metabolism to perfusion of the RV/LV myocardium did not differ significantly between VE/VCO_2_ risk categories (Table 5).
3.10. The Mean Values of [18F]-FDG and [13N]-Ammonia Uptake by the RV Myocardium Depending on the Risk Status and CPET Categories
The mean value of SUVmax RV/LV for [18F]-FDG PET/CT was 0.581 ± 0.39 in the low-risk group and ranged from 0.59 to 0.6 depending on prognostic parameters of CPET (peak VO_2_, peakVO_2_% predicted, VE/VCO_2_). The mean value of SUVmax RV/LV for [18F]-FDG PET/CT ranged from 0.996 ± 0.27 in the intermediate-to-high ESC/ERS 2022 risk cohort and was within the same limits while using intermediate-to-high risk categories for peak VO_2_, peakVO_2_% predicted, and VE/VCO_2_.
The mean value of SUVmax RV/LV for [13N]-ammonia PET/CT was 0.758 ± 0.153 and 0.815–0.862 in the low-risk ESC/ERS 2022 group and in the low-risk category of CPET indicators, respectively. The mean value of SUVmax_RV/LV_ for [13N]-ammonia PET/CT ranged around 0.852 ± 0.151 in the intermediate-to-high ESC/ERS 2022 risk cohort and was within the same limits while using the intermediate-to-high risk categories of peak VO_2_, peak VO_2_% predicted, and VE/VCO_2_.
The ratio of metabolism to perfusion of the RV/LV myocardium was 0.786 ± 0.321 in low-risk patients according to the ESC/ERS 2022 scale and varied, depending on the CPET parameters, from 1.08 to 1.2. The mean value of the ratio of metabolism to perfusion of the RV/LV myocardium was in the range of 1.797 ± 0.751 in patients with intermediate-to-high risk of the ESC/ERS 2022 scale and for CPET indicators of −1.6–2.0.
Thus, the mean values of SUVmax RV/LV for [18F]-FDG and [13N]-ammonia were within the same limits when using ESC/ERS 2022 risk scale or CPET indicators alone (Figure 2 and Figure 3).
3.11. PET/CT and MRI Predictores for the Peak Oxygen Consumption and Minute Ventilation per Unit Carbon Dioxide Production
Peak O_2_ consumption was significantly associated with myocardial RV uptake with [18F]-FDG, the ratio of metabolism to perfusion of RV, RV ejection fraction, the ratio of indices RV ESV/LV ESV and LV stroke volume index, according to the univariate regression analysis. Myocardial RV uptake with [18F]-FDG was the independent predictor of peak O_2_ consumption according to the multivariate linear regression analysis (OR-6.5, 95% CI (−11.5–1.25), p = 0.016). Minute ventilation per unit carbon dioxide production was significantly associated with the RV metabolism and perfusion according to the univariate regression analysis, but no independent predictor was determined with miltivriate analysis (Table 6).
4. Discussion
For the first time, the relationship between CPET and RV myocardial metabolism and perfusion indices has been presented in patients with IPAH without comorbidities.
Cardiac output increase in response to metabolic demand is one of the main determinants of exercise capacity. Pulmonary microvasculature recruitment and PVR decrease provide adequate cardiac output and oxygen delivery to tissues during physical exertion under physiological conditions [17]. Pulmonary arterial pressure and PVR elevation accompanied by RV hypertrophy with subsequent RV dilation and decreased myocardial contractility leads to RV–PA uncoupling. [18,19]. LV underfilling and low stroke volume invariably result in low tissue perfusion, compensatory high tissue oxygen extraction and a metabolic shift towards anaerobic oxidation [8]. Hyperventilation with PETCO_2_ decrease, elevation of VE/VCO_2_ and dead space ventilation are the typical features of respiratory compensation in patients with IPAH [20].
The present study confirmed the close correlations between hemodynamics, RV myocardial remodeling and CPET parameters, and this is consistent with previously published studies [8,20,21]. We did not find any significant correlations between CPET parameters and RV ejection fraction, which might be due to the small patient population and a wide range of intermediate-risk limits for the RV ejection fraction [13,22,23,24,25]. The largest number of correlations between the CPET parameters were identified with the ratio of the RVESV index/LVESV index. The RV/LV volumes ratio was not included in the risk scale stratification [14], though this parameter reliably reflects the severity of RV remodeling and the LV compression in patients with PAH.
High glucose consumption and an early transition to the anaerobic pathway of glycolysis were determined in myocardium in a pressure overload state [25,26]. A close correlation between the RV myocardial metabolism and perfusion parameters and mean PAP, PVR, cardiac output, and RV remodeling was demonstrated in patients with PAH [7,27]. Changes in RV myocardial metabolism were observed even in a slight mPAP and PVR elevation in patients with IPAH. Increased metabolic demand was compensated by perfusion augmentation of the RV myocardium in low-risk IPAH patients with mild PVR elevation and slight RV myocardial remodeling [7]. However, the RV metabolism-to-perfusion ratio dramatically increased in intermediate- and high-risk IPAH patients with severe hemodynamic changes and RV remodeling. In the present study, the rise of [18F]-FDG and [13N]-ammonia uptake by the RV myocardium was accompanied with a decrease in workload, VO_2_ peak, oxygen delivery and an increase of the ratio of minute ventilation to carbon dioxide production depending on the risk status.
The identification of low-risk IPAH patients is the most important task according to the current concept of PAH management. Obtaining a true low-risk profile of an IPAH patient using RV molecular imaging is of paramount importance. Data regarding changes of [13N]-ammonia and [18F]-FDG uptake by RV myocardium, depending on the risk status and the severity of PAH, are scarce [7,28], while the prognostic values of the main CPET indicators are well defined within the ESC/ERS 2022 risk scale [12,13,14]. Thus, we assessed the mean values of [18F]-FDG and [13N]-ammonia uptake by RV myocardium in terms of ESC/ERS risk categories and separately in terms of established prognostic CPET indices (peak VO_2_, peak VO_2_% predicted, VE/VCO_2_). The values of the RV myocardium metabolism and perfusion differed significantly between low- and intermediate-to-high risk IPAH patients in terms of different CPET parameters. Whereas, the intermediate- and high-risk groups did not exhibit significant differences in CPET and PET/CT data, which might be due to the small sample of high-risk patients (n = 6). The RV metabolism-to-perfusion ratio was numerically lower in patients with low-risk CPET indicators in comparison with those with intermediate-to-high risk. Similar values of the RV myocardium [18F]-FDG and [13N]-ammonia uptake were observed in between the risk categories derived from the ESC/ERS 2022 scale and the risk categories of the main CPET indicators.
The mean values of [18F]-FDG and [13N]-ammonia RV myocardial uptake were another topic of interest. The higher SUVmax RV/LV metabolism value was recorded in low-risk patients in the present study, which stands in comparison with our previously published data (0.581 ± 0.39 vs. 0.38 ± 0.09) in patients with IPAH [7]. The SUVmax RV/LV perfusion was only slightly higher in low-risk patients in the present study when compared with those in the previously published study (0.74 ± 0.15 vs. 0.65 ± 0.06), and did not differ in intermediate-risk (0.86 ± 0.14 vs. 0.85 ± 0.15) and high-risk patients (0.79 ± 0.2 vs. 0.79 ± 0.18) between studies. A higher ratio of metabolism to perfusion of the RV/LV myocardium was recorded in the present study compared with the previous one, especially in the low-risk group (0.78 ± 0.32 vs. 0.69 ± 0.27). The differences in mean values of SUVmax RV/LV metabolism and perfusion in low-risk patients between the two studies were likely due to a larger number of low-risk patients (n = 11 vs. n = 6), more severe hemodynamic signs of pulmonary vascular disease (PVR 5.5 [3.9; 7.2] vs. 3.9 [3.1; 5.4] WU; mPAP 40.8 ± 3.9 vs. 30.8 ± 8.3 mm Hg) and more pronounced RV myocardial remodeling (RV ESVi 43.9 ± 12.3 vs. 36.0 ± 8.0 mL/m^2^). The obtained results demonstrate the high heterogeneity of the SUVmax RV/LV metabolism in patients within the low-risk group. PET/CT studies have not been implemented into clinical practice for PAH patients yet, due to their unclear practical significance. Our observation needs further data accumulation and analysis in terms of the interconnection between RV metabolism and perfusion and hemodynamics, cardiac remodeling and outcome in IPAH patients. No specific drugs that target RV myocardium in PAH currently exist. The approved PAH-specific medicines realize positive remodeling and metabolic effect on the RV through mPAP decrease, which has been confirmed by R. Kazimierczyk et al. (2023) [28]. RV metabolism molecular imaging using PET/CT might be essential for the formation of new treatment goals and the creation of new drugs.
We have clearly demonstrated significant correlations between CPET parameters and hemodynamics, and cardiac MRI, consistent with previous studies [10,29,30]. The established interconnection between CPET parameters and RV metabolism is of paramount importance, as the molecular changes preclude clinical manifestation and are tightly connected with hemodynamics in IPAH patients [22,25,27]. The initial strategy and the first six months of IPAH patient management might determine the course of the disease [31]. We suggest that CPET might be an excellent non-invasive diagnostic tool for low-risk status confirmation in young IPAH patients without comorbidities.
5. Conclusions
Right ventricular [18F]-FDG myocardial uptake was found to be an independent predictor of peak oxygen consumption in IPAH patients without comorbidities.
CPET has proven to be a reliable non-invasive tool for the differentiation of IPAH patients without comorbidities with a low-risk status and those with an intermediate-to-high risk status.
The accumulation of data on the right ventricular myocardial metabolism in comparison with traditional invasive and non-invasive methods for PAH severity assessment requires prospective validation in a larger cohort of patients with IPAH.
Limitations
The sample size was small (n = 34), with only six patients in the high-risk group, potentially affecting statistical power (e.g., the lack of significant differences between intermediate- and high-risk groups).
The prognostic value of PET/CT and CPET parameters could not be assessed due to an insufficient observation period.
The reference list from the paper itself. Each links out to its DOI / PubMed record.
- 1Sanders J.L. Koestenberger M. Rosenkranz S. Maron B.A. Right ventricular dysfunction and long-term risk of death Cardiovasc. Diagn. Ther.2020101646165810.21037/cdt-20-45033224778 PMC 7666957 · doi ↗ · pubmed ↗
- 2Tuomainen T. Tavi P. The role of cardiac energy metabolism in cardiac hypertrophy and failure Exp. Cell Res.2017360121810.1016/j.yexcr.2017.03.05228344054 · doi ↗ · pubmed ↗
- 3Real C. Pérez-García C.N. Galán-Arriola C. García-Lunar I. García-Álvarez A. Right ventricular dysfunction: Pathophysiology; experimental models; evaluation; treatment Rev. Esp. Cardiol. (Engl. Ed.)20247795797010.1016/j.recesp.2024.05.01739068988 · doi ↗ · pubmed ↗
- 4Agrawal V. Lahm T. Hansmann G. Hemnes A.R. Molecular mechanisms of right ventricular dysfunction in pulmonary arterial hypertension: Focus on the coronary vasculature, sex hormones, and glucose/lipid metabolism Cardiovasc. Diagn. Ther.2020101522154010.21037/cdt-20-40433224772 PMC 7666935 · doi ↗ · pubmed ↗
- 5García-Lunar I. Jorge I. Sáiz J. Solanes N. Dantas A.P. Rodríguez-Arias J.J. Ascaso M. Galán-Arriola C. Jiménez F.R. Sandoval E. Metabolic changes contribute to maladaptive right ventricular hypertrophy in pulmonary hypertension beyond pressure overload: An integrative imaging and omics investigation Basic Res. Cardiol.202411941943310.1007/s 00395-024-01041-538536505 PMC 11143050 · doi ↗ · pubmed ↗
- 6Sumer C. Okumus G. Isik E.G. Turkmen C. Bilge A.K. Inanc M. (18)F-fluorodeoxyglucose uptake by positron emission tomography in patients with IPAH and CTEPH Pulm. Circ.202414 e 1236310.1002/pul 2.1236338618292 PMC 11009453 · doi ↗ · pubmed ↗
- 7Goncharova N. Ryzhkova D. Lapshin K. Ryzhkov A. Malanova A. Andreeva E. Moiseeva O. PET/CT Imaging of the Right Heart Perfusion and Glucose Metabolism Depending on a Risk Status in Patients with Idiopathic Pulmonary Arterial Hypertension Pulm Circ.202515 e 7004210.1002/pul 2.7004239845891 PMC 11751710 · doi ↗ · pubmed ↗
- 8Dumitrescu D. Sitbon O. Weatherald J. Howard L.S. Exertional dyspnoea in pulmonary arterial hypertension Eur. Respir. Rev.20172617003910.1183/16000617.0039-201728877974 PMC 9488798 · doi ↗ · pubmed ↗