Mitogenomic Insights into Phylogeny, Biogeography and Adaptive Evolution of the Genus Typhlomys (Rodentia: Platacanthomyidae)
Chao Na, Xiaohan Wang, Yaxin Cheng, Yixin Huang, Shuiwang He, Laxman Khanal, Shunde Chen, Xuelong Jiang, Zhongzheng Chen

TL;DR
This study uses mitochondrial genomes to explore the evolutionary history and adaptations of soft-furred tree mice in southern China and northern Vietnam.
Contribution
The study provides new insights into the phylogeny, biogeography, and adaptive evolution of the genus Typhlomys using complete mitogenome data.
Findings
Typhlomys mitogenomes show stable genetic structures with variations in genome size and two distinct clades.
The genus likely originated in Central or Southwestern China.
The ND5 gene in T. huangshanensis shows signs of positive selection for adaptation to cold, high-elevation environments.
Abstract
The genus Typhlomys includes small rodents from southern China and northern Vietnam known for their echolocation abilities. However, little is known about their taxonomy, life history, and environmental adaptations. This study analyzed the mitochondrial genomes of seven Typhlomys species to explore their phylogenetic relationships, origin, and adaptive traits. Results show stable genetic structures with variations in genome size and two distinct clades, including a potential new species. The genus likely originated in Central or southwestern China. Additionally, the ND5 gene in Typhlomys huangshanensis shows signs of positive selection, indicating adaptation to colder environments of higher elevation in the northernmost distribution limit of the genus. These findings enhance our understanding of Typhlomys and support conservation efforts. Soft-furred tree mice (genus Typhlomys), which…
Genes, proteins, chemicals, diseases, species, mutations and cell lines named across the full text — each resolved to its canonical identifier and authoritative record.
Click any figure to enlarge with its caption.
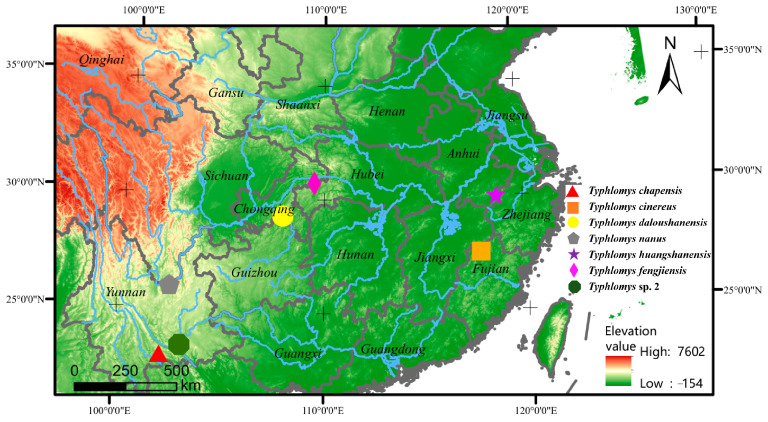 Figure 1
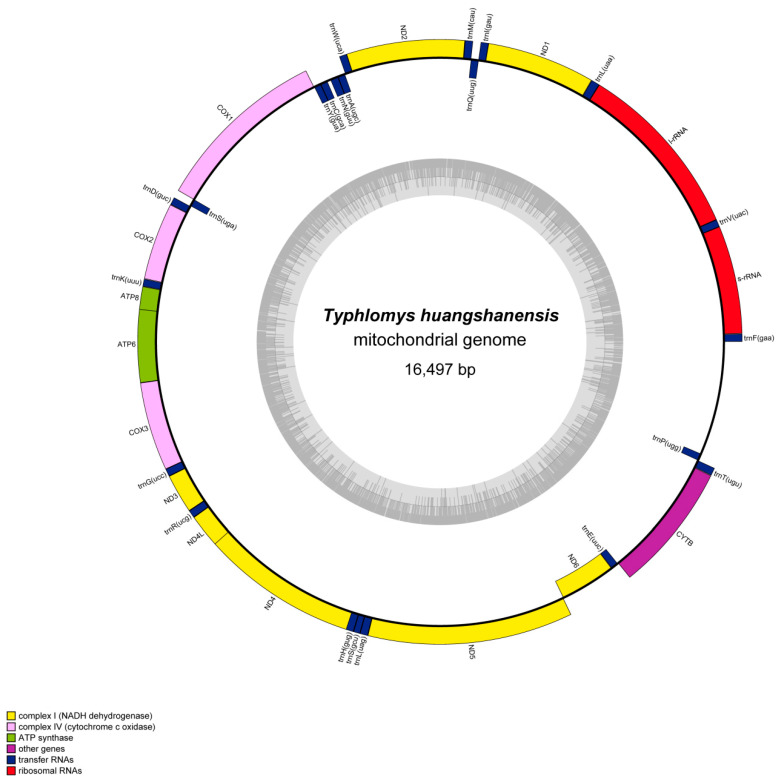 Figure 2
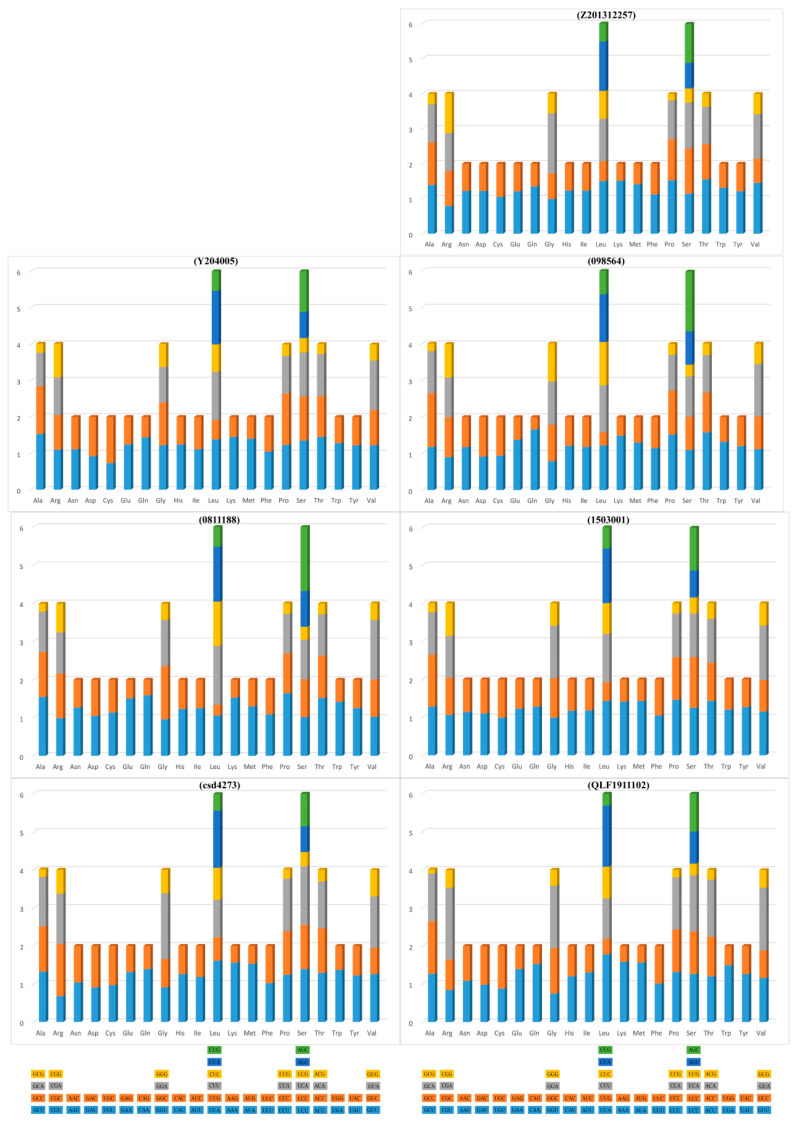 Figure 3
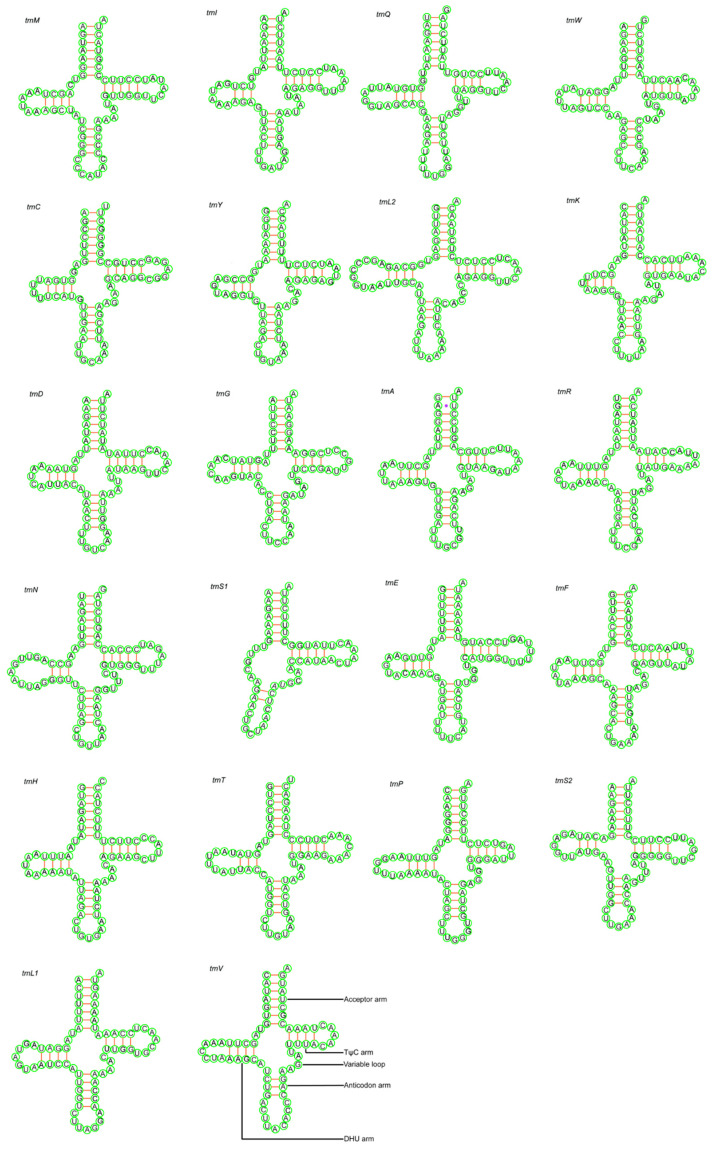 Figure 4
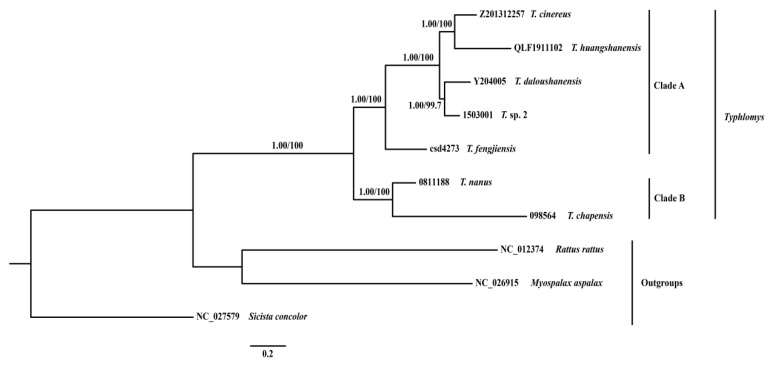 Figure 5
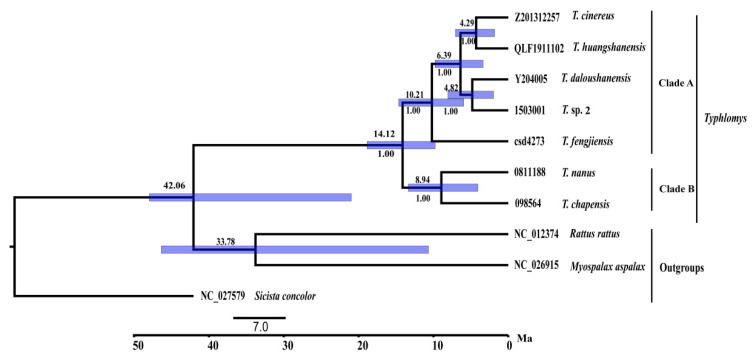 Figure 6
 Figure 7
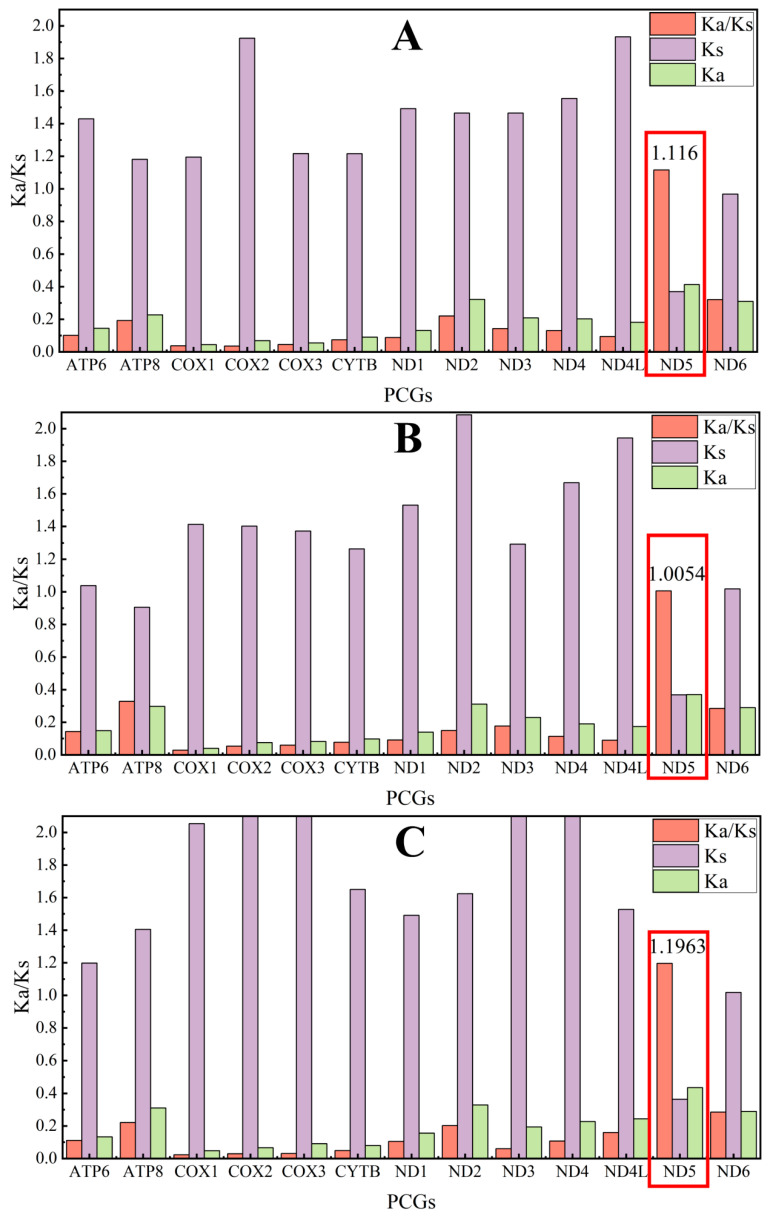 Figure 8
- —University Synergy Innovation Program of Anhui Province
Peer Reviews
No public reviews on file for this paper yet. If you reviewed it on a platform where reviews are public (OpenReview, ICLR, NeurIPS, ICML), you can paste yours below so the community can read it here.
Videos
No videos yet. Explain this paper in a talk, walkthrough, or lecture? Add one.
Taxonomy
TopicsGenomics and Phylogenetic Studies · Genetic diversity and population structure · Evolution and Paleontology Studies
1. Introduction
The soft-furred tree mice of the genus Typhlomys are a relict group within the family Platacanthomyidae [1]. This genus is notable among rodents, as it is currently the only known rodent taxon capable of echolocation [2,3]. Typhlomys is characterized by its small eyes and a distinctive terminal brush at the end of its tail [4]. These mice are known for their arboreal and burrowing lifestyle [5,6,7], and are mainly distributed in high mountain forests of southwestern China and northwestern Vietnam [4,8,9]. Among the seven species examined in this study namely: T. chapensis, T. nanus, and a putative species (T. sp. 2) inhabit temperate montane mixed forests with a humid climate, with habitats dependent on high-altitude bamboo groves, cave systems, and hollow trees. T. fengjiensis and T. daloushanensis occur in humid montane climates, which are characterized by hot-humid summers, mild winters, and high annual precipitation [9]. T. cinereus resides in ecotones between subtropical evergreen broad-leaved forests and bamboo groves, relying on thick leaf litter layers, rock crevices, and tree hollows, and its habitat is characterized by consistently high humidity [10]. T. huangshanensis inhabits mixed forests of Chinese red pines (Pinus hwangshanensis) and bamboo groves, showing high dependence on rock crevices and tree hollows; its habitat is characterized by year-round cloud cover and high humidity. Speciation among distinct species of this genus may be attributed to factors such as complex topography and climate. The type species of the genus, Typhlomys cinereus, was described by Milne-Edwards (1877) [11] based on the specimens collected from Guadun in Fujian Province in south China. Typhlomys was considered a monotypic genus for a long time, but in recent years there have been remarkable changes in its taxonomic understanding [4,7,9]. Currently, the genus contains seven established species: T. chapensis, T. cinereus, T. daloushanensis, T. nanus, T. huangshanensis, T. fengjiensis, T. taxuansis, and one putative species from Mt. Laojun and Dawei in Yunnan Province (Typhlomys sp. 2 hereafter) [4,7,9,12]. To date, studies on Typhlomys are mainly focused on taxonomy; however, the phylogenetic relationships of some species are still unresolved [7,9] and little is known about their ecology and natural history.
Mitochondrial genomes are widely used in the study of population genetic structure and the reconstruction of phylogenetic relationships because of their simple structure, short length, fast evolutionary rate and matrilineal inheritance. One of the functions of mitochondria is to supply energy by serving as an important site for the oxidative phosphorylation system (OXPHOS), which makes them highly sensitive to energy-related selective pressures. Approximately 95% of the energy demand for animals to engage in locomotion is produced via the mitochondrial respiratory chain. The 13 PCGs (protein-coding genes) are closely related to the process of OXPHOS, and thus these subunits are constantly under positive or negative selective pressure [13]. Many previous studies have detected positive selection signals in mitochondrial genes [12,14,15,16], indicating that positive selection plays a strong role in species adaptation. However, studies on the mitochondrial genome of Typhlomys are scarce, only one incomplete mitogenome of Typhlomys cinereus is available in NCBI GenBank [17] (GenBank accession no. KX397283).
In the current study, we performed a comparative mitogenomic analysis on the genus Typhlomys to (1) characterize the features and distinct nucleotide patterns in their mitochondrial genomes; (2) reconstruct the phylogeny based on mitochondrial genes and estimate the divergence time and the biogeographical history; and (3) detect whether there is any adaptive selection of the mitochondrial genes.
2. Materials and Methods
2.1. Sampling and DNA Extraction
Seven specimens representing six recognized species and one putative species of Typhlomys were collected from Yunnan, Anhui, Fujian, and Chongqing in China (Figure 1, Table 1). Muscle tissues were sampled and stored in 99.99% ethanol for molecular studies. Total genomic DNA was extracted from the preserved samples using the Qiagen DNeasy Blood and Tissue Kits (Qiagen China, Shanghai, China).
2.2. Sequencing and Assembly
After quantification of the extracted DNA, we employed two strategies to obtain the mitochondrial genome of Typhlomys species. Four of them (T. daloushanensis, T. cinereus, T. nanus, T. sp. 2) were obtained using a long-range PCR and cross-species hybridization capture following the method described by Chen et al. [18], and the other two (T. chapensis and T. huangshanensis) were obtained using the next-generation sequencing (NGS) on an Illumina Novaseq platform with a strategy of 150bp paired-ends [19]. The assembly of the mitochondrial genome was performed using Novoplasty 4.3.1 [20].
2.3. Mitochondrial Genome Annotation
Twenty-two tRNA genes were identified with the use of MITOS WebServer (http://mitos.bioinf.uni-leipzig.de, accessed on 29 November 2023), setting the parameters with the Vertebrate Mito genetic code [21]. Their secondary structures were plotted manually from the MITOS predictions using Adobe Illustrator. Every sequence of tRNA genes was manually checked separately. Protein-coding genes (PCGs) were identified as open reading frames corresponding to the 13 PCGs in the metazoan mitochondrial genome. The rRNA genes and control region were identified by the boundaries of the tRNA genes.
2.4. Comparative Analysis
Base composition and relative synonymous codon usage (RSCU) were calculated using MEGA 11 [22]. The relative composition of different bases was measured in terms of GC and AT skews according to the formulae suggested by Hassanin et al. [23]: GC-skew = (G − C)/(G + C) and AT-skew = (A − T)/(A + T). The number of synonymous substitutions per synonymous site (Ks) and the non-synonymous substitutions per non-synonymous site (Ka) for each of the concatenated 13 PCGs of the Typhlomys mitogenomes were calculated by DnaSP v.6.12.03 [24].
2.5. Phylogenetic Analysis
We performed maximum likelihood (ML) and Bayesian inference (BI) analyses to reconstruct the phylogenetic relationships of Typhlomys. The mitogenomes of Rattus rattus, Myosplax aspalax and Sicista concolor were downloaded from GenBank and used as outgroups. The ML and BI analyses were conducted on the concatenated dataset of 13 PCGs and two rRNA using IQ-TREE [25] and MrBayes [26], respectively, in PhyloSuite [27]. The best-fit partitioning scheme and evolutionary substitution models were estimated using PartitionFinder 2 [28] under the Bayesian Information Criterion (BIC, Supplementary Table S13). FigTree v. 1.4.4 [29] was used to visualize the resulting trees.
2.6. Divergence Time Estimation
We estimated divergence times of Typhlomys based on the concatenated dataset of 13 PCGs and two rRNA in BEAST 2.6 [30]. We defined data blocks based on genes and codon positions, and the best-fit partitioning scheme and substitution models using PartitionFinder 2. Divergence dates were calibrated based on two secondary calibration points: (1) the split of the most recent common ancestor Myomorpha is estimated at about 45.0 Ma [31], we established the prior using an exponential distribution prior (mean = 4.64, offset = 45.0) following Cheng et al. [4], and (2) the most recent common ancestor of Typhlomys is estimated at about 12.6 Ma ((95% CI = 8.9–16.09) [4]; we established the prior using a lognormal distribution (mean:12.5, standard deviation: 0.19, offset: 0), such that the median age was at 12.5 Ma and the 95% Cl was 8.98–16.8 Ma. We repeated the analysis twice; each analysis consisted of 100 million generations and sampled every 10,000 generations. The first 10% of the generations were discarded as burn-in. Convergence was assessed using Tracer v1.7.2 [32] and effective sample size values greater than 200 were considered adequate.
2.7. Ancestral Distribution Analysis
To investigate the biogeographical history of Typhlomys, we reconstructed the ancestral distribution of Typhlomys using BioGeoBEARS (implemented in RASP 4.3) [33]. The DIVALIKE model was used in our analysis due to its highest AICc_wt among the six candidate models (i.e., DEC, DEC+j, DIVALIKE, DIVALIKE+J, BAYAREALIKE, and BAYAREALIKE+J) [34,35,36]. Four geographical regions were determined in the analysis of ancestral distributions: (A) Central China; (B) Southwestern China and Northern Vietnam; (C) Eastern China; (D) Southern China. The coalescent-based Bayesian phylogenetic tree was used as the base topology. The other settings applied the default values of the software.
2.8. Selection Pressure Analysis
We used the ratio of non-synonymous/synonymous substitution ratio (Ka/Ks) to estimate sequence evolution following Wang et al. [37]. Values of Ka/Ks > 1 imply the presence of positive selection; Ka/Ks = 1 imply neutrality; and Ka/Ks < 1 indicating the presence of purifying selection [38]. To ensure an accurate and unbiased comparison, we used Rattus rattus, Myosplax aspalax and Sicista concolor as reference sequences to calculate Ka/Ks ratios for each PCG. For the selection analysis of the 13 PCGs, the stop codon was removed, and the NADH dehydrogenase 6 (ND6) sequence was reverse complemented because ND6 is on the minority-strand (N-strand). The overlapping regions (43 bp of ATP8/ATP6 and 7 bp of ND4L/ND4) were included twice in the comparison to enable analysis of all codons.
3. Results
3.1. Genome Structure and Organization
Mitogenome lengths of Typhlomys ranged from 16,490 bp in T. sp. 2 to 17,380 bp in T. chapensis (Table 2). All of them contained the complete set of 37 genes common to mammalian mitogenomes, including 13 protein-coding genes (PCGs), 22 transfer RNA (tRNA) genes and two ribosomal RNA (rRNA) genes. There are 28 genes (12 PCGs, 14 tRNAs and 2 rRNAs) encoded by the H-strand, and 9 genes (1 PCG and 8 tRNAs) encoded by the L-strand, making the entire genome a typical double-stranded circular molecular structure (Figure 2, Supplementary Figures S1–S6). The gene arrangement, organization, and content within the mitogenomes were in line with those of other rodent mitogenomes.
The nucleotide composition of all the mitogenomes had a high A+T content, with an average of 63.1%, showing a strong A/T bias (Table 2). Among the mitogenomes, T. cinereus had the highest A+T content (64.6%) whereas T. chapensis had the lowest (60.6%). For the whole mitochondrial genome, all AT-skews were positive, ranging from 6.36% (T. huangshanensis) to 10.4% (T. chapensis) and while all GC-skews were negative, ranging from −36.4% (T. daloushanensis) to −34.7% (T. huangshanensis), indicating that the mitogenomes of Typhlomys were biased toward A and T.
3.2. Protein-Coding Genes (PCGs)
The 13 PCGs of Typhlomys mitogenomes contain three cytochrome c oxidase subunits, seven NADH dehydrogenase subunits, two ATPase subunits and one cytochrome b gene, which is similar to other mammals in Rodentia. Most PCGs start with ATG and end with TAA (Table 3, Supplementary Tables S7–S12). While a few PCGs in the mitogenomes use ATT, ATA, CCT, and GTG as the start codon, and TAG, AGG, TTA, and CAT as termination codon.
The average A+T content of PCGs in Typhlomys is 62.4%. To further investigate this high A and T content and the frequency of synonymous codon usage, we calculated the relative synonymous codon usage (RSCU) values. The relative synonymous codon usage (RSCU) of Typhlomys is shown in Figure 3. Overall, the most frequently used codons were CUA (Leu), AGC (Ser), GGA (Gly) and UUA (Leu), whereas codons ending in G or C, UUG, CUG, CGU and GCG were the less frequently used codons. The predominance of codons ending in A or T leads, at least in part, to a preference for A and T.
3.3. Ribosomal RNA and Transfer RNA
The full length of rRNA genes was between 2525 and 2540 bp and consist of two subunits, 12S rRNA (955–966 bp) and 16S rRNA (1570–1575 bp). The nucleotide composition of 12S rRNA and 16S rRNA is skewed with respect to the A+T content. The AT-skew of 12S rRNA and 16S rRNA were positive, while the GC-skew was negative, suggesting that adenine and cytosine are relatively more prevalent in rRNA than thymine and guanine (Table 4, Supplementary Tables S1–S6). There were 22 tRNA genes in the mitochondrial genome, most of which were encoded by the H-strand (trnF, trnV, trnL 2, trnI, trnM, trnW, trnD, trnK, trnG, trnR, trnH, trnS 1, trnL 1, trnT), while the trnQ, trnA, trnN, trnC, trnY, trnS 2, trnE, and trnP were encoded by the L-strand. All tRNA genes exhibit a cloverleaf secondary structure, except for trnS 1, which lack a stabilizing dihydrouridine arm loop (Figure 4, Supplementary Figures S7–S12). For tRNAs, the AT skewness is positive, and the GC skewness is negative, again indicating that adenine and cytosine are relatively more prevalent in rRNAs than thymine and guanine.
3.4. Overlapping and Intergenic Spacer Regions
We observed a total of 105 intergenic spacer, ranging in size from 1 to 335 bp, in the mitochondrial genomes of Typhlomys. The longest intergenic spacer (335 bp) was observed in T. daloushanensis, between the trnP and trnF genes (Table 3, Supplementary Tables S7–S12).
In all species of Typhlomys, there were 69 overlapping gene regions with lengths ranging from 1 to 43 bp. The longest overlapping sequence in each genome was between ATP8 and ATP6, 43 bp. The number of gene overlaps ranged from 9 to 10 among different species, and the total length was 61–74 bp.
3.5. A+T Rich Region
The A+T-rich region, also known as the control region, is positioned between the tRNAs trnP and trnF. The lengths of the control region ranged between 625 bp in T. fengjiensis and 1064 bp in T. huangshanensis (Table 4, Supplementary Tables S1–S6). The A+T content of control region of the seven species ranged from 62.2% (T. chapensis) to 69.5% (T. huangshanensis).
3.6. Phylogenetic Analyses
We considered posterior probabilities (PP) ≥ 0.95, SH-like approximate likelihood-ratio test values (SH-aLRT) ≥ 80 and ultrafast bootstrap supports (UFBoot) ≥ 95 as strong support [36]. The Bayesian inference and maximum likelihood phylogenetic trees showed similar topologies (Figure 5). All seven species/putative species of Typhlomys were well supported in the phylogenetic trees (PP > 0.99, UFBoot = 10,000, SH-aLRT = 1000). The seven species under the genus Typhlomys were divided into two clades. One clade comprises T. cinereus, T. huangshanensis, T. daloushanensis, T. fengjiensis and T. sp. 2 (Clade A), and the other comprises T. chapensis and T. nanus (Clade B). Typhlomys fengjiensis was revealed in a basal position of Clade A and was sister to the rest species in the clade (PP > 0.99, UFBoot = 10,000, SH-aLRT = 1000).
The divergence time analyses showed divergence within Typhlomys started during the middle Miocene at about 14.12 Ma (95% CI = 9.77–18.87 Ma), with the remaining species diverging between 4.29 and 10.21 Ma (95% CI = 1.84–14.65 Ma) (Figure 6).
3.7. Ancestral Distributions
Based on AICc model comparisons, the DIVALIKE model demonstrated an optimal fit to our dataset under the “BioGeoBEARS” framework (AICc_wt = 0.42; Supplementary Table S14). Results revealed that the ancestral distribution of Typhlomys most likely originated in the Central and Southwestern China (regions A and B) with a probability of 87.12% (Figure 7). Furthermore, the origin of T. chapensis and T. nanus most likely occurred in Southwestern China (region B), supported by 100% probability. The ancestor of the T. cinereus, T. huangshanensis, T. daloushanensis, T. fengjiensis and T. sp. 2 potentially occurred in the area around Central China (region A), with a probability of 77.47%.
3.8. Selection Pressure in Mitochondrial Genes
Selection pressure analyses were conducted using Rattus rattus, Myospalax aspalax, and Sicista concolor as outgroups. All the results showed that Ka/Ks of ND5 > 1 in T. huangshanensis (Figure 8). It indicated that the ND5 gene which codes for ND5 protein, an enzyme complex in the mitochondria that is responsible for electron transport generating ATP was subjected to positive selection. The remaining 12 PCGs of T. huangshanensis, as well as the 13 PCGs of the other six Typhlomys, had the Ka/Ks < 1, indicating that they were subjected to purifying selection.
4. Discussion
In this study, we present a comparative analysis of the mitochondrial genomes of the species under the genus Typhlomys. We sequenced the mitogenomes of six recognized and one putative species of Typhlomys and analyzed their composition and evolutionary relationships. The gene arrangement, organization, and content of the seven mitochondrial genomes is like that of other mammals [39], illustrating the highly conserved nature of the mammalian mitochondrial genome. The size of the mitogenomes varied among the examined species, ranging from 16,487 bp in T. fengjiensis to 17,380 bp in T. chapensis. Compared with other species, the length of T. chapensis mitochondrial genome is longer by approximately 800 bp (Supplementary Table S15) mainly due to longer (1935 bp) D-loop region of the species. D-loop region is the largest non-coding region, located between trnP and trnF in these mitogenomes, which is supposed to contain regulatory elements related to the control of replication and transcription [40], and is frequently used in vertebrate phylogenetic and phylogeographic studies due to higher rates of mutation in comparison to the coding regions [41].
It is suggested that the variation in codon usage bias intensity among taxa is dictated by the variation in selective pressure [42,43]. The relative synonymous codon usage (RSCU) and codon distribution of the seven mitochondrial genomes showed that CUA (Leu), AGC (Ser), GGA (Gly) and UUA (Leu) are the most prevalently used codons, and on the other hand, codons UUG, CUG, CGU and GCG which terminate with G or C are less frequently utilized. Additionally, the codons exhibited a preference for A/T over G/C, thereby causing the A+T content to be greater than the G+C content in the PCGs. GC pairs are considered more stable than AT pairs, and thus high AT content of Typhlomys may produce more active structures that accumulate evolutionary adaptations [44].
Consistent with Pu et al. [9], our phylogenetic tree constructed on the concatenated dataset of 13 PCGs and two rRNA supported seven species of Typhlomys clustered into two major clades; one clade was formed by T. cinereus, T. huangshanensis, T. daloushanensis, T. fengjiensis and T. sp. 2 (Clade A); the other clade comprised T. chapensis and T. nanus (Clade B), the two are sister groups to each other. Pu et al. [9] revealed the T. daloushanensis is sister to T. fengjiensis using three mitochondrial genes (Cyt b, COI, and ND2), with low bootstrap supports (BS = 71). However, our results revealed T. fengjiensis is on the basal position of Clade A. Substantially, the putative species (T. sp. 2) from Mt. Dawei is strongly supported as sister to T. daloushanensis (BS = 99.7), compared with previous studies, this result is more reliable. This result suggests that it may represent a distinct species and that a detailed taxonomic study is required.
To investigate the role of selection pressure and the evolution of the mitochondrial genomes in the genus Typhlomys, we estimated the Ka/Ks values of each protein-coding gene (PCG) across seven species in the context of different outgroups. Our analysis revealed that only the Ka/Ks of the ND5 in T. huangshanensis consistently exceeded 1 when compared with different outgroups, indicating that this gene was under positive selection [44]. The ND5 gene, as an important component of the mitochondrial complex I proton channel [45], has adapted to the living environment that requires a large amount of ATP by increasing the amount of proton transport, and thus is reinforced by positive selection, which leads to a greater rate of non-synonymous than synonymous substitutions. We further conducted a comparative analysis of the mitochondrial gene structure of the ND5 gene across seven species (Supplementary Table S16). The results revealed that T. huangshanensis exhibits the highest AT content and the lowest GC content in the ND5 gene. This might indicate that the ND5 gene of T. huangshanensis has been subjected to a stronger AT-biased mutation pressure during evolution because AT base pairs, which contain only two hydrogen bonds, are more prone to breakage than GC base pairs (with three hydrogen bonds), leading to mismatches during DNA replication. Higher AT content might facilitate accelerating the transcription process and enhancing the protein synthesis rate, thereby enabling the rapid replenishment of energy consumption [46].
T. huangshanensis has so far been recorded only in the Huangshan Mountains (Anhui Province) and Qingliang Peak (Zhejiang Province), making it the northernmost-distributed species within the genus Typhlomys. Its habitat consists of mixed forests dominated by Chinese red pines with interspersed bamboo groves; this vegetation structure provides T. huangshanensis with diverse food resources and shelter sites. Among the seven species investigated in this study, T. huangshanensis exhibits a middle-range altitudinal distribution. Notably, it has the northernmost distribution compared to other congeneric species, which necessitates its adaptation to multiple stressors including hypoxia and low temperatures. Therefore, the positive selection observed in the ND5 gene may be associated with the enhanced efficiency of energy metabolism in this species under such complex environmental conditions. Meanwhile, T. huangshanensis may encounter unique competitive or predatory pressures within its ecological niche. It is thus hypothesized that the positive selection of the ND5 gene is linked to the species’ specific activity patterns and survival strategies.
Based on the results of ancestral distribution analysis, T. huangshanensis is highly likely to have originated from the dispersal of species from central or southwestern China to the eastern region. This species distributed solely in eastern China is also a peripheral species representing the northernmost distribution record of the genus Typhlomys. During the long-term dispersal process, the complex topography of mountain ranges and changes in climatic conditions may have promoted allopatric speciation, ultimately leading to the emergence of narrowly distributed endemic species. We hypothesize that in this “new” environment, T. huangshanensis has adapted to the ecological conditions, and its ND5 gene has been subjected to positive selection pressure. Further research is still needed in the future to clarify the natural adaptation mechanisms of T. huangshanensis.
5. Conclusions
This study generated complete mitochondrial genomes of seven Typhlomys species/putative species, filling gaps in the genus’ mitogenomic data. All mitogenomes (16,487–17,380 bp) have the typical mammalian 37-gene structure, with size variation driven by the A+T-rich control region and strong A+T bias average 63.1% reflected in frequent CUA, AGC, GGA, UUA codons. Phylogenetic analyses (ML/BI) resolve Typhlomys into two clades, confirming T. sp. 2’s distinctness, and diversification began 14.12 Ma (middle Miocene), matching southern China’s tectonic/climatic changes. Ancestral reconstruction (DIVALIKE model) points to a Central/Southwestern China origin (87.12% probability) with later range expansions, while selection analyses identify positive selection on T. huangshanensis’ ND5 (Ka/Ks > 1) to enhance energy metabolism for high-altitude, cold habitats in the northernmost latitude of the distribution range of the genus. These findings clarify Typhlomys’ phylogeny, biogeography, and adaptive evolution, supporting future ecological and conservation studies.
The reference list from the paper itself. Each links out to its DOI / PubMed record.
- 1Musser G.G. Carleton M.D. Superfamily Muroidea Mammal Species of the World: A Taxonomic and Geographic Reference 3rd ed. Wilson D.E. Reeder D.M. Johns Hopkins University Press Baltimore, ML, USA 2005 Volume 58941531
- 2Panyutina A.A. Kuznetsov A.N. Volodin I.A. Abramov A.V. Soldatova I.B. A blind climber: The first evidence of ultrasonic echolocation in arboreal mammals Integr. Zool.20171217218410.1111/1749-4877.1224927991725 · doi ↗ · pubmed ↗
- 3He K. Liu Q. Xu D.M. Qi F.Y. Bai J. He S.W. Chen P. Zhou X. Cai W.Z. Chen Z.Z. Echolocation in soft-furred tree mice Science 2021372 eaay 151310.1126/science.aay 151334140356 · doi ↗ · pubmed ↗
- 4Cheng F. He K. Chen Z.Z. Zhang B. Wan T. Li J.T. Zhang B.W. Jiang X.L. Phylogeny and systematic revision of the genus Typhlomys (Rodentia, Platacanthomyidae), with description of a new species J. Mammal.20179873174310.1093/jmammal/gyx 016 · doi ↗
- 5Smith A.T. Xie Y. A Guide to the Mammals of China Princeton University Press Princeton, NJ, USA 2013208209
- 6Abramov A. Balakirev A. Rozhnov V. An enigmatic pygmy dormouse: Molecular and morphological evidence for the species taxonomic status of Typhlomys chapensis (Rodentia: Platacanthomyidae)Zool. Stud.2014533410.1186/s 40555-014-0034-2 · doi ↗
- 7Balakirev A.E. Phuong B.X. Rozhnov V.V. Typhlomys (Rodentia, Platacanthomyidae): New species of the genus from northern Vietnam with notes on conservation status and distribution Biodivers. Data. J.202412 e 13336310.3897/BDJ.12.e 13336339507290 PMC 11538849 · doi ↗ · pubmed ↗
- 8Su W.T. Chen Z.Z. Wan T. Wang X. Zhou H.Y. Hu Y. Wang J.H. Jiang X.L. Nie W.H. He K. Taxonomy and distribution of the genus Typhlomys in China based on karyotypic and phylogenetic analyses Acta Theriol. Sin.202040239248