Networks and clusters of immunometabolic biomarkers and depression-associated features in middle-aged and older community-dwelling US adults with and without depression
Asma Hallab, Sid E. O'Bryant, Sid E. O'Bryant, Kristine Yaffe, Arthur Toga, Robert Rissman, Leigh Johnson, Meredith Braskie, Meredith Braskie, Kevin King, James R. Hall, Melissa Petersen, Raymond Palmer, Robert Barber, Yonggang Shi, Fan Zhang, Rajesh Nandy, Roderick McColl

TL;DR
This study explores how immunometabolic biomarkers are linked to depression features in older adults, aiming to improve risk assessment and treatment strategies.
Contribution
The study identifies specific immunometabolic clusters and their associations with depression features in multiethnic aging populations.
Findings
IL-6 and HbA1c were significantly associated with anhedonic and melancholic features.
Abdominal circumference and BMI were significantly associated with anhedonic features.
In non-depressed individuals, IL-6 and abdominal circumference remained linked to anhedonic features.
Abstract
Therapy-resistant depression is associated with higher levels of systemic inflammation and increased odds of metabolic disorders. It is, therefore, crucial to identify the biomarkers of high-risk individuals and understand the key features of depression-immunometabolic networks. The multiethnic ≥50-year-old study population is a subset of the Health and Aging Brain Study: Health Disparities (HABS-HD) study. Spearman's rank correlation network analysis was performed between immunological, metabolic, and subscales of the Geriatric Depression Scale (GDS). Significant correlations were then evaluated using a multivariable linear regression analysis, including testing for non-linearity and clinical cutoffs. Two clusters were formed: the first included the immunometabolic biomarkers, and the second included the different subscales of GDS. The two clusters were significantly correlated at…
Genes, proteins, chemicals, diseases, species, mutations and cell lines named across the full text — each resolved to its canonical identifier and authoritative record.
Click any figure to enlarge with its caption.
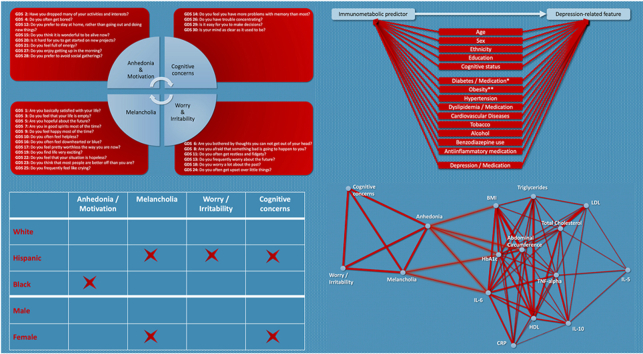 Figure 1
 Figure 2
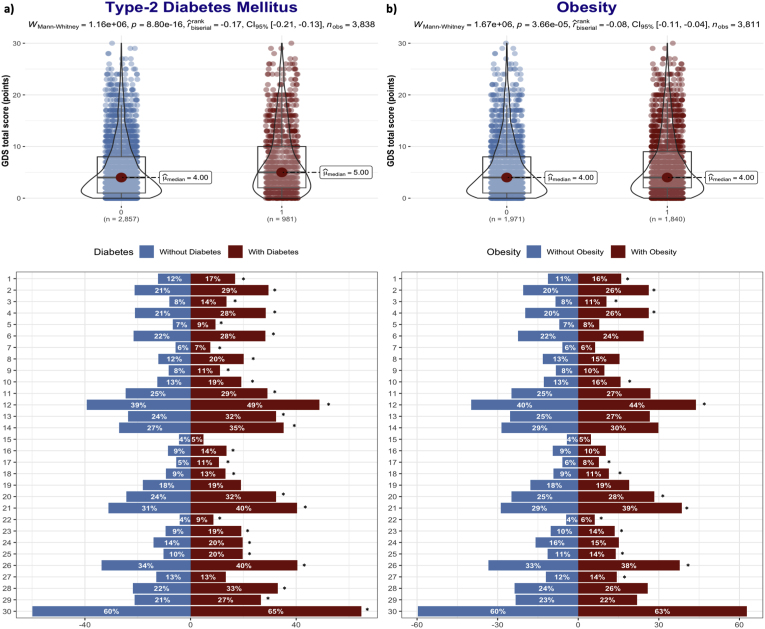 Figure 3
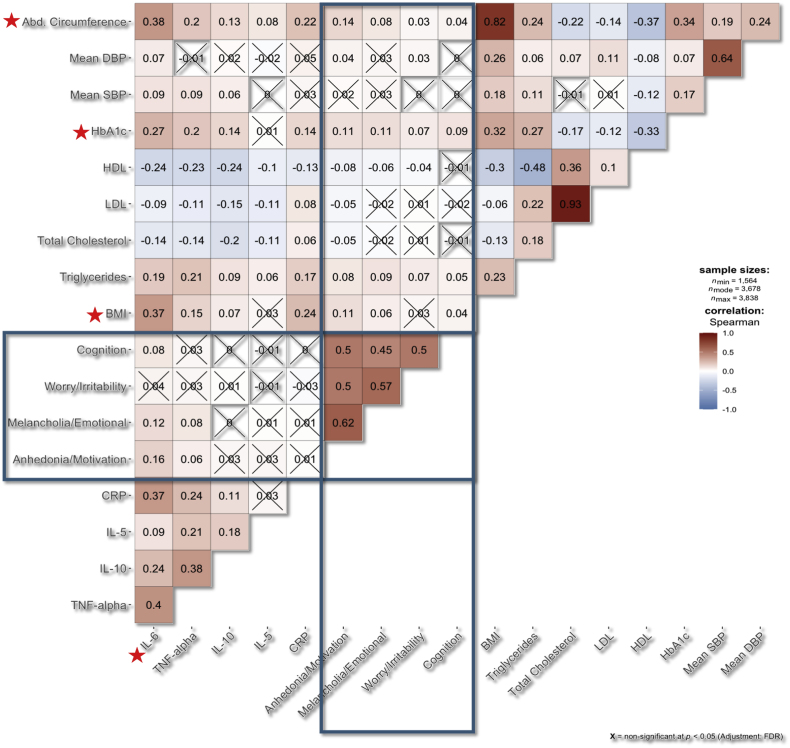 Figure 4
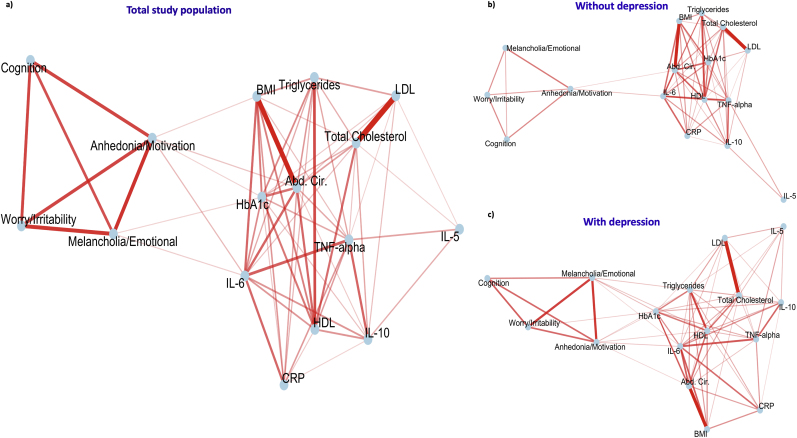 Figure 5
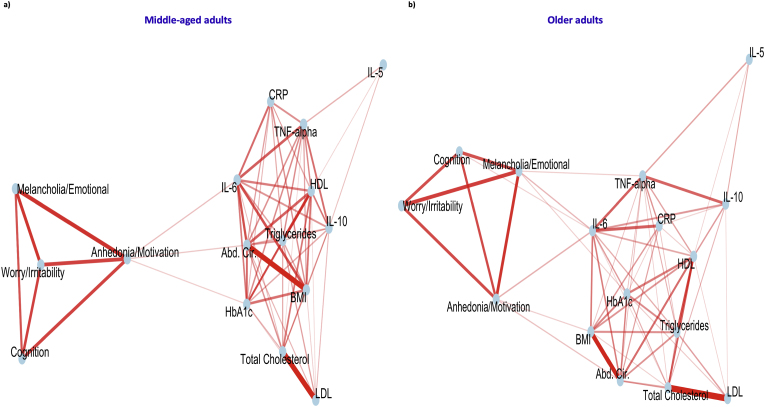 Figure 6
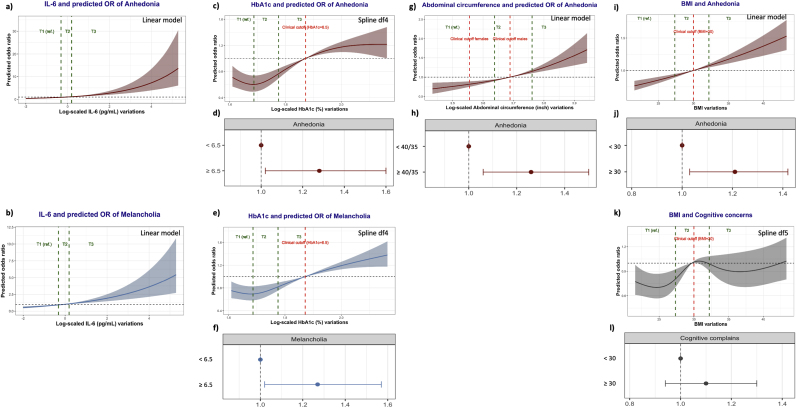 Figure 7
 Figure 8
Peer Reviews
No public reviews on file for this paper yet. If you reviewed it on a platform where reviews are public (OpenReview, ICLR, NeurIPS, ICML), you can paste yours below so the community can read it here.
Videos
No videos yet. Explain this paper in a talk, walkthrough, or lecture? Add one.
Taxonomy
TopicsTryptophan and brain disorders · Mental Health Research Topics · Health, Environment, Cognitive Aging