Distribution of prolactin and its correlation with insulin resistance in women with polycystic ovary syndrome
Stefan Ghobrial, Robert Krysiak, Tal Goldstein, Antonella Patsch, Chiara Paternostro, Florian Heinzl, Rodrig Marculescu, Johannes Ott

TL;DR
This study finds that higher prolactin levels are linked to lower insulin resistance in women with polycystic ovary syndrome, regardless of their specific PCOS type.
Contribution
The study identifies a novel inverse relationship between prolactin and insulin resistance in PCOS and reveals metabolic subtypes through clustering.
Findings
Prolactin levels were similar across PCOS phenotypes, but phenotype D had lower insulin resistance prevalence.
Prolactin was inversely correlated with insulin resistance in all PCOS groups.
Cluster analysis identified three distinct metabolic subtypes independent of PCOS phenotypes.
Abstract
Polycystic ovary syndrome (PCOS) is often associated with insulin resistance (IR). The role of prolactin (PRL) in this context remains unclear, particularly across different PCOS phenotypes. The aim of this study was to investigate the distribution of PRL, as well as its correlation with basal IR in women with PCOS. 200 women with PCOS, evenly distributed across phenotypes A-D and matched for age and body mass index (BMI) were retrospectively analyzed. PRL, Homeostasis Model Assessment of Insulin Resistance (HOMA-IR), sexual hormone binding globulin (SHBG), testosterone, and BMI were assessed. Correlation analysis and unsupervised clustering (based on PRL and HOMA-IR) were performed. PRL levels were similar across phenotypes, but phenotype D had a significantly lower prevalence of HOMA-IR ≥ 2.5 (p = 0.032). PRL was inversely correlated with HOMA-IR in all groups (p < 0.05). Cluster…
Genes, proteins, chemicals, diseases, species, mutations and cell lines named across the full text — each resolved to its canonical identifier and authoritative record.
Click any figure to enlarge with its caption.
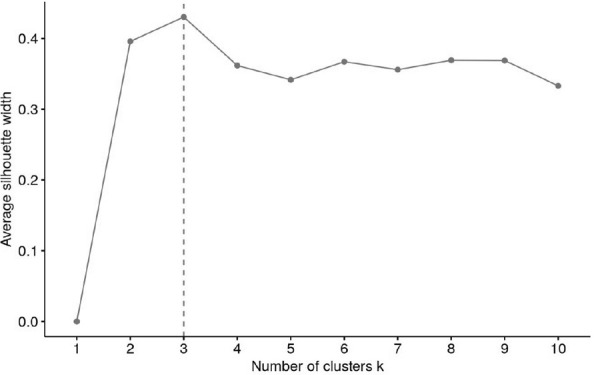 Figure 1
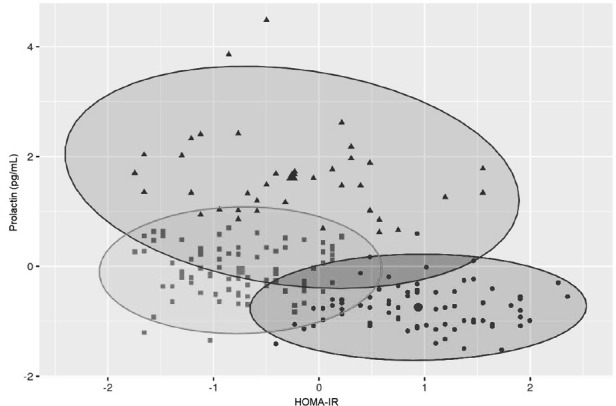 Figure 2
| Parameters | A (n=50) | B (n=50) | C (n=50) | D (n=50) | p |
|---|---|---|---|---|---|
| Age (years)1 | 26 (23-28) | 26 (23-29) | 26 (23-29) | 26 (23-29) | 0.953 |
| BMI (kg/m2)1 | 26.7 (22.0-32.6) | 27.2 (21.6-32.3) | 26.9 (21.9-32.5) | 26.5 (22.1-32.5) | 0.999 |
| FSH (mIU/mL)1 | 5.5 (4.4-6.4) | 5.3 (4.2-6.4) | 5.6 (5.0-6.8) | 5.6 (3.9-7.1) | 0.305 |
| LH (mIU/mL)1 | 12.9 (7.3-18.6) | 13.4 (9.1-19.2) | 11.8 (8.5-17.3) | 10.4 (5.3-15.1) | 0.109 |
| LH: FSH ratio1 | 2.6 (1.9-3.1) | 2.6 (2.0-3.5) | 2.2 (1.5-2.9) | 2.0 (1.2-2.8) | 0.056 |
| Testosterone (ng/mL)1 | 0.59 (0.47-0.71)3 | 0.61 (0.51-0.75)3 | 0.60 (0.52-0.75)3 | 0.37 (0.30-0.42)4 | <0.001 |
| DHEAS (µg/mL)1 | 3.41 (2.73-4.35)3 | 3.45 (2.78-4.47)3 | 3.86 (2.46-4.49)3 | 2.06 (1.64-2.74)4 | <0.001 |
| SHBG (nmol/L)1 | 37.5 (23.4-56.8) | 40.2 (24.9-64.0) | 43.7 (20.4-62.7) | 44.0 (27.8-66.7) | 0.497 |
| AMH (ng/mL)1 | 9.9 (7.1-12.9) | 6.1 (5.0-11.1) | 7.9 (5.1-12.1) | 7.7 (4.9-12.3) | 0.249 |
| Prolactin (pg/mL)1 | 12.9 (9.4-20.9) | 11.7 (9.5-15.5) | 12.0 (8.7-18.9) | 11.2 (7.2-18.5) | 0.622 |
| HOMA-IR1 | 2.8 (1.8-3.6) | 2.8 (1.8-3.6) | 2.7 (1.9-3.5) | 2.2 (1.4-3.1) | 0.204 |
| HOMA-IR >2.52 | 30 (60.0)3 | 27 (54.0)3 | 28 (56.0)3 | 18 (36.0)4 | 0.032 |
| Correlations | Phenotype A | Phenotype B | Phenotype C | Phenotype D | ||||
|---|---|---|---|---|---|---|---|---|
| r | p | r | p | r | p | r | p | |
| HOMA-IR vs BMI | 0.627 | <0.001 | 0.530 | <0.001 | 0.606 | <0.001 | 0.822 | <0.001 |
| HOMA-IR vs SHBG | -0.703 | <0.001 | -0.701 | <0.001 | -0.685 | <0.001 | -0.778 | <0.001 |
| HOMA-IR vs testosterone | 0.253 | 0.086 | 0.234 | 0.106 | -0.234 | 0.114 | 0.066 | 0.648 |
| HOMA-IR vs prolactin | -0.3021 | 0.0331 | -0.4892 | <0.0012 | -0.4392 | <0.0012 | -0.4862 | <0.0012 |
| BMI vs prolactin | 0.115 | 0.427 | -0.069 | 0.636 | 0.059 | 0.686 | -0.2353 | 0.0213 |
| Parameters | Cluster 1 (n= 77) | Cluster 2 (n= 39) | Cluster 3 (n= 84) | p | |
|---|---|---|---|---|---|
| Age (years)1 | 26 (23-28) | 25 (22-28) | 27 (24-29) | 0.113 | |
| BMI (kg/m2)1 | 29.2 (25.9-33.7)4 | 27.7 (22.8-34.0)5 | 23.4 (20.6-27.7)4,5 | <0.001 | |
| FSH (mIU/mL)1 | 5.6 (4.9-6.7) | 5.6 (4.5-6.9) | 5.3 (4.2-6.5) | 0.235 | |
| LH (mIU/mL)1 | 11.8 (8.4-15.9) | 12.3 (7.4-16.7) | 11.9 (6.7-18.7) | 0.626 | |
| LH: FSH ratio1 | 2.2 (1.5-3.0) | 2.4 (1.6-2.9) | 2.6 (1.5-3.3) | 0.516 | |
| Testosterone (ng/mL)1 | 0.59 (0.42-0.74) | 0.53 (0.43-0.69) | 0.47 (0.37-0.63) | 0.078 | |
| DHEAS (µg/mL)1 | 3.30 (2.47-4.47) | 3.62 (2.25-4.11) | 2.87 (1.99-3.79) | 0.048 | |
| SHBG (nmol/L)1 | 23.9 (19.3-33.2)3,4 | 47.2 (35.0-59.0)3,5 | 56.1 (43.7-77.7)4,5 | <0.001 | |
| AMH (ng/mL)1 | 6.6 (5.0-12.1) | 7.0 (4.8-9.4) | 8.9 (6.0-13.3) | 0.204 | |
| PCOS phenotype2 | A | 18 (23.4) | 14 (35.9) | 18 (21.4) | 0.220 |
| B | 22 (28.6) | 4 (10.3) | 24 (28.6) | ||
| C | 21 (27.3) | 13 (33.3) | 16 (19.0) | ||
| D | 16 (20.8) | 8 (20.5) | 26 (31.0) | ||
| Prolactin (pg/mL)1 | 8.5 (6.3-10.1)3,4 | 25.2 (21.8-28.9)3,5 | 13.3 (10.9-16.5)4,5 | <0.001 | |
| HOMA-IR1 | 3.7 (3.2-4.3)3,4 | 2.3 (1.7-3.1)3,5 | 1.8 (1.4-2.3)4,5 | <0.001 | |
| HOMA-IR >2.52 | 74 (96.1) | 17 (43.6) | 12 (14.3) | <0.001 | |
Peer Reviews
No public reviews on file for this paper yet. If you reviewed it on a platform where reviews are public (OpenReview, ICLR, NeurIPS, ICML), you can paste yours below so the community can read it here.
Videos
No videos yet. Explain this paper in a talk, walkthrough, or lecture? Add one.
Taxonomy
TopicsOvarian function and disorders · Reproductive Biology and Fertility · Hypothalamic control of reproductive hormones
Introduction
1
Polycystic ovary syndrome (PCOS) is the most frequent endocrine disorder in women of reproductive age with a prevalence of 6-15% when diagnosed according to the Rotterdam criteria (1). It is a complex endocrine disorder that not only affects the reproductive system, but is also associated with obesity, metabolic syndrome, type 2 diabetes mellitus and insulin resistance (IR), a condition where the body’s cells become less responsive to insulin, as well as other metabolic and cardiovascular risk factors (2–4). PCOS can be classified into four phenotypes depending on the expression of the potential symptoms after exclusion of other causes: clinical or biochemical hyperandrogenism (HA), chronic ovulatory dysfunction which manifests as oligo- or amenorrhea (OD) and polycystic ovarian morphology (PCOM). Phenotype A, the “complete phenotype”, includes all three criteria (HA + OD + PCOM). Phenotype B is diagnosed when HA and OD are present. The combination of HA and PCOM is typical for the “ovulatory” phenotype C and in women with the “normoandrogenic” phenotype D, OD and PCOM are found (2).
It has been shown that there are differences in metabolic risk between the four phenotypes. Phenotypes A, B and C seem to have a less favorable metabolic profile with a higher prevalence of metabolic syndrome and IR, compared to the “normoandrogenic” phenotype D (5–8). Notably, the “complete phenotype” A is associated with the least favorable metabolic outcomes (8, 9).
AMH (Anti-Müllerian Hormone) is elevated in women with PCOS compared to healthy women. Data on the distribution of AMH between the four phenotypes and its correlation with IR is quite heterogeneous. While some studies have found a positive correlation between AMH and IR measured by the Homeostasis Model Assessment (HOMA-IR) (10, 11), other studies have not been able to prove this (12). What the studies do agree on, however, is that the highest serum AMH and HOMA-IR levels are found in phenotype A. Moreover, a higher BMI also seems to correlate with IR (10–13). A positive correlation between a BMI > 25 kg/m^2^ and IR in women with PCOS has been demonstrated independently of their phenotype (11, 12). Further, IR and the resulting hyperinsulinemia as well as hyperprolactinemia (HPRL) inhibit the production of sex hormone binding globulin (SHBG) in the liver. This results in lower serum SHBG levels and thus the reduced binding of androgens to SHBG, leading to higher free testosterone concentrations (14).
Notably, HPRL is a condition of elevated prolactin (PRL), a hormone of the anterior pituitary gland, whose main physiological function is to initiate and maintain lactation (15). With a prevalence ranging from 0.4% in an unselected adult population to 17% in women with reproductive diseases, such as PCOS, it is also quite prevalent (15). Both disorders can be the cause of secondary amenorrhea, which is why the simultaneous diagnosis of HPRL and PCOS should not be a rare situation in women being examined for menstrual disorders (16).
The impact of PRL on metabolism is widely acknowledged. Both high and reduced PRL levels have been linked to IR in PCOS patients (17–19). Nevertheless, the influence of PRL on metabolism seems to be weight-dependent. Some studies suggest that mildly increased PRL levels (25–100 ng/mL) can be advantageous for metabolic health in obese PCOS patients (19). However, Bahceci et al. (17) demonstrated in their cohort of non-obese PCOS women that individuals with PRL levels exceeding 24 ng/mL already had an increased incidence of IR compared to the control group.
Due to the inconsistent data situation, the aim of this study was to investigate the distribution of PRL, as well as its correlation with basal HOMA-IR, in our cohort of 200 patients with PCOS. A specific focus was put on the differences and the distribution between the PCOS phenotypes. The study also intended to determine differences between the phenotypes regarding the correlations between PRL, BMI, HOMA-IR, SHBG and testosterone. Furthermore, the study aimed to evaluate an optimized cut-off for PRL concerning its association with pathological HOMA-IR≥ 2.5, considering the differences observed in the above-mentioned studies.
Materials and methods
2
Study design
2.1
This single-center, retrospective study was conducted at the Clinical Division of Gynecologic Endocrinology and Reproductive Medicine of the Medical University of Vienna, Austria, from January 2017 to December 2023. A total of 200 women with PCOS, aged 18–35 years were included. The study protocol was approved by the Ethics Committee of the Medical University of Vienna (IRB number 1298/2024).
PCOS was defined according to the revised Rotterdam criteria (1). In detail, hyperandrogenism was defined as the presence of hirsutism and/or a total testosterone level > 0.48 ng/mL (> 1.67 nmol/L), which is in accordance with the local normal ranges (20). Oligo-/anovulation was diagnosed based on the presence of oligo-/amenorrhea, i.e., a minimum cycle length ≥ 35 days in the last three months.
Patient population
2.2
Inclusion criteria were women aged 18–35 years with PCOS according to the revised Rotterdam criteria. Women who had received any PCOS-specific or HPRL-specific medication were excluded. Additional exclusion criteria included pregnancy, breastfeeding, known endocrine disorders other than PCOS (e.g., thyroid dysfunction, Cushing’s syndrome) or incomplete clinical or laboratory data.
From this patient cohort, 50 women per phenotype (A-D) were selected in order to obtain equally sized groups. This was achieved by 1:1 nearest-neighbor matching without replacement based on age (range ±1 year) and body mass index (BMI) (range ±1 kg/m²) until 50 patients per group were reached. To minimize bias, we verified balance of these matching variables between groups (see Table 1) and performed the main analyses (correlation analyses and unsupervised clustering) independently of phenotype.
As a standard practice at our institution, all women with HPRL were recommended to undergo an MRI of the pituitary gland to rule out a prolactinoma before any HPRL-specific treatment, regardless of additional risk factors.
Parameters analyzed
2.3
The main outcome parameters were the distribution of PRL levels in our PCOS population, as well as its correlation with HOMA-IR diagnosed by blood samples on day 2 to 5 of the menstrual cycle.
The AKIM-software (SAP-based patient management system at the Medical University of Vienna) was used for data acquisition. Basic patient information, including age and BMI, was collected. To assess polycystic ovarian morphology (PCOM), an Aloka Prosound 6 ultrasound machine (Wiener Neudorf, Austria; frequency range 3.0 – 7.5 MHz) was used. PCOM is defined by a follicle number per ovary (FNPO) >20 in at least one ovary and/or an ovarian volume ≥10 ml or follicle number per section (FNPS) ≥ 10 in either ovary, which is consistent with international recommendations (21).
HPRL was defined as a PRL level > 25 ng/mL after serum precipitation with polyethylene glycol (PEG). This is to eliminate macroprolactin, a high molecular weight form of PRL that can cause artificially elevated PRL levels without accompanying symptoms. While macroprolactin is generally considered biologically inactive due to limited endothelial permeability, some reports suggest it may dissociate and release active monomeric PRL, potentially leading to symptoms in certain cases (16, 22, 23).
In addition to PRL, the following serological data were collected: serum levels of estradiol, luteinizing hormone (LH), follicle stimulating hormone (FSH), total testosterone, dehydroepiandrosterone-sulfate (DHEAS) and sexual hormone binding globulin (SHBG). Blood samples were obtained during the early follicular phase visit (cycle days 2 to 5). All serum parameters were determined at the Department of Laboratory Medicine, Medical University of Vienna, according to ISO 15189 quality standards. As reported previously (24), Cobas electrochemiluminescence immunoassays (ECLIA) were performed on Cobas e 602 analyzers (Roche, Mannheim, Germany) for the determination of serum PRL, estradiol, FSH, LH, testosterone, DHEAS, and SHBG.
The HOMA-IR, calculated as HOMA-IR=insulin (mU/L) * glucose (mg/dL)/405, ≥ 2.5 was used for the definition of IR according to previous studies (25, 26). Moreover, PCOS was classified into the four above-mentioned phenotypes.
Statistical analysis
2.4
Continuous variables are presented as medians with interquartile ranges (IQR), categorical parameters as numbers and frequencies. Differences between three groups were tested using analyses of variances (ANOVA) for numerical parameters and chi-square tests/Fisher’s exact tests for categorical parameters. Paired comparisons between three groups were performed by non-parametric ANOVA after rank transformation using the methodology suggested by Conover and Iman (27). Spearman rank correlations coefficients (r) were used to assess correlations between the parameters. This non-parametric method is suitable for monotonic relationships. Correlation coefficients range from -1 to 1, indicating the strength and direction of the correlation. Outliers in PRL levels were assessed using visual inspection (boxplots) and confirmed post-PEG precipitation to exclude macroprolactin interference. No data points were excluded unless clearly attributable to measurement or recording error. For these analyses, the IBM Statistical Package for Social Science software (SPSS 25.0; International Business Machines Corporation, New York, NY, USA) was used for all statistical tests. p-values < 0.05 were considered significant.
Patients were clustered using the k-means method (via the Hartigan and Wong algorithm), which partitions the cohort into k groups such that the sum of squares from the cluster centers to the patients are minimal. This partitioning was done with respect to regularized HOMA as well as PRL values.
The number of clusters was derived via majority vote; a total of 29 different approaches were used to calculate the optimal number of clusters (e.g. Elbow, Silhouette and Gap methods). A mode of 3 (14 votes) was identified and k was subsequently set to 3.
The analysis was conducted using R version 4.4.1 (R Core Team. 2024. R: A Language and Environment for Statistical Computing. Vienna, Austria: R Foundation for Statistical Computing. https://www.R-project.org/), along with the following packages: tidyverse v2.0.0 (Wickham, Hadley. 2023. Tidyverse: Easily Install and Load the Tidyverse. https://tidyverse.tidyverse.org), viridis v0.6.5 (Garnier, Simon. 2024. Viridis: Colorblind-Friendly Color Maps for r. https://sjmgarnier.github.io/viridis/), factoextra v1.0.7 (Kassambara, Alboukadel, and Fabian Mundt. 2020. Factoextra: Extract and Visualize the Results of Multivariate Data Analyses. http://www.sthda.com/english/rpkgs/factoextra) and parameters v0.22.2 (Lüdecke, Daniel, Dominique Makowski, Mattan S. Ben-Shachar, Indrajeet Patil, Søren Højsgaard, and Brenton M. Wiernik. 2024. Parameters: Processing of Model Parameters. https://easystats.github.io/parameters/).
Cluster analysis was followed by silhouette analysis to evaluate the separation distance between the resulting clusters. In detail, the silhouette plot displays a measure of how close each point in one cluster is to points in the neighboring clusters and thus provides a way to assess parameters like number of clusters visually. The average silhouette width has a range of -1 to +1. A value of +1 indicates that the sample is far away from the neighboring clusters, a value about 0 suggests that the sample is very close to the decision boundary between two neighboring clusters and negative values indicate that those samples might have been assigned to the wrong cluster. The number of clusters with the highest average silhouette width was considered optimal (28).
Results
3
Basic patient characteristics according to the PCOS phenotypes
3.1
Detailed patient characteristics are provided in Table 1. Due to the matching for age and BMI, these parameters were consistent across all groups. The hormonal profiles showed only little variations among the groups with group D, the “normoandrogenic” group, having significantly lower testosterone and DHEAS levels compared to the other groups. The number of women with a HOMA-IR≥ 2.5 was significantly lower in group D, whereas the median HOMA-IR values and PRL levels did not differ between the groups (Table 1).
Correlation analyses
3.2
To further explore relationships between HOMA-IR and the various parameters across the four phenotypic groups, Spearman rank correlations were calculated (Table 2). These revealed significant correlations between HOMA-IR and several parameters across the phenotypic groups. HOMA-IR was positively correlated with BMI in all groups. In contrast, HOMA-IR was negatively correlated with SHBG and PRL in all groups. Weak correlations were observed between BMI and PRL, with only Phenotype D showing a significant negative correlation, indicating that women with higher BMI in this group tend to have lower PRL levels. No significant correlations were found between HOMA-IR and testosterone.
Cluster analysis
3.3
Variables included in the cluster analyses were PRL and HOMA-IR. The optimal number of clusters with the highest silhouette width (0.4) was three (Figure 1). The clustering of individual patients by PRL and HOMA-IR is depicted in Figure 2. Details of comparison between the three clusters can be seen in Table 3. Concerning HOMA-IR and PRL, all three clusters differed significantly from each other according to non-parametric ANOVAs with post hoc Bonferroni correction. Patients in Cluster 1 revealed the highest median HOMA-IR levels as well as the lowest median PRL levels. In Cluster 2, the highest median PRL level of the three Clusters was found. The lowest median HOMA-IR was observed in Cluster 3.
Evaluation of the optimal number of clusters using the silhouette method.
Cluster plot for prolactin and HOMA-IR.
Discussion
4
Phenotype D carries the lowest burden for IR
4.1
Our findings indicate that the different PCOS phenotypes are not uniformly associated with IR, with phenotype D exhibiting the lowest risk. This is consistent with previous studies that have found metabolic heterogeneity among PCOS phenotypes (29, 30). Phenotype D, characterized by the absence of hyperandrogenism, presents a more favorable metabolic profile compared to other phenotypes, primarily due to the absence of hyperandrogenic features, which are strongly correlated with increased IR and dyslipidemia (29, 31). Further, it showed a lower proportion of women with HOMA-IR ≥ 2.5 compared to the other phenotypes characterized by hyperandrogenism. This is also consistent with previous studies (30). Interestingly, median HOMA-IR levels did not differ significantly between the phenotypes. This suggests that threshold-based definitions of IR may uncover subtle but relevant group differences that mean values alone may not reveal.
This observation is consistent with the well-described relationship between hyperandrogenism and IR. Hyperinsulinemia stimulates the theca cells to increase androgen production and decreases at the same time hepatic SHBG synthesis, resulting in higher circulating levels of biologically active androgens. These androgens in turn aggravate IR by promoting central adiposity and impairing insulin signaling in peripheral tissues (3, 14). This feedback loop likely explains the less favorable metabolic profile of hyperandrogenic phenotypes A-C compared to the normoandrogenic phenotype D and is also further supported by recent evidence that highlights the higher metabolic risk of hyperandrogenic subgroups (32).
These findings highlight the importance of viewing PCOS not as a single, uniform condition but as a spectrum of related yet distinct disorders. Hyperandrogenic phenotypes appear more metabolically burdened, while normoandrogenic phenotype D may represent a less insulin-resistant subgroup.
No influence of PCOS phenotypes on interactions between HOMA-IR and PRL
4.2
Another aspect the study investigated was whether the different PCOS phenotypes influence the relationship between IR, measured by HOMA-IR, and serum PRL levels. Although PRL levels did not differ significantly between phenotypes, a consistent negative correlation between PRL and HOMA-IR across all phenotypes was observed. This suggests a potentially phenotype-independent inverse association between these two parameters. To the best of our knowledge, no previous study has directly examined this question. Existing research has either explored the relationship between PRL and IR without considering phenotype (33), or has compared IR across phenotypes without evaluating PRL levels (29, 30). This gap in the literature has left unanswered whether the relationship between PRL and HOMA-IR differs across PCOS phenotypes. By addressing this specific intersection, our study contributes new evidence suggesting that phenotypic classification does not significantly influence the PRL-IR relationship.
This inverse correlation may be explained by the physiological role of prolactin in metabolic regulation. At certain levels, PRL supports pancreatic β-cell proliferation and insulin secretion, enhances glucose uptake in peripheral tissues and contributes to glucose homeostasis (19). These beneficial effects might underlie the finding that women with relatively higher prolactin levels (although within the normal range) showed lower IR indices in our cohort. Conversely, very low PRL levels could represent a loss of this protective action, as seen in the subgroup with high HOMA-IR and low PRL (33).
Results of cluster analysis with new hypothesis
4.3
To further examine this potential relationship, an unsupervised, data-driven approach via cluster analysis was applied, including PRL and HOMA-IR as input variables. This identified three distinct clusters with significantly different profiles. Cluster 1 showed the highest IR and lowest PRL levels, while Cluster 2 had moderate HOMA-IR but the highest PRL levels. Cluster 3 had both low HOMA-IR and intermediate PRL.
What stood out most was that PRL, which didn’t differ across phenotypes, became a key discriminator in the clusters. This tells us that traditional PCOS classification systems might miss important hormonal-metabolic patterns. For example, Cluster 2 might represent a subgroup where PRL serves a compensatory role in early IR. In contrast, the lack of such a PRL response in Cluster 1, despite high HOMA-IR, could reflect a dysregulation that warrants further investigation. Cluster 3 seems more metabolically stable, neither PRL nor IR appeared particularly elevated.
Notably, the distribution of PCOS phenotypes across the three clusters wasn’t significant, which further supports the idea that these clusters reflect something different than what’s captured by phenotype alone. It also reinforces the value of combining classic endocrine markers like PRL with metabolic indices like HOMA-IR when trying to understand PCOS on a deeper level.
Study limitations and future directions
4.4
There are a few limitations to keep in mind when interpreting our findings. Firstly, PRL levels were measured only once. While this is common in clinical practice, it may not fully capture physiological variability in PRL concentrations. Secondly, because this was a retrospective study, cause-and-effect relationships couldn’t be established and there is always a chance of missing or incomplete data. Thirdly, IR was assessed using HOMA-IR, which was standard practice at the time, but according to the latest international PCOS guidelines (21), an oral glucose tolerance test (OGTT) would be the preferred method today due to its acceptable sensitivity, relatively low cost and its ability to diagnose diabetes. However, also the OGTT has limitations in accurately assessing IR. For research purposes, the hyperinsulinemic-euglycemic clamp remains the gold standard (34), though it is less feasible in large-scale or routine studies. Since neither OGTT or the hyperinsulinemic-euglycemic clamp technique nor multiple PRL measurements were routinely done in our cohort, this might have affected the precision of our evaluation of IR and PRL. Another, though probably less important drawback was the use of PEG precipitation to isolate monomeric PRL, which is widely accepted in clinical settings, although gel filtration chromatography offers greater specificity.
Another limitation is the use of electrochemiluminescence immunoassays (ECLIA) for androgen measurement. At the time of data collection, this was the routine method at our institution, whereas liquid chromatography-tandem mass spectrometry (LC-MS/MS) is now recommended as the gold standard (21). The limited sensitivity and precision of direct immunoassays in women with PCOS may partly explain why no significant correlation between HOMA-IR and testosterone was observed in our cohort, although such an association has been reported when free testosterone is measured by LC-MS/MS (35). At the same time, recent independent evaluations of the Roche ECLIA platform have demonstrated lower limits of quantification (LOQ) than initially indicated by the manufacturer, suggesting that its analytical performance is better than that of earlier immunoassays (36). Nevertheless, we fully recognize the superiority of LC-MS/MS and emphasize that future prospective studies should incorporate mass spectrometry-based methods for more accurate assessment of total and free testosterone in PCOS.
These limitations also highlight opportunities for future research. Prospective studies incorporating OGTT and where feasible, the clamp technique as the gold standard could provide a more accurate assessment of IR across PCOS phenotypes and help confirm the observed associations between PRL and metabolic markers. Additionally, larger and more diverse cohorts would be valuable to explore whether the cluster patterns identified in this study are reproducible and whether they have predictive value for clinical outcomes, such as the development of type 2 diabetes or cardiovascular disease. Finally, investigating the role of PRL not just as a marker but potentially as a modulator of metabolic health in PCOS could open up new avenues for risk stratification and personalized treatment strategies.
Conclusion
5
Our study highlights the limitations of phenotype-based classification in capturing the metabolic diversity of PCOS and suggests that PRL may play a more nuanced role in metabolic regulation than previously appreciated. The inverse association between PRL and IR appears to be consistent across phenotypes but becomes more pronounced when examined through cluster analysis. These findings open up new perspectives for refining risk stratification and may have implications for individualized therapeutic approaches in PCOS, particularly in identifying patients who may benefit from earlier metabolic interventions, even if their phenotype seems less risky on paper.
The reference list from the paper itself. Each links out to its DOI / PubMed record.
- 1Fauser BCJM Tarlatzis BC Rebar RW Legro RS Balen AH Lobo R. Consensus on women’s health aspects of polycystic ovary syndrome (PCOS): the Amsterdam ESHRE/ASRM-Sponsored 3rd PCOS Consensus Workshop Group. Fertility Sterility. (2012) 97:28–38. doi: 10.1016/j.fertnstert.2011.09.024, PMID: 22153789 · doi ↗ · pubmed ↗
- 2Lizneva D Suturina L Walker W Brakta S Gavrilova-Jordan L Azziz R. Criteria, prevalence, and phenotypes of polycystic ovary syndrome. Fertil Steril. (2016) 106:6–15. doi: 10.1016/j.fertnstert.2016.05.003, PMID: 27233760 · doi ↗ · pubmed ↗
- 3Diamanti-Kandarakis E Dunaif A. Insulin resistance and the polycystic ovary syndrome revisited: an update on mechanisms and implications. Endocr Rev. (2012) 33:981–1030. doi: 10.1210/er.2011-1034, PMID: 23065822 PMC 5393155 · doi ↗ · pubmed ↗
- 4Gambineri A Patton L Altieri P Pagotto U Pizzi C Manzoli L. Polycystic ovary syndrome is a risk factor for type 2 diabetes: results from a long-term prospective study. Diabetes. (2012) 61:2369–74. doi: 10.2337/db 11-1360, PMID: 22698921 PMC 3425413 · doi ↗ · pubmed ↗
- 5Shroff R Syrop CH Davis W Van Voorhis BJ Dokras A. Risk of metabolic complications in the new PCOS phenotypes based on the Rotterdam criteria. Fertil Steril. (2007) 88:1389–95. doi: 10.1016/j.fertnstert.2007.01.032, PMID: 17462641 · doi ↗ · pubmed ↗
- 6Krentowska A Kowalska I. Metabolic syndrome and its components in different phenotypes of polycystic ovary syndrome. Diabetes Metab Res Rev. (2022) 38:e 3464. doi: 10.1002/dmrr.3464, PMID: 33988288 · doi ↗ · pubmed ↗
- 7Borzan V Lerchbaum E Missbrenner C Heijboer AC Goschnik M Trummer C. Risk of insulin resistance and metabolic syndrome in women with hyperandrogenemia: A comparison between PCOS phenotypes and beyond. J Clin Med. (2021) 10:829. doi: 10.3390/jcm 10040829, PMID: 33670546 PMC 7922675 · doi ↗ · pubmed ↗
- 8Sachdeva G Gainder S Suri V Sachdeva N Chopra S. Comparison of the different PCOS phenotypes based on clinical metabolic, and hormonal profile, and their response to clomiphene. Indian J Endocrinol Metab. (2019) 23:326–31. doi: 10.4103/ijem.IJEM_30_19, PMID: 31641635 PMC 6683693 · doi ↗ · pubmed ↗