Gene Expression in Urinary Sediment Cells as an Indicator of the Contribution of Plasma Lipids to Diabetic Kidney Disease
Thaina Tavolaro Zocchio, Aritania Souza Santos, Ana Mercedes Cavaleiro, Luiz Henrique Gomes Matheus, Monique de Fátima Mello Santana, Eduarda Palanca, Ariana Tito Rodrigues, Milena Gomes Vancini, Márcia Nery, Marisa Passarelli, Maria Lúcia Corrêa-Giannella

TL;DR
This study shows that gene activity in urinary cells from people with Type 1 diabetes is linked to kidney function decline and lipid levels, suggesting a role for lipids in diabetic kidney disease.
Contribution
The study identifies gene expression patterns in urinary sediment cells that correlate with plasma lipid levels and kidney disease progression in Type 1 diabetes.
Findings
CD36 gene expression is higher in individuals with declining kidney function and increased albuminuria.
Plasma free fatty acids and triglycerides correlate with gene expressions related to lipid uptake and inflammation.
Statin and angiotensin II receptor blocker use modulates gene expression in urinary sediment cells.
Abstract
In individuals with Type 1 diabetes mellitus (T1D) who maintain good glycemic control and are free of chronic complications, lipid profiles are generally within normal ranges. However, impaired renal function or albuminuria alters this profile, contributing to the progression of diabetic kidney disease (DKD). This study hypothesized that, in urinary sediment cells from T1D individuals (n = 87), the mRNA expression of genes related to free fatty acid (FFA) uptake (CD36, FABP1, SCL27A1, SLC27A2, and SLC27A4, which encode FATP1, FATP2, and FATP4, respectively), albumin uptake (LRP2 and CUBN), inflammation (IL1B and IL18), and fibrosis (TGFB1) would vary depending on the degree of renal function decline and of urinary albumin excretion (UAE) and correlate with each other and with plasma lipid concentrations. CD36 expression was higher in urinary sediment cells of individuals with relevant…
Genes, proteins, chemicals, diseases, species, mutations and cell lines named across the full text — each resolved to its canonical identifier and authoritative record.
Click any figure to enlarge with its caption.
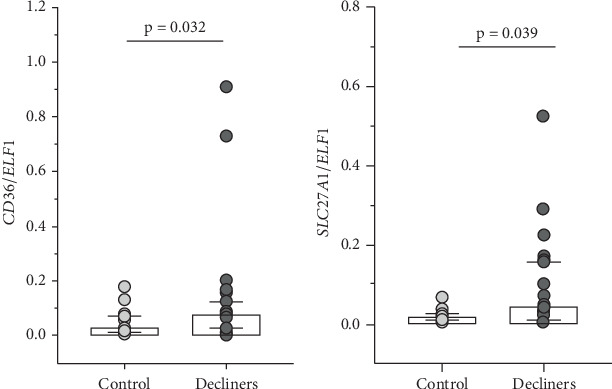 Figure 1
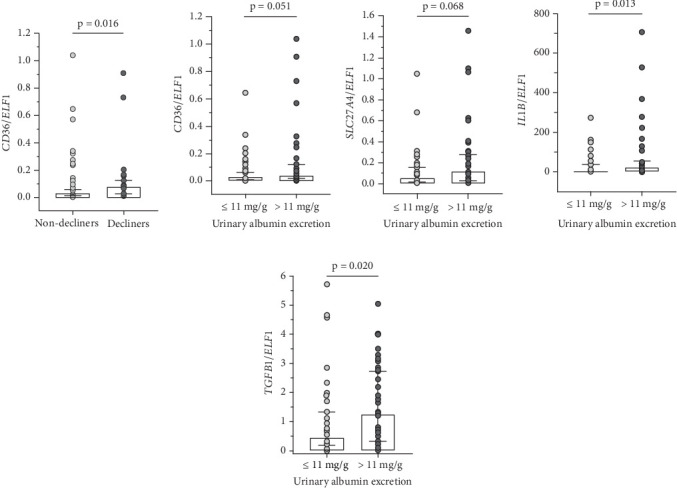 Figure 2
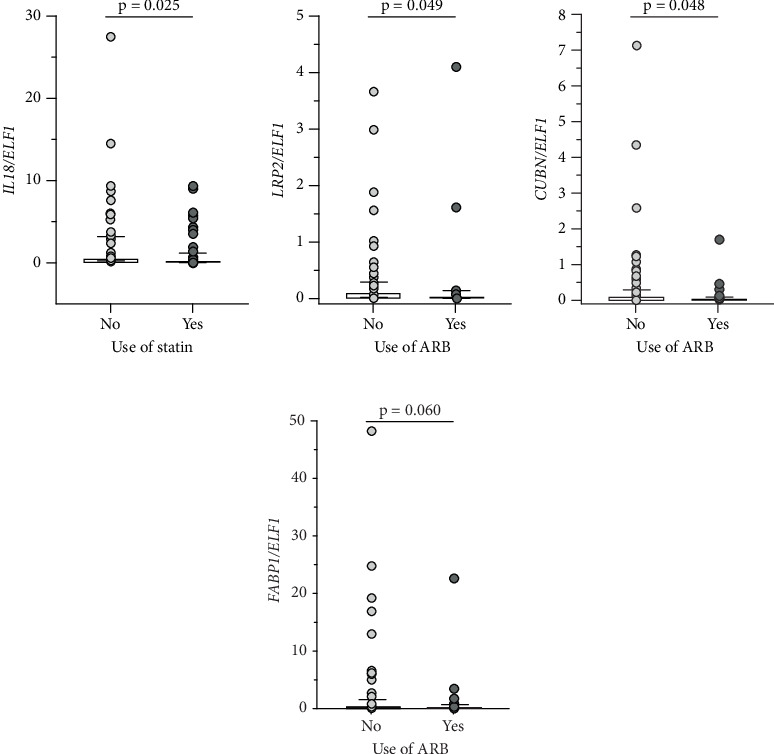 Figure 3
- —Coordenacao de Aperfeicoamento de Pessoal de Nivel Superior
- —Fundação de Amparo à Pesquisa do Estado de São Paulo
- —Conselho Nacional de Desenvolvimento Científico e Tecnológico
Peer Reviews
No public reviews on file for this paper yet. If you reviewed it on a platform where reviews are public (OpenReview, ICLR, NeurIPS, ICML), you can paste yours below so the community can read it here.
Videos
No videos yet. Explain this paper in a talk, walkthrough, or lecture? Add one.
Taxonomy
TopicsChronic Kidney Disease and Diabetes · Birth, Development, and Health · Liver Disease Diagnosis and Treatment
1. Background
Diabetic kidney disease (DKD) is a major complication of Type 1 diabetes mellitus (T1D). Although individuals with T1D who maintain good glycemic control often exhibit normal lipid profiles, the presence of albuminuria or impaired renal function is associated with detrimental alterations in lipid metabolism that accelerate DKD progression [1, 2]. Epidemiological cohorts such as the Diabetes Control and Complications Trial/Epidemiology of Diabetes Interventions and Complications (DCCT/EDIC) and the Finnish Diabetic Nephropathy Study (FinnDiane) have consistently shown associations between triglyceride (TG) concentrations, altered lipoprotein composition, and increased risk of DKD [2–4].
Experimental and clinical evidence suggests that disturbances in lipid handling within the kidney may drive tubular injury and fibrosis. Free fatty acids (FFAs), usually bound to albumin, are delivered into renal cells through specific transporters such as CD36 and fatty acid transport proteins (FATPs), or via the megalin (LRP2)/cubilin (CUBN) complex [5, 6]. Excessive intracellular accumulation of FFA promotes lipotoxicity, oxidative stress, and release of proinflammatory and profibrotic mediators, with deleterious effects on both tubular cells and podocytes [6–8]. FABP1, a fatty acid–binding protein expressed in proximal tubules, has been proposed as a marker of tubular injury, although its predictive value for DKD progression remains limited [9–11].
Despite these insights, the mechanisms by which dyslipidemia contributes to DKD progression remain incompletely understood. Most studies have relied on animal models or invasive kidney biopsies, restricting investigation in large cohorts. Urinary sediment cells provide a noninvasive alternative for exploring gene expression patterns related to renal injury [12, 13] and may offer new perspectives on the pathways linking lipid metabolism to DKD.
Based on this rationale, we hypothesized that, in urinary sediment cells from individuals with T1D, the expression of genes involved in FFA uptake (CD36, FABP1, SCL27A1, SLC27A2, and SLC27A4, which encode FATP1, FATP2, and FATP4, respectively), albumin uptake (LRP2 and CUBN), inflammation (IL1B and IL18), and fibrosis (TGFB1) would vary according to renal function decline and urinary albumin excretion (UAE) and correlate with each other and with plasma lipid concentrations.
2. Participants and Methods
This study was conducted in accordance with the Institutional Ethics Committee and the Declaration of Helsinki. Informed consent was obtained from all participants. A total of 127 T1D individuals were recruited in the diabetes outpatient clinic at a tertiary university hospital from May 2022 until July 2024. This prospective recruitment was combined with a retrospective review of historical data from institutional records to enable longitudinal assessment of renal function decline. Individuals on renal replacement therapy, kidney transplant recipients, or individuals with loss of renal function secondary to conditions other than diabetes were not included.
At inclusion (last evaluation), demographic, clinical, and biochemical data were collected, along with fasting blood for assessment of plasma lipid profile and urine samples. Historical data from the first available outpatient record at the institution (median follow-up of 13 [interquartile range: 6–18] years) were also retrieved, including HbA1c and eGFR values (calculated by CKD-EPI [14]). Urinary albumin-to-creatinine ratio was measured in spot urine samples using nephelometry, and participants were classified as A1 (<3 0 mg/g creatinine), A2 (30–299 mg/g creatinine), or A3 (≥ 300 mg/g creatinine). According to eGFR, individuals were classified into the following categories: G1: ≥ 90; G2: 60–90; G3: 30–59; G4: 15–29, and G5: < 15 mL/min/1.73 m^2^ [15].
To calculate the rate of renal function decline, the difference between the last and the first eGFR was divided by the number of years of follow-up. Participants with an annual eGFR decline ≥ 3.5 mL/min/1.73 m^2^ were classified as decliners, whereas those with a decline < 3.5 mL/min/1.73 m^2^ were classified as nondecliners [16].
Arterial hypertension was defined as blood pressure ≥ 130/80 mmHg [17]. HbA1c was measured using high-performance liquid chromatography, while the other laboratory variables were assessed through standard laboratory techniques.
Urine samples were collected from a group of 27 individuals without diabetes and not receiving angiotensin converting enzyme inhibitor (ACEI), angiotensin II receptor blocker (ARB), or statin for gene expression analysis (control group).
2.1. Urinary mRNA Expression
Urine samples were collected in sterile, RNase-free 200 mL conical flasks (Nalge Nunc, Rochester, United States), kept on ice, and processed quickly. The samples were centrifuged at 3,000 × g for 30 min at 4°C, and the supernatant was carefully discarded. The cell pellet was lysed with 1 mL of TRIzol reagent (Thermo Fisher Scientific, Carlsbad, United States) and supplemented with 1 μL of glycogen (20 mg/mL) to improve RNA recovery. After brief vortexing (15 s) and incubation at room temperature (5 min), 200 μL of chloroform was added. The mixture was vortexed again for 15 s, allowed to stand for another 5 min, and centrifuged at 10,000 × g for 15 min at 4°C. The aqueous phase was transferred to a clean 1.5 mL tube, mixed with an equal volume of isopropanol and 100 μL of 3 M sodium acetate (pH 5.2), gently inverted four times, and incubated on ice for 30 min. Following centrifugation (10,000 × g, 20 min, 4°C), the supernatant was discarded, and the pellet was washed twice with 70% ethanol, each followed by centrifugation at 10,000 × g for 10 min at 4°C. The RNA pellet was carefully air-dried by inverting the tube and removing residual liquid and then resuspended in 35 μL of RNase-free water. RNA integrity and concentration were assessed using the 2100 Bioanalyzer capillary electrophoresis system (Agilent Technologies, Santa Clara, United States) [18]. Only samples showing clear 28S and 18S ribosomal bands and a minimum RNA concentration of 14 ng/μL (Supporting Information 2: Figure S1) were included in the analyses (n = 87 in the T1D group and n = 16 in the control group). Reverse transcription was carried out using 200 ng of total RNA and the High-Capacity cDNA Reverse Transcription Kit (Life Technologies, Carlsbad, United States). Commercially available TaqMan probes and primers (assay IDs listed in Supporting Information 1: Table S1) were employed to evaluate the expression of the following genes by qPCR using the StepOne plus Real-Time PCR System (Life Technologies): CD36, FABP1, SCL27A1 (encodes for FATP1), SLC27A2 (encodes for FATP2), SLC27A4 (encodes for FATP4), LRP2 (encodes for megalin), CUBN (encodes for cubilin), IL18, IL1B, and TGFB1. E74-like factor 1 (ELF1) was selected as the reference gene based on prior validation by our group in urinary sediment cells from individuals with T1D, where it was identified as the most stable gene among 32 candidates [12]. All samples were run in duplicate. The abundance of the target mRNA was determined using the 2^−ΔCt^ method.
2.2. Assessment of Plasma Lipid Profile
Venous blood (20 mL) was collected after an 8-h fast. Plasma was obtained by centrifugation at 3,000 rpm at 4°C and stored at −80°C until analyses of TC, TG, and HDL cholesterol (HDL-c), the latter after apoB precipitation (Labtest do Brasil). LDL cholesterol (LDL-c) was calculated using the Friedewald formula [19]. For FFA determination (Randox NEFA Assay, Randox do Brasil Ltda.), 100 μL of plasma was stored in the presence of orlistat dissolved in dimethyl sulfoxide (10 mg in 10 mL).
2.3. Statistical Analyses
Owing to the nonnormal distribution of the data, nonparametric tests were employed. Continuous variables are presented as median and interquartile range, and differences between groups were evaluated using the Mann–Whitney test. Categorical variables are expressed as percentages, with differences between groups evaluated by Pearson's chi-square test. Spearman's rank correlation coefficient was employed for the correlation analyses. Statistical analyses were performed by JMP software Version 8.0 (SAS Institute, Cary, United States). A p value of < 0.05 was considered statistically significant. This study was exploratory in nature, and a convenience sample was used.
3. Results
The cohort included 87 T1D individuals with urinary sediment RNA of acceptable quality and quantity, of whom 78% were women, with a median age of 38 (interquartile range: 26–48) years and diabetes duration of 22 (16–34) years at the last evaluation. The HbA1c at the first and the last evaluations was 83 (69–97) and 69 (60–81) mmol/mol, respectively. The eGFR at the first and the last evaluations was 118 (105–133) and 102 (78–123) mL/min/1.73 m^2^, respectively. At the last evaluation, 69.7% were classified as A1, 18.6% as A2, and 11.7% as A3; 64.4% were classified as G1, 17.2% as G2, 13.8% as G3, and 4.6% as G4; 23% had arterial hypertension, 28.7% were prescribed an ACEI, 19.5% were prescribed an ARB, and 50.5% were using a statin. The demographic, clinical, and biochemical characteristics of the T1D individuals according to the status of renal function decline and of UAE are shown in Table 1. When compared to those classified as nondecliners (experienced an eGFR decline < 3.5 mL/min/1.73 m^2^/year), the decliners (experienced an eGFR decline ≥ 3.5 mL/min/1.73 m^2^/year) presented lower values of BMI (approaching statistical significance) and higher values of the last HbA1c and of plasma concentrations of TGs (approaching statistical significance), shorter interval between the first and last evaluations, lower eGFR at the last evaluation, higher values of UAE, higher proportion of individuals with UAE classified as A2+A3 and higher proportion of individuals using ARB.
When compared to those presenting UAE ≤ 11 mg/g creatinine (cohort median value), the individuals with UAE > 11 mg/g creatinine presented higher values of the last HbA1c and of plasma concentrations of TGs and of FFA (approaching statistical significance), higher values of UAE, a higher proportion of individuals with UAE classified as A2+A3, and a higher proportion of individuals with arterial hypertension.
The control group included 16 individuals without diabetes mellitus with urinary sediment RNA of acceptable quality and quantity, of whom 68.8% were women, with a median age of 40 (29–52.5) years and a median BMI of 24 (22.2–28.7) kg/m^2^. The only clinical condition reported in this group was hypertension (12.5%) (Supporting Information 1: Table S2), and none of the individuals showed evidence of renal function decline.
3.1. Gene Expression in Urinary Sediment Cells
Comparisons between the T1D group and the control group (nondiabetic) showed that only SLC27A1 expression was significantly higher in the T1D group (p = 0.017), while SLC27A2 expression was higher at the limit of statistical significance (p = 0.074) (Supporting Information 3: Figure S2). In addition, when comparing the control group with the subgroup of T1D individuals with the worst clinical outcome (decliners), higher expressions of CD36 (p = 0.032) and of SLC27A1 (p = 0.039) were observed in decliners (Figure 1).
No significant differences in the expression of any evaluated genes were detected when comparing T1D individuals stratified by UAE (A1 vs. A2+A3) or by eGFR categories (G1+G2 vs. G3+G4) (data not shown).
CD36 expression was significantly higher in those T1D individuals classified as decliners in comparison to nondecliners (p = 0.016; Figure 2a). In addition, expressions of CD36 (p = 0.051), SLC27A4 (p = 0.068), IL1B (p = 0.013), and TGFB1 (p = 0.020) were higher in individuals with UAE > 11 mg/g creatinine compared to those with UAE ≤ 11 mg/g creatinine (Figures 2b, 2c, 2d, and 2e).
We also examined whether gene expression was influenced by medication use. T1D individuals on statin therapy showed lower IL18 expression (p = 0.025; Figure 3a) compared to those not on statins. Similarly, those using ARB exhibited lower expressions of LRP2 (p = 0.049), CUBN (p = 0.048), and FABP1 (p = 0.060) compared to nonusers (Figures 3b, 3c, and 3d).
Gene expression correlations in the T1D group and in the control group are shown in Table 2, while Table 3 presents the correlations among gene expression and other variables within the T1D group.
4. Discussion
In the present study, the analysis of urinary sediment cells from T1D individuals revealed differential expression of mRNA related to FFA uptake (CD36 and SLC27A4), inflammation (IL1B), and fibrosis (TGFB1) according to different degrees of renal function decline and of UAE. Correlations were found between gene expressions and plasma lipid concentrations, providing indirect evidence for lipid involvement in the pathogenesis of DKD.
Studying gene expression in human urinary sediment is a useful strategy for investigating mechanisms potentially involved in the pathogenesis of nephropathies, as the sediment contains shed renal cells. However, a key challenge is obtaining high-quality RNA from cells stored in urine, a hostile environment with a low pH and conditions favorable for RNase activity [18]. In a previous study, we characterized the expressions of SGLT2 and NPHS2 (podocin), as markers of proximal tubule cells and podocytes, respectively [12]. Therefore, the discussion of this study's findings primarily focuses on these two cell types, which are represented in the urinary sediment.
When comparing gene expression between the T1D and control groups, only SLC27A1 and SLC27A2 (at the limit of statistical significance) mRNA levels were higher in the T1D group. FATP1 and FATP2, respectively, encoded by these genes, along with FATP4 (encoded by SLC27A4), are key transporters of FFA in the renal tubules, and their increased activity is believed to contribute to tubular FFA overload in DKD [20]. It is interesting to note that, except for TGFB1, mRNA content was notably homogeneous (and low) in the control group, while in the T1D group, it was highly heterogeneous, with some individuals exhibiting elevated expression levels. To explore whether this heterogeneity was associated with more advanced renal involvement, we compared the control group with T1D individuals who had the worst renal outcome (decliners). In this analysis, only CD36 and SLC27A1 expressions were higher in the decliner group.
When T1D individuals were stratified by the rate of renal function decline, the group classified as decliners exhibited poorer glycemic control in the most recent evaluation, higher plasma TG concentrations (approaching statistical significance), and a shorter follow-up period compared to the nondecliner group. This latter finding may reflect the higher proportion of individuals with hyperfiltration (eGFR > 130 mL/min/1.73 m^2^ in women and > 140 mL/min/1.73 m^2^ in men) in the decliner group (33%) compared to the nondecliner group (21.6%), as hyperfiltrating individuals may experience more rapid declines in renal function over a shorter observation period [21]. Gene expression analysis revealed significantly higher CD36 expression in the decliner group. Although the proportion of individuals with UAE categories A2 and A3 was greater in the decliner group, when A2 and A3 individuals were pooled and compared to A1 individuals (irrespective of the rate of renal function decline), no significant differences were observed in the expression of any of the evaluated genes.
Given the exploratory nature of this study, we also evaluated T1D individuals stratified according to UAE values either ≤ or > 11 mg/g creatinine (median of the T1D group). The group with excretion greater than the median showed significantly higher expression of CD36, SLC27A4 (at the limit of statistical significance), IL1B, and TGFB1. It is noteworthy that both in the stratification by renal function decline rate and by UAE median, the nondecliner and UAE ≤ median groups exhibited similar albuminuria values (9 and 5 mg/g creatinine, respectively), as did the decliner and UAE > median groups (54 and 42.5 mg/g creatinine, respectively). Although these two stratification criteria did not correspond to the same individuals, they shared comparable median UAE values. In the stratification by UAE, however, the group with the worse phenotype exhibited higher TG and FFA concentrations. Therefore, we speculate that the more pronounced changes in gene expression observed with this stratification may reflect the presence of two groups with distinct TG and FFA profiles.
Another possible explanation for the observed differences in CD36, SLC27A4, IL1B, and TGFB1 expression when individuals were stratified by UAE values ≤ or > 11 mg/g of creatinine (still within the A1 range), but not when category A1 was compared to categories A2+A3, is that changes in the expression of these genes may begin at a low threshold of albuminuria.
CD36 has been implicated in DKD, where its upregulation in response to high glucose concentrations promotes apoptosis in proximal tubular cells [22]. Inhibition of CD36 expression has been shown to suppress albumin-induced TGF beta elevation in renal tubular cells [23]. In a lupus nephritis model, CD36 contributed to podocyte injury, with a positive correlation observed between CD36 expression and markers of NLRP3 inflammasome activation, including IL1B [24]. The increased expressions of CD36, IL1B, and TGFB1 in the group with UAE > 11 mg/g of creatinine, along with moderate positive correlations between expressions of CD36 with IL1B and with TGFB1 exclusively in the T1D group, corroborate the involvement of pathways previously implicated in kidney diseases in preclinical models [23, 25]. Moreover, the positive correlations between plasma FFA and TG concentrations and CD36 expression, and between FFA concentrations and IL1B expression, further support the detrimental impact of dyslipidemia on the progression of DKD.
FATP4 has also been implicated in DKD; in db/db mice, increased renal expression of Slc27a4 mRNA and FATP4 protein in glomeruli correlated strongly with albuminuria [26]. These data provide biological plausibility for our findings in urinary sediment cells. Further support for the involvement of FATPs in DKD comes from the correlations observed between their expression and TGFB1, IL1B, and IL18 exclusively in the T1D group.
The analysis of statin use revealed a significant reduction in IL18 expression in the urinary sediment of individuals using this drug class, an effect that could be related to inhibition of the canonical NLRP3 inflammasome pathway, which would decrease caspase-1 activation and reduce IL18 production, subsequently lowering the need for its mRNA synthesis. Inhibition of this pathway, with reductions in both IL18 and IL1B expression, has been previously demonstrated in human vascular endothelial cells exposed to atorvastatin in a dose- and time-dependent manner, independent of its cholesterol-lowering effects [27]. Additionally, atorvastatin has been shown to inhibit NLRP3 inflammasome activation induced by calcium oxalate crystals in cultured renal tubular cells, reducing concentrations of IL18, IL1 beta, IL6, and tumor necrosis factor (TNF) in the culture medium [28]. Our findings suggest that statins exert pleiotropic effects on the kidneys. Notably, statin use did not decrease IL1B expression, even though its production is also stimulated by the NLRP3 inflammasome, indicating that these two cytokines may be regulated by distinct pathways. Further supporting this, the correlation between IL18 and IL1B expression was only moderate in the T1D group and nonsignificant in the Control group.
The analysis of ARB use revealed a significant reduction in the expression of LRP2, CUBN, and FABP1 in urinary sediment of individuals using this drug class. These three genes exhibited strong or very strong correlations with each other in both T1D and control groups, and their expression was consistently modulated by ARB, suggesting they may be regulated by shared control mechanisms. A potential common regulatory mechanism for these genes is the peroxisome proliferator-activated receptor (PPAR) family. PPAR-responsive elements have been identified in the promoter region of the human LRP2 gene, and PPAR agonists have been shown to increase LRP2 expression in renal tubular cells [29]. Similarly, putative PPAR binding sites have been found in the promoter region of the human CUBN gene, with PPAR-alpha agonists enhancing its expression in renal tubular cells [30]. PPAR-alpha agonists also upregulate FABP1 transcription [31]. Therefore, fatty acids, which serve as natural ligands for PPARs [29], are likely modulators of these three genes. A proteomic study on renal tubular cells revealed high expression of lipid metabolism enzymes transcriptionally regulated by PPAR-alpha/gamma in proximal tubules, whereas distal tubules exhibited elevated glycolytic enzyme expression; these findings highlight active lipid metabolism (and suppressed glycolysis) in proximal renal tubules [32], which may have important implications for the development of renal disease in the context of poorly controlled diabetes, where lipid profile disturbances are common.
The finding that ARB reduced the expression of LRP2 and CUBN is challenging to interpret considering prior research, which proposed that one protective mechanism of ARB involves restoring LRP2 expression in the proximal tubule. In rats, ARB-induced increases in LRP2 expression enhanced albumin endocytosis, thereby reducing urinary albumin loss [33]. A more recent study demonstrated that, in cultured proximal tubular cells, high glucose concentrations led to increased angiotensin II production, activation of the angiotensin II Type 1 receptor, and subsequent reduction in LRP2 expression. Treatment with losartan abolished this response, restoring LRP2 expression [34].
However, studies on the role of LRP2 and CUBN in renal disease progression have yielded conflicting results. Tubular activation of the renin–angiotensin system (RAS) is implicated in hypertension, albuminuria, tubular apoptosis, and tubulointerstitial fibrosis. In vitro studies suggest that LRP2 may be involved in the activation of RAS components in the proximal tubule, and its deficiency could be protective against the activation of inflammatory and profibrotic pathways [35]. It has also been demonstrated that albumin can activate the NLRP3 inflammasome, triggering the secretion of IL18 and IL1 beta after interacting with LRP2 and CUBN in renal tubular cells [36]. The positive correlation between LRP2 and IL18 observed exclusively in the T1D group suggests a potential link between LRP2 and NLRP3 inflammasome activation. Since LRP2 activation by albumin can stimulate both the RAS and the NLRP3 inflammasome, the observed reduction in LRP2 and CUBN expression in the urinary sediment of T1D individuals using ARB may indicate a protective effect of this drug class, potentially attenuating these harmful pathways.
Another pathway that activates the NLRP3 inflammasome involves TGF beta, a growth factor stimulated by the biochemical pathways triggered by hyperglycemia, which, in turn, has its signaling exacerbated by the inflammasome [37]. Very strong and moderate positive correlations were observed, exclusively in the T1D group, between TGFB1 and IL1B expressions, as well as between TGFB1 and IL18 expressions, respectively. Furthermore, IL1B and TGFB1 expressions exhibited positive correlations with UAE, indicating that gene expression in urinary sediment cells reflects the involvement of these pathways in the pathogenesis of DKD.
The negative, albeit weak, correlations between plasma concentrations of TC, TG, and FABP1 expression suggest a compensatory mechanism to maintain lipid homeostasis in renal cells. The correlation observed between BMI and IL18 expression (r = 0.24) is comparable to that observed between BMI and plasma IL18 concentrations (r = 0.26) in a study with 955 individuals without diabetes which evaluated the association of this cytokine to metabolic syndrome risk factors [38]. Individuals with T1D may be at higher risk of weight gain due to insulin anabolic effects, and obesity has already been linked to a greater risk of reduced eGFR in this population [39]. The positive correlation between BMI and IL18 expression in renal cells could be one of the mechanisms contributing to worse renal outcomes when obesity is associated with T1D.
Among the limitations of the present study are the relatively small sample size, which is nonetheless justified by the challenge of obtaining high-quality RNA from urinary sediment, and the predominance of women in the sample. This gender imbalance, commonly observed in our studies on T1D, where women typically constitute around 60% of the cohort, was even more pronounced in this study. This overrepresentation of females may limit the generalizability of our findings, given the known sex-related differences in DKD progression [40].
5. Conclusions
In urinary sediment cells of T1D individuals, correlations among the expression of genes encoding proteins involved in lipid metabolism with the expression of proinflammatory and profibrotic genes, as well as with plasma FFA and TG, provide indirect evidence for the role of these lipids in the pathogenesis of DKD [41]. Additionally, the expression profile of some genes showed associations with clinical indicators of renal function, pointing to their potential biological relevance.
The reference list from the paper itself. Each links out to its DOI / PubMed record.
- 1Jansson Sigfrids F. Lithovius R. Groop P. H. Thorn L. M. Lessons Learned From the Finn Diane Study: Epidemiology and Metabolic Risk Factors for Diabetic Kidney Disease in Type 1 Diabetes Diabetic Medicine 2025422 e 1543110.1111/dme.15431 PMC 1173366539235140 · doi ↗ · pubmed ↗
- 2Perkins B. A. Bebu I. de Boer I. H. Risk Factors for Kidney Disease in Type 1 Diabetes Diabetes Care 201942588389010.2337/dc 18-20622-s 2.0-8506510510030833370 PMC 6489116 · doi ↗ · pubmed ↗
- 3Mäkinen V. P. Soininen P. Kangas A. J. Triglyceride‐Cholesterol Imbalance Across Lipoprotein Subclasses Predicts Diabetic Kidney Disease and Mortality in Type 1 diabetes: The Finn Diane Study Journal of Internal Medicine 2013273438339510.1111/joim.120262-s 2.0-8487552170723279644 · doi ↗ · pubmed ↗
- 4Jansson Sigfrids F. Dahlström E. H. Forsblom C. Remnant Cholesterol Predicts Progression of Diabetic Nephropathy and Retinopathy in Type 1 Diabetes Journal of Internal Medicine 2021290363264510.1111/joim.1329833964025 · doi ↗ · pubmed ↗
- 5Fang Z. Liu R. Xie J. He J. C. Molecular Mechanism of Renal Lipid Accumulation in Diabetic Kidney Disease Journal of Cellular and Molecular Medicine 20242811 e 1836410.1111/jcmm.1836438837668 PMC 11151220 · doi ↗ · pubmed ↗
- 6Bobulescu I. A. Renal Lipid Metabolism and Lipotoxicity Current Opinion in Nephrology and Hypertension 201019439340210.1097/MNH.0b 013e 32833 aa 4ac 2-s 2.0-7795408643320489613 PMC 3080272 · doi ↗ · pubmed ↗
- 7Sun H. Sun Z. Varghese Z. Nonesterified Free Fatty Acids Enhance the Inflammatory Response in Renal Tubules by Inducing Extracellular ATP Release American Journal of Physiology Renal Physiology 20203192 F 292F 30310.1152/ajprenal.00098.202032686520 · doi ↗ · pubmed ↗
- 8Sieber J. Lindenmeyer M. T. Kampe K. Regulation of Podocyte Survival and Endoplasmic Reticulum Stress by Fatty Acids American Journal of Physiology Renal Physiology 20102994 F 821F 82910.1152/ajprenal.00196.20102-s 2.0-7795800430220668104 PMC 2957252 · doi ↗ · pubmed ↗