Association of Autophagy-Related Gene 5 (ATG5) With Neonatal Cholestasis in Egyptian Pediatric Patients
Rehab M Samaka, Hala S El-Rebey, Asmaa M Kabouh, Shereen M El- Mashad

TL;DR
This study found that the ATG5 gene is linked to neonatal cholestasis in Egyptian infants, suggesting a potential role in its development.
Contribution
The study is the first to investigate the role of ATG5 in neonatal cholestasis in an Egyptian population.
Findings
Intrahepatic cholestasis was significantly associated with higher ATG5 expression in zone II hepatocytes.
Overexpression of ATG5 was linked to mild fibrosis and lymphocytic infiltrates in the liver.
ATG5 may play a role in the pathogenesis of neonatal cholestasis in Egyptian infants.
Abstract
Neonatal cholestasis (NC) occurs in approximately 1 in 2500 live births. Autophagy-related gene 5 (ATG5) is a central component of the autophagy machinery, particularly in autophagosome formation. The autophagic process regulated by ATG5 has been implicated in various physiological and pathological conditions. This study aimed to evaluate the role of ATG5 in NC. This retrospective study analyzed liver biopsies from 74 patients with NC. 46 with extrahepatic etiology and 28 with intrahepatic etiology. Immunohistochemical expression of ATG5 was assessed in hepatocytes and biliary epithelium. A significant association was observed between intrahepatic cholestasis and the intensity of ATG5 expression in zone II hepatocytes (P = .029). Overexpression of ATG5 in hepatocytes was significantly associated with mild portal tract fibrosis (P = .038) and mild lymphocytic infiltrates (P = .005).…
Genes, proteins, chemicals, diseases, species, mutations and cell lines named across the full text — each resolved to its canonical identifier and authoritative record.
Click any figure to enlarge with its caption.
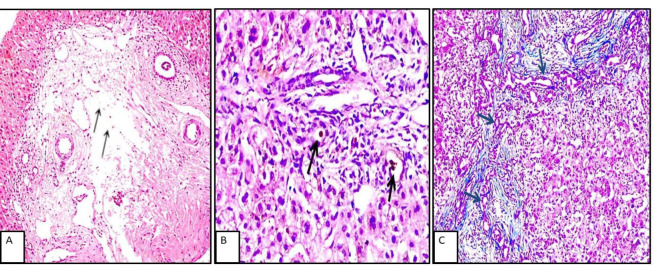 Fig. 1
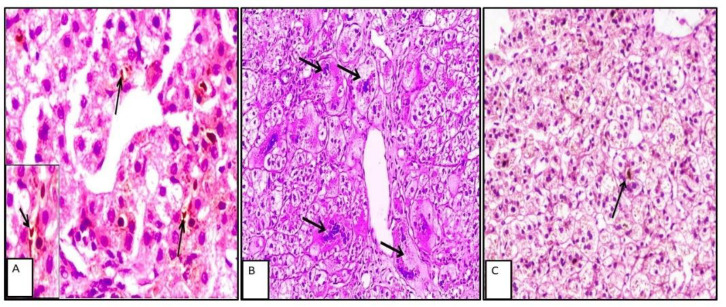 Fig. 2
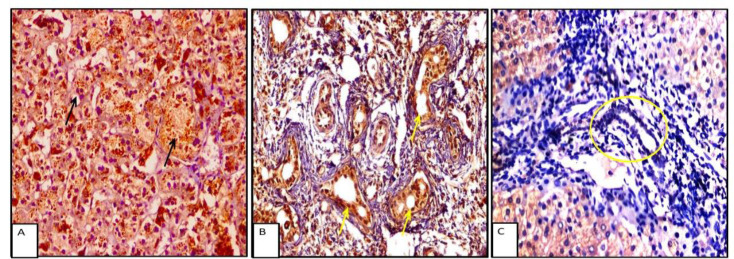 Fig. 3
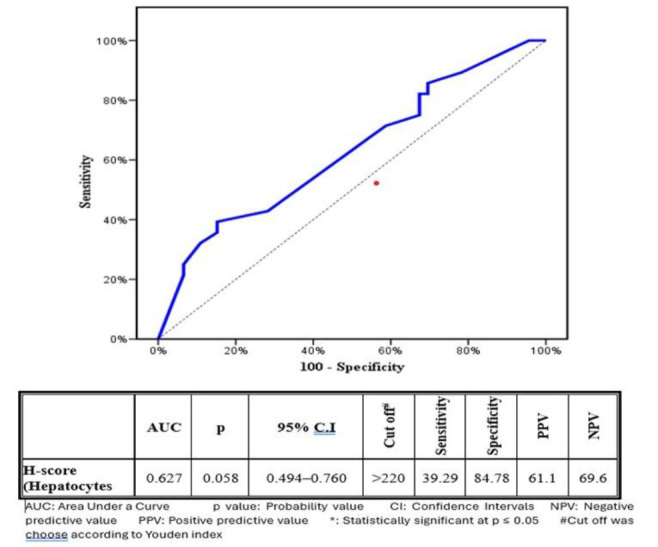 Fig. 4
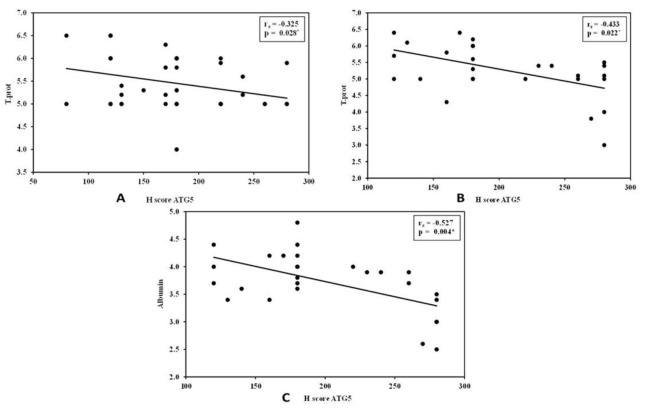 Fig. 5
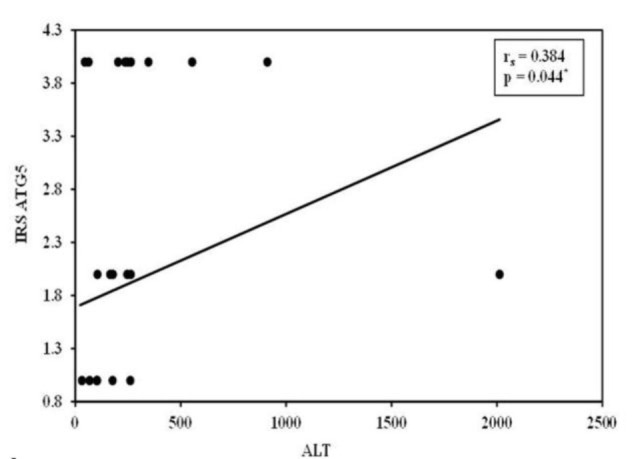 Fig. 6
| Clinical data | Extrahepatic NCNo (%) | Intrahepatic NCNo (%) | Test of significant. | P value |
|---|---|---|---|---|
| Sex | 23 (50) | 11 (39.3) |
| 0.370 |
| Female | 23 (50) | 17 (60.7) | ||
| Age (days) |
| 0.891 | ||
| Min. – Max. | 23 – 105 | 38 – 108 | ||
| Mean ± SD. | 65.54 ± 19.02 | 64.93 ± 17.93 | ||
| Median (IQR) | 62 (53 – 80) | 61.50 (51 – 77) | ||
| Abdominal US: | 3(6.5) | 0(0) |
| FEP=0.285 |
| Splenomegaly | 1(2.2) | 2(7.1) |
| FEP =0.553 |
| GB contractility | 3 (6.5) | 2 (7.1) |
| FEP =1.000 |
| LFTs | U=633.50 | 0.907 | ||
| T.Bil | ||||
| Min. – Max. | 5 – 21 | 5.50 – 21 | ||
| Mean ± SD. | 10.62 ± 3.33 | 10.90 ± 3.98 | ||
| Median (IQR) | 10.5 (8.70 – 11.49) | 10 (7.64 – 12.24) | ||
| D.Bil | U=631.0 | 0.884 | ||
| Min. – Max. | 4.82 – 14.50 | 4.40 – 16 | ||
| Mean ± SD. | 7.58 ± 2.04 | 7.98 ± 3.03 | ||
| Median (IQR) | 7 (6 – 8.08) | 7.02 (5.80 – 9.25) | ||
| T.prot | t=1.180 | 0.242 | ||
| Min. – Max. | 4 – 6.50 | 3 – 6.40 | ||
| Mean ± SD. | 5.46 ± 0.61 | 5.27 ± 0.79 | ||
| Median (IQR) | 5.30 (5 – 6) | 5.35 (6 – 5.90) | ||
| Albumin | t=0.779 | 0.438 | ||
| Min. – Max. | 3 – 4.60 | 2.50 – 4.80 | ||
| Mean ± SD. | 3.79 ± 0.39 | 3.71 ± 0.54 | ||
| Median (IQR) | 4 (3.60 – 4) | 3.75 (3.40 – 4) | ||
| AST | 100 – 500 | 51 – 2222 | U=488.50 | 0.083 |
| ALT | 25 – 512 | 23 – 2013 | U=640.50 | 0.969 |
| ALKP | U=398.50 | 0.006* | ||
| 172 – 2176 | 171 – 736 | |||
| 614 ± 298.1 | 455 ± 174.9 | |||
| 556.5 (490 – 730) | 449 (312 – 575.5) | |||
| GGT | U=189.0* | <0.001* | ||
| Min. – Max. | 126 – 1678 | 46 – 1436 | ||
| Mean ± SD. | 820.1 ± 427.6 | 330.9 ± 369.5 | ||
| Median (IQR) | 690.5 (497 – 1145) | 222 (108 – 405) | ||
| PT | t=1.547 | 0.126 | ||
| Min. – Max. | 10 – 14.30 | 10 – 14 | ||
| Mean ± SD. | 11.34 ± 1.17 | 11.79 ± 1.27 | ||
| Median (IQR) | 11 (10 – 12) | 11.70 (11 – 12.65) | ||
| INR | U=624.0 | 0.822 | ||
| Min. – Max. | 0.93 – 1.6 | 0.90 – 97 | ||
| Mean ± SD. | 1.15 ± 0.11 | 4.56 ± 18.12 | ||
| Median (IQR) | 1.16 (16 – 1.20) | 1.15 (16 – 1.20) |
| Parameters | Extra hepatic No (%) | Intra hepatic No (%) |
| p | |
|---|---|---|---|---|---|
| Portal tract changes | Portal tract edema | ||||
| Present | 45 (97.8) | 16 (57.1) | 19.893* | FEP<0.001* | |
| Absent | 1 (2.2) | 12 (42.9) | |||
| Bile duct proliferation | |||||
| Present | 44 (95.7) | 8 (28.6) | 37.490* | <0.001* | |
| Absent | 2 (4.3) | 20 (71.4) | |||
| Bile ductular proliferation | |||||
| Present | 45(97.8) | 10(35.7) | 35.187* | <0.001* | |
| Absent | 1 (2.2) | 18 (64.3) | |||
| Bile plugs | |||||
| Present | 46 (100) | 8 (28.6) | 45.026* | <0.001* | |
| Absent | 0(0) | 20(71.4) | |||
| Degree of Lymphocytic infiltrate | |||||
| Mild | 41 (89.1) | 27 (96.4) | 1.244 | FEP =0.399 | |
| Moderate | 5 (10.9) | 1 (3.6) | |||
| Degree of Neutrophil infiltrate | 17 (37) | 11 (39.3) | 1.071 | 0.301 | |
| Moderate + Marked | 15 (32.6) | 5 (17.9) | |||
| Degree of Eosinophil infiltrate | 32 (69.6) | 16 (57.1) | 1.179 | 0.278 | |
| Moderate + Marked | 14 (30.4) | 12 (42.9) | |||
| Hepatocyte swelling | |||||
| Present | 38 (82.6) | 26 (92.9) | 1.564 | FEP =0.301 | |
| Parenchymal changes | Absent | 8 (17.4) | 2 (7.1) | ||
| Rosetting | |||||
| Present | 6 (13) | 13 (46.4) | 14.066* | <0.001* | |
| Absent | 40(87) | 15(53.6%) | |||
| Giant cell transformation | |||||
| Present | 25 (54.3) | 18 (64.3) | 0.706 | 0.401 | |
| Absent | 21 (45.7) | 10 (35.7) | |||
| Lymphocytic permeation | |||||
| Present | 2 (4.3) | 10 (35.7) | 12.604* | FEP =0.001* | |
| Absent | 44 (95.7) | 18 (64.3) | |||
| Extra medullary hematopoiesis | |||||
| Present | 9 (19.6) | 15 (53.6) | 9.185* | 0.002* | |
| Absent | 37 (80.4) | 13 (46.4) | |||
| Steatosis | |||||
| Present | 1 (2.2) | 8 (28.6) | 11.353* | FEP =0.001* | |
| Absent | 45 (97.8) | 20 (71.4) | |||
| Microabscess | |||||
| Present | 4 (8.7) | 10 (35.7) | 8.283* | 0.004* | |
| Absent | 42 (91.3) | 18 (64.3) | |||
| ATG5 expression | Hepatic | Test of Sig. | P value | ||
|---|---|---|---|---|---|
| Extra hepatic No = (%) | Intra hepatic No = (%) | ||||
| Hepatocytes | Hepatocyte Expression | 46 (100) | 28 (100) | NA | |
| Negative | 0(0) | 0(0) | |||
| H-score | |||||
| Min. – Max. | 80 – 280 | 120 – 280 | U= | 0.063 | |
| Mean ± SD. | 177.17 ± 51.50 | 204.29 ± 57.05 | |||
| Median | 180 | 180 | |||
| Zone I intensity | |||||
| Mild | 2 (4.3) | 0 (0) |
| MCP=0.326 | |
| Moderate | 30 (65.2) | 15 (53.6) | |||
| Strong | 14 (30.4) | 13 (46.4) | |||
| Zone II intensity | |||||
| Mild | 15 (32.6) | 5 (17.9) |
| 0.029* | |
| Moderate | 27 (58.7) | 14 (50) | |||
| Strong | 4 (8.7) | 9 (32.1) | |||
| Zone III intensity | |||||
| Mild | 32 (69.6) | 17 (60.7) |
| 0.435 | |
| Moderate | 14 (30.4) | 11 (39.3) | |||
| Strong | 0 (0) | 0 (0) | |||
| Bile ducts | Expression | 40 (87) | 27 (96.4) |
| FEP =0.242 |
| Intensity | 25 (62.5) | ||||
| 17 (63) |
| 0.969 | |||
| 10 (37) | |||||
| Percentage | |||||
| Min. – Max. | 10 – 80 | 10 – 80 | U= | 0.342 | |
| Mean ± SD. | 42.75 ± 23.53 | 374 ± 24.31 | |||
| Median | 40 | 40 | |||
| IRS | 25 (54.3) | 15 (53.6) |
| 0.948 | |
| H-score (Hepatocytes) ATG5 expression | |||||
|---|---|---|---|---|---|
|
|
|
|
| ||
|
|
| ||||
| Hepatomegaly | |||||
| Present | -- | NA | 160 ± 34.64 | 21.0(0.248) | |
| Absent | 177.17 ± 51.50 | 209.60 ± 57.34 | |||
| Splenomegaly | |||||
| Present | 170 | NA | 180 | 22.0(0.762) | |
| Absent | 177.33 ± 52.07 | 206.15 ± 58.86 | |||
| GB contractility | |||||
| Contracted | 106.67 ± 23.09 | 8.500 | 175.0 ± 7.071 | 17.500(0.476) | |
| Absent | 182.09 ± 49.36 | 206.54 ± 58.65 | |||
| Parameters | ATG5 H-score | Test of Significant | P value | ATG5 H-score | Test of Significant | P value | |
|---|---|---|---|---|---|---|---|
| Mean ± SD. | Mean ± SD. | ||||||
| Portal tract changes | Degree of Fibrosis | 203.57 ± 59.69 | U=138.50 | 0.038* | 200.50 ± 59.60 | H=4.027 | 0.134 |
| Portal tract edema | 177.11 ± 528 | NA | – | 212.50 ± 58.14 | U= | 0.537 | |
| Bile duct proliferation | 174.77 ± 50.23 | U= | 0.213 | 215 ± 62.79 | U= | 0.566 | |
| Bile ductular proliferation | 174.89 ± 49.66 | NA | - | 208.0 ± 63.91 | NA | - | |
| Bile plugs | 177.17 ± 51.50 | NA | - | 232.50 ± 61.12 | U= | 0.165 | |
| Degree of Lymphocytic infiltrate | 184.63 ± 47.86 | U= | 0.005* | 205.19 ± 57.94 | NA | – | |
| Degree of Neutrophil infiltrate | 189.41 ± 50.56 | U=94.0 | 0.216 | 205.45 ± 46.55 | H=1.181 | 0.554 | |
| Degree of Eosinophil infiltrate | 181.88 ± 543 | U=198.0 | 0.527 | 207.50 ± 62.13 | U=90.0 | 0.802 | |
| Parenchymal changes | Hepatocyte swelling | 1765 ± 49.95 | U= | 0.618 | 202.31 ± 578 | U= | 0.476 |
| Resetting | 178.75 ± 49.57 | U= | 0.397 | 226.92 ± 56.18 | U= | 0.052 | |
| Giant cell transformation | 168.0 ± 52.99 | U=190.50 | 0.106 | 196.67 ± 55.62 | U=71.50 | 0.382 | |
| Lymphocytic permeation | 171.50 ± 55.37 | U=40.0 | 0.852 | 187 ± 401 | U=65.500 | 0.245 | |
| Extra medullary hematopoiesis | 170 ± 70.71 | U= | 0.051 | 190.67 ± 40.79 | U= | 0.235 | |
| Steatosis | 143.33 ± 42.13 | NA | – | 203.75 ± 58.54 | U= | 0.940 | |
| Microabscess | 260# | U= | 0.510 | 197 ± 51.43 | U= | 0.654 | |
| ATG5 IRS expression | ||||
|---|---|---|---|---|
|
|
|
|
| |
|
|
| |||
| Hepatomegaly | ||||
| Present | – | NA | 0.33 ± 0.58 | 12.50(0.062) |
| Absent | 1.93 ± 1.54 | 2.12 ± 1.59 | ||
| Splenomegaly | ||||
| Absent | 2 | NA | 0.50 ± 0.71 | 11.50(0.222) |
| Present | 1.93 ± 1.56 | 2.04 ± 1.61 | ||
| GB contractility | ||||
| Contracted | 0.33 ± 0.58 | 21.0(0.053) | 2.0 ± 0.0 | 22.0(0.762) |
| Absent | 2.05 ± 1.53 | 1.92 ± 1.67 | ||
| Parameters | IRS ATG5 expression of EHC | Test of Significant | P value | IRS ATG5 expression of IHC | Test of Significant | P value | |
|---|---|---|---|---|---|---|---|
| Mean ± SD. | Mean ± SD. | ||||||
| Portal tract changes | Degree of Fibrosis | 2.07 ± 1.64 | U=210.0 | 0.730 | 2.05 ± 1.61 | H=0.481 | 0.786 |
| Portal tract edema | 1.89 ± 1.53 | NA | – | 2.00 ± 1.59 | U=88.50 | 0.732 | |
| Bile duct proliferation | 1.95 ± 1.57 | U= | 0.852 | 2.25 ± 1.58 | U= | 0.500 | |
| Bile ductular proliferation | 1.93 ± 1.56 | NA | - | 2.30 ± 1.57 | U=70.50 | 0.356 | |
| Bile plugs | 1.93 ± 1.54 | NA | - | 1.75 ± 1.58 | U=74.0 | 0.784 | |
| Degree of Lymphocytic infiltrate | 2.0 ± 1.53 | U= | 0.408 | 1.85 ± 1.59 | NA | – | |
| Degree of Neutrophil infiltrate | 1.94 ± 1.48 | U=126.50 | 0.970 | 1.73 ± 1.62 | U=21.50 | 0.510 | |
| Degree of Eosinophil infiltrate | 1.94 ± 1.54 | U=222.0 | 0.961 | 1.81 ± 1.47 | H=4.637 | 0.098 | |
| Parenchymal changes | Hepatocyte swelling | 1.95 ± 1.58 | U= | 0.966 | 1.77 ± 1.56 | U= | 0.106 |
| Rosetting | 1.90 ± 1.55 | U= | 0.667 | 2.31 ± 1.75 | U= | 0.339 | |
| Giant cell transformation | 1.68 ± 1.63 | U=199.50 | 0.151 | 1.94 ± 1.66 | U=89.50 | 0.981 | |
| Lymphocytic permeation | 1.0 ± 1.41 | U=29.50 | 0.464 | 1.94 ± 1.66 | U=89.50 | 0.981 | |
| Extra medullary hematopoiesis | 1.0 ± 1.32 | U= | 0.036* | 1.93 ± 1.67 | U= | 1.000 | |
| Steatosis | 143.33 ± 42.13 | NA | – | 2.00 ± 1.77 | U= | 0.940 | |
| Microabscess | 2.50 ± 1.73 | U= | 0.534 | 2.80 ± 1.40 | U= | 0.031* | |
Peer Reviews
No public reviews on file for this paper yet. If you reviewed it on a platform where reviews are public (OpenReview, ICLR, NeurIPS, ICML), you can paste yours below so the community can read it here.
Videos
No videos yet. Explain this paper in a talk, walkthrough, or lecture? Add one.
Taxonomy
TopicsPediatric Hepatobiliary Diseases and Treatments · Pancreatitis Pathology and Treatment · Pancreatic and Hepatic Oncology Research
Introduction
The incidence of neonatal cholestasis (NC) is approximately 1 in 2,500 live births worldwide. At the Egyptian National Liver Institute, the most common cause of NC was biliary atresia (BA) (37%), followed by progressive familial intrahepatic cholestasis (PFIC) (12%), neonatal sepsis (9%), cytomegalovirus (CMV) infection (8%), idiopathic neonatal hepatitis (7%), and inspissated bile syndrome (3%) (2).
Autophagy is a catabolic process that allows cells to recycle amino acids and other intracellular components to generate energy (3). In the liver, autophagy has been shown to play a crucial role in cytoprotection against various pathological insults, including steatosis, liver injury, and dyslipidemia associated with alcoholic and nonalcoholic fatty liver disease (4). Furthermore, autophagy deficiency has been reported in inherited metabolic liver diseases, such as glycogen storage disease type Ia (GSD-Ia), which is characterized by a deficiency in glucose-6-phosphatase-α (G6Pase-α), leading to impaired glucose homeostasis and hepatomegaly.
Autophagy-related genes were first identified in yeast; among them, autophagy-related gene 5 (ATG5) is a key regulator of autophagosome formation (5).
The present study aimed to evaluate the role of ATG5 in NC among Egyptian pediatric patients.
Materials and Methods
This retrospective study included 74 cases of neonatal cholestasis (NC): 46 with extrahepatic etiology and 28 with intrahepatic etiology. Cases were collected over a 4-year period (January 2017–December 2020) from the Pathology Department of the National Liver Institute, Menoufia University.
Patients were excluded if paraffin blocks were unavailable or contained insufficient tissue, if clinical data were incomplete, or if treatment and follow-up were conducted outside the National Liver Institute.
Clinical and Laboratory Data
Laboratory and radiological findings were obtained from patient records. Laboratory data included prothrombin time, international normalized ratio (INR), liver function tests [aspartate aminotransferase (AST), alanine aminotransferase (ALT), γ-glutamyl transferase (GGT), alkaline phosphatase (ALKP), total and direct bilirubin, total protein, and albumin]. Abdominal ultrasound results were also reviewed.
Histopathological Evaluation
Hematoxylin-eosin (H&E)–stained sections and special stains (Masson trichrome, Perls, and orcein) were re-evaluated to confirm the diagnosis. The following pathological parameters were graded: ductular proliferation, bile plugs, portal inflammatory infiltrates (lymphocytes, neutrophils, and eosinophils), giant cell transformation of hepatocytes, hepatocyte swelling, cholestatic rosettes, and extramedullary hematopoiesis (6,7). Liver fibrosis was staged according to the Ishak system (grades 0–6) (8).
Immunohistochemistry
Four-micron sections were prepared from paraffin blocks and stained using a streptavidin-biotin amplification system. Sections were deparaffinized in xylene, rehydrated, and treated with 200 mL of Tris-EDTA high-pH retrieval solution (Dako, Ref K8000, Glostrup, Denmark) for 20 minutes. Endogenous peroxidase activity was blocked using peroxidase-blocking reagent. Slides were incubated overnight with primary antibody against ATG5 (goat polyclonal, Santa Cruz Biotechnology, catalogue no. sc-8667, RRID: AB_2062328; dilution 1:200). Normal human duodenal tissue served as a positive control. Sections incubated without primary antibody served as negative controls.
Immunohistochemical results were evaluated independently by two pathologists blinded to clinical data, with consensus obtained in cases of discrepancy.
Hepatocytes: ATG5 positivity was defined as diffuse granular cytoplasmic staining (9). The H-score was calculated using the formula:H-score = (1 × % mildly stained cells) + (2 × % moderately stained cells) + (3 × % strongly stained cells).Staining was assessed separately across hepatocyte zones. Biliary epithelium: Immunoreactivity was scored using the IRS system (9). Staining intensity was scored as 0 (negative), 1 (faint), 2 (moderate), or 3 (strong). Distribution was scored as 0 (negative), 1 (1%–30%), or 2 (31%–100%). The composite score was calculated by multiplying intensity and distribution scores. Scores of 0 were considered negative, while scores 1–6 indicated positive expression.
Statistical Analysis
Data were analyzed using SPSS version 20 (IBM Corp, Armonk, NY). Qualitative variables were described as frequency and percentage, and quantitative variables as mean ± standard deviation or median (range) as appropriate. The χ² test or Fisher exact test was used for categorical variables. Mann-Whitney U and Kruskal-Wallis H tests were used for non-normally distributed quantitative variables. A P value ≤ .05 was considered statistically significant (10).
Results
A comparison of clinical, laboratory, and radiological data between extrahepatic and intrahepatic NC groups is presented in Table 1. Patients with extrahepatic NC had significantly higher levels of alkaline phosphatase (ALKP) and γ-glutamyl transferase (GGT) compared with those with intrahepatic NC (P = .006 and P < .001, respectively).
Histopathological Assessment of NC Cases
In extrahepatic cholestasis, portal tract changes were more prominent, including periportal edema, bile plugs, and bile duct proliferation. In contrast, intrahepatic cholestasis was more frequently associated with parenchymal alterations such as cholestatic rosettes and intrahepatic or intracanalicular cholestasis (Fig. 1 and Fig. 2).
A case of extrahepatic NC, A: Portal tract edema black arrows (H&E x40), B: Intraluminal bile lugs black arrows, (H&E x200). C: Bile duct proliferation, black arrows (Masson trichrome x100).
A: Case of intrahepatic NC with intracanalicular cholestasis black arrows, (H&Ex400). B: Case of neonatal hepatitis with prominent giant cell transformation, black arrows (H&E x400). C: Case of PFIC demonstrating cholestatic rosettes, red arrow (H&E x200).
A comparison of histopathological parameters between extrahepatic and intrahepatic NC groups is presented in Table 2. Extrahepatic cholestasis was significantly associated with portal tract changes, including fibrosis, edema, bile plugs, bile duct proliferation, and bile ductular proliferation (P < .001 for all). Conversely, intrahepatic cholestasis was significantly associated with parenchymal features, including hepatocyte rosetting (P < .001), lymphocytic permeation (P = .001), extramedullary hematopoiesis (P = .002), steatosis (P < .001), and microabscess formation (P = .004).
ATG5 Expression in Hepatocytes
All studied cases showed positive ATG5 expression in hepatocytes. In the extrahepatic NC group, the mean ± SD ATG5 H-score was 177.17 ± 51.50, whereas in the intrahepatic NC group, it was 204.29 ± 57.00 (Fig. 3). A significant difference in ATG5 expression was noted in zone II hepatocytes between extrahepatic and intrahepatic NC (P = .029). Moderate to strong ATG5 expression was observed in 31 patients (67.4%) with extrahepatic NC and in 23 patients (82.1%) with intrahepatic NC.
Receiver operating characteristic (ROC) curve analysis was performed to evaluate the diagnostic utility of ATG5 expression in differentiating between extrahepatic and intrahepatic cholestasis. Although the difference approached statistical significance (P = .058), higher ATG5 expression was consistently observed in hepatocytes from intrahepatic NC compared with extrahepatic NC. The specificity and sensitivity of ATG5 expression were 84.78% and 39.29%, respectively (Fig. 4).
ATG5 Expression in Biliary Epithelium
No significant difference in ATG5 IRS expression was observed in biliary epithelium between extrahepatic and intrahepatic NC groups (Table 3).
A: Strong zone II cytoplasmic staining of hepatocytes byATG5, black arrows (IHC x200). B: Strong staining of biliary epithelium byATG5, red arrows (IHC x200). C: Negative staining of biliary epithelium for ATG5, yellow circle (IHC x400).
ROC curve for H-score (Hepatocytes)) to discriminate intrahepatic cases from extratrahepatic cases. Table: Validity (AUC, sensitivity, specificity) for H-score (Hepatocytes) to discriminate intrahepatic cases from extratrahepatic cases.
Relationship Between Hepatocyte ATG5 Expression and Clinicopathological Parameters
In the extrahepatic NC group, overexpression of ATG5 in hepatocytes was significantly associated with absent gallbladder contractility (P = .005) (Table 4). Furthermore, hepatocyte ATG5 overexpression was significantly correlated with mild portal tract fibrosis (P = .038) and mild portal tract lymphocytic infiltrates (P = .005) (Table 5).
Correlation of Hepatocyte ATG5 H-Score With Laboratory Parameters
Correlation analysis between hepatocyte ATG5 H-scores and laboratory findings is illustrated in Figure 5. In the extrahepatic NC group, a significant negative correlation was observed between hepatocyte ATG5 H-score and total protein levels (r = –0.325, P = .028). In the intrahepatic NC group, significant negative correlations were detected between hepatocyte ATG5 H-score and both total protein (r = –0.433, P = .022) and albumin levels (r = –0.527, P = .004).
(A): Correlation between ATG5 H -score and total protein in extrahepatic NC group. (B): Correlation between ATG5 H score and total protein in intrahepatic NC group (C): Correlation between ATG5 H- score and albumin in intrahepatic NC group.
Relationship Between Biliary Epithelium ATG5 IRS and Clinicopathological Parameters
The associations between biliary epithelium ATG5 immunoreactivity score (IRS) and radiological as well as histopathological parameters in both extrahepatic and intrahepatic NC groups are summarized in Tables 6 and 7. No statistically significant correlations were identified in either group.
In both study groups, no significant associations were detected between ATG5 expression in the biliary epithelium and radiological findings.
In the extrahepatic NC group, overexpression of ATG5 in the biliary epithelium was significantly associated with the absence of extramedullary hematopoiesis (P = .036). In the intrahepatic NC group, ATG5 overexpression was significantly associated with the presence of microabscesses (P = .031) (Tables 6 and 7).
Correlation of Biliary Epithelium ATG5 IRS With Laboratory Parameters
Correlation analysis is shown in Figure 6. In the extrahepatic NC group, no significant correlations were found between ATG5 expression in the biliary epithelium and laboratory parameters. In contrast, in the intrahepatic NC group, biliary epithelium ATG5 overexpression demonstrated a significant positive correlation with ALT levels (r = 0.384, P = .044).
Correlation Between Hepatocyte ATG5 H-Score and Biliary Epithelium ATG5 IRS
In the extrahepatic NC group, a significant positive correlation was observed between hepatocyte ATG5 H-scores and biliary epithelium ATG5 IRS values (r = 0.595, P < .001). In contrast, no significant correlation was found between these parameters in the intrahepatic NC group (table not shown).
Correlation between ATG5 IRS and ALT level in intrahepatic NC group.
Discussion
Neonatal cholestasis (NC), characterized by persistent conjugated hyperbilirubinemia, remains a significant diagnostic challenge despite advancements in diagnostic modalities (11). The exact pathogenesis of biliary atresia (BA), the leading cause of NC, is still unclear (12).
In the present study, patients with extrahepatic NC had significantly higher ALKP and GGT levels. Similarly, Ağın et al reported that serum GGT levels were significantly higher in BA than in non-BA groups (P < .001) (13). Conversely, San et al found that markedly elevated GGT and ALKP levels may also occur in intrahepatic cholestasis caused by ductopenia, cholangitic congenital hepatic fibrosis, cytomegalovirus infection, PFIC type III, and inspissated bile syndrome (14). Both GGT and ALKP are recognized biochemical markers of cholestasis. Increased GGT activity is associated with primary and secondary hepatobiliary disorders, whereas sustained ALKP elevation is more often linked to liver and bone pathology (15). As bile acids accumulate in the liver, they disrupt hepatocyte membranes, releasing GGT and ALKP, while also stimulating ALKP synthesis (16). Elevated serum GGT is therefore considered a reliable marker of bile duct injury (17).
Histopathological assessment was particularly valuable in differentiating intrahepatic from extrahepatic cholestasis in this study. Extrahepatic cases were characterized by portal tract changes—fibrosis, edema, bile duct proliferation, ductular proliferation, and bile plugs—whereas intrahepatic cases were more frequently associated with parenchymal alterations, including extramedullary hematopoiesis (EMH). These findings are consistent with Bilal et al, who observed bile duct proliferation, bile plugs, periportal edema, and fibrosis in all BA patients (18). Portal fibrosis is thought to arise from hepatic stellate cell activation, which drives type I collagen deposition (19). Ductular proliferation may result from pro-inflammatory cytokine signaling, such as osteopontin, or from biliary differentiation of progenitor cells and trans-differentiation of periportal hepatocytes into biliary-type cells (20). Kandil et al also reported that EMH was absent or rare in most BA cases but significantly more frequent in non-BA patients (21). However, Russo et al found no difference between BA and non-BA cases regarding hepatocellular swelling and EMH (22). EMH may reflect residual fetal hepatic hematopoiesis or pathological responses to infection, tumors, anemia, or metabolic stress (23,24). Infection remains one of the most important causes of intrahepatic cholestasis (25).
Autophagy is a lysosome-mediated recycling pathway that maintains cellular homeostasis by degrading damaged organelles, proteins, and intracellular pathogens (4). Autophagy dysfunction has been implicated in diverse liver diseases, including NAFLD, alcoholic liver disease, drug-induced injury, cholestasis, viral hepatitis, and hepatocellular carcinoma (4). In cholestatic liver disease, the role of autophagy is complex and appears to depend on timing (early inflammation vs later bile acid injury) and cell type (hepatocytes vs bile duct epithelium) (26).
Our findings demonstrated significantly higher ATG5 expression in zone II hepatocytes in intrahepatic NC. This is notable, as hepatocyte repopulation in zones I and III is modulated by proliferation originating from zone II (27). Evidence suggests autophagy is essential for maintaining liver progenitor cell (LPC) function. Cheng et al demonstrated that LPCs exhibit higher autophagic activity than differentiated hepatocytes, and ATG5 knockdown impaired LPC self-renewal, proliferation, and hepatic differentiation (28). Furthermore, inhibition of autophagy sensitized LPCs to senescence, while Ma et al reported that ATG5 suppression severely impaired LPC differentiation (29).
We also observed significant associations between hepatocyte ATG5 overexpression and reduced serum total protein and albumin levels. Cholestasis results from impaired bile formation or excretion (30). Prolonged hepatocellular dysfunction reduces albumin synthesis, leading to hypoalbuminemia, a common finding in chronic liver disease (31). Experimental models show that autophagy stimulation during cholestasis reduces liver injury (26). In BA, autophagosome accumulation and elevated mitophagy markers in hepatocytes further support autophagy induction (32). ATG5 plays a central role in protein homeostasis. Its loss, or that of other autophagy regulators such as ATG7, results in endoplasmic reticulum stress, mitochondrial dysfunction, oxidative stress, and impaired protein synthesis (33). mTORC1, a major negative regulator of autophagy, promotes protein synthesis but is itself modulated by autophagy-related proteins, including p62/SQSTM1, which interacts with mTOR-raptor to regulate amino acid sensing (34,35). Thus, autophagy can indirectly self-regulate by modulating mTORC1 and protein synthesis (36).
In extrahepatic NC, hepatocyte ATG5 overexpression was significantly associated with absent gallbladder contractility. This aligns with previous studies showing that gallbladder abnormalities—absence, small size, irregular morphology, abnormal wall thickness, and lack of contraction—are reliable ultrasound features for diagnosing BA (37–39). Embryologically, the hepatic diverticulum gives rise to the liver, intrahepatic and extrahepatic bile ducts, cystic duct, and gallbladder (40). The Notch signaling pathway, essential for biliary morphogenesis, regulates cholangiocyte differentiation from LPCs. Notch deficiency leads to bile duct malformation and cholestasis requiring liver transplantation (41). Autophagy is critical for maintaining biliary epithelium homeostasis and progenitor cell function (42). Notably, autophagy inversely regulates biliary differentiation via mTOR-Notch signaling: mTOR inhibition (e.g., by rapamycin or nutrient deprivation) enhances autophagy, suppressing Notch signaling and biliary differentiation, whereas mTOR activation suppresses autophagy and promotes Notch-STAT3–mediated cholangiocyte differentiation (42).
The present study demonstrated a significant association between hepatocyte ATG5 overexpression in extrahepatic NC and the absence of portal tract fibrosis as well as the presence of only mild lymphocytic infiltrates. Autophagy may exert anti-fibrotic effects by inducing apoptosis of hepatic stellate cells (HSCs), facilitating degradation of pro-fibrotic mediators such as collagen and metalloproteinases, and reducing exosome-mediated profibrotic signaling (43).
ATG5 also plays a critical role in immune regulation. Innate lymphoid cells and natural killer (NK) cells require ATG5 for maturation and survival, particularly during homeostatic proliferation under lymphopenic conditions (44). Similarly, ATG5 deficiency has been shown to reduce thymic cellularity and peripheral T-cell counts by enhancing apoptosis, underscoring its importance in T-cell homeostasis (45).
In the present study, overexpression of ATG5 in the biliary epithelium showed a significant positive correlation with serum ALT levels. Elevated ALT is a marker of hepatocellular injury, ranging from minor to severe (46). In the liver, tumor necrosis factor α (TNFα) is a common mediator of hepatocellular death. Autophagy prevents TNFα-induced injury by inhibiting caspase-8 activation and the mitochondrial apoptotic pathway, suggesting that autophagy may serve as a therapeutic target in TNF-dependent tissue injury (47).
Within the intrahepatic NC group, biliary epithelium ATG5 overexpression was significantly associated with the presence of microabscesses. Autophagy has been shown to exert protective effects in sepsis by modulating macrophage polarization and suppressing inflammasome activation (48). Under septic conditions, autophagy activation via ATF4 protects liver function (49), which may explain this association.
In contrast, in the extrahepatic NC group, ATG5 overexpression in biliary epithelium was significantly associated with the absence of extramedullary hematopoiesis (EMH). Autophagy-related proteins are critical for hematopoiesis (50), and hematopoietic cell–specific ATG5 deficiency results in lymphopenia, anemia, and survival defects (51).
The present study also revealed significant positive correlations between hepatocyte ATG5 H-scores and biliary epithelium ATG5 IRS values in the extrahepatic NC group. This finding may reflect crosstalk between resident and non-resident liver cells during cholestatic injury. Multiple cell types, including cholangiocytes, HSCs, portal fibroblasts, and vascular cells, interact in the setting of cholestasis to drive liver damage and fibrosis (52). Cholangiocyte injury, in particular, initiates a cascade of cellular signaling that promotes ductular reaction, biliary and bridging fibrosis, and eventual progression to chronic liver disease and cirrhosis (52).
Cholestasis induces hepatic bile acid accumulation, which disrupts transport and homeostatic mechanisms, promoting fibrosis through interactions with portal fibroblasts and HSCs. Angiogenesis is closely linked to biliary fibrosis, with angiocrine signaling between portal fibroblasts, HSCs, and endothelial cells contributing to disease progression. Furthermore, immune cell infiltration during cholestasis and cholangiopathies exacerbates fibrogenesis, with different immune subsets exerting distinct effects on portal fibroblasts, HSCs, and cholangiocytes (53).
Conclusion
In extrahepatic NC, portal tract changes were more prominent, whereas in intrahepatic NC, parenchymal alterations predominated. ATG5 expression may serve as a useful adjunctive marker, alongside histopathological features, to help distinguish intrahepatic from extrahepatic NC.
Our findings suggest that ATG5 may play a dual role in NC. In extrahepatic NC, ATG5 overexpression appeared protective, being associated with only mild fibrosis and mild inflammation. In contrast, in intrahepatic NC, ATG5 overexpression was linked to elevated ALT levels, suggesting a potential contribution to hepatocellular injury. The preferential overexpression of ATG5 in zone II hepatocytes further supports its role in maintaining hepatic regeneration and protecting against injury.
Taken together, ATG5 may represent a promising surrogate diagnostic marker and a potential therapeutic target in neonatal cholestasis.
Data Availability
There is no additional data separate from available in cited references.
The reference list from the paper itself. Each links out to its DOI / PubMed record.
- 1Karpen SJ Pediatric Cholestasis: Epidemiology, Genetics, Diagnosis, and Current Management Clin Liver Dis (Hoboken)202015311593268513710.1002/cld.895PMC 7346681 · doi ↗ · pubmed ↗
- 2El-Guindi MA Saber MA Shoeir SA Abdallah AR Sira AM Variant etiologies of neonatal cholestasis and their outcome: a Middle East single-center experience Clin Exp Hepatol 202172205143429598910.5114/ceh.2021.107066 PMC 8284164 · doi ↗ · pubmed ↗
- 3Lin PW Chu ML Liu HS Autophagy and metabolism Kaohsiung J Med Sci 20213711293302107810.1002/kjm 2.12299 PMC 11896468 · doi ↗ · pubmed ↗
- 4Kouroumalis E Voumvouraki A Augoustaki A Samonakis DN Autophagy in liver diseases World J Hepatol 20211316653358498610.4254/wjh.v 13.i 1.6PMC 7856864 · doi ↗ · pubmed ↗
- 5Cao W Li J Yang K Cao D An overview of autophagy: Mechanism, regulation and research progress Bull Cancer 20211083304223342377510.1016/j.bulcan.2020.11.004 · doi ↗ · pubmed ↗
- 6Lee WS Looi LM Usefulness of a scoring system in the interpretation of histology in neonatal cholestasis World J Gastroenterol 200915425326331990834210.3748/wjg.15.5326 PMC 2776861 · doi ↗ · pubmed ↗
- 7El-Araby HA Saber MA Radwan NM Taie DM Adawy NM Sira AM Temporal histopathological changes in biliary atresia: A perspective for rapid fibrosis progression Ann Hepatol 2021211002633300742910.1016/j.aohep.2020.09.007 · doi ↗ · pubmed ↗
- 8Ishak K Baptista A Bianchi L Callea F De Groote J Gudat F Histological grading and staging of chronic hepatitis J Hepatol 19952266969756086410.1016/0168-8278(95)80226-6 · doi ↗ · pubmed ↗