OCIAD2 as a novel prognostic and therapeutic biomarker for pancreatic cancer: A study based on transcriptomic signature and bioinformatics analysis
Zhongyuan Cui, Xia Lei, Yani Gou, Zhixian Wu, Xiaojun Huang, Ilya Ioshikhes, Hao Hu, Ilya Ioshikhes, Hao Hu, Ilya Ioshikhes, Hao Hu, Ilya Ioshikhes, Hao Hu

TL;DR
This study identifies OCIAD2 as a potential biomarker for predicting outcomes and guiding treatment in pancreatic cancer patients.
Contribution
The study introduces OCIAD2 as a novel prognostic and therapeutic target in pancreatic cancer through transcriptomic and bioinformatics analysis.
Findings
OCIAD2 is highly expressed in pancreatic tumor tissues and is associated with the JAK-STAT and cell cycle pathways.
Knocking down OCIAD2 reduces the expression of key genes in the JAK-STAT and cell cycle pathways.
OCIAD2 expression correlates with sensitivity to 25 compounds, suggesting its role in drug response.
Abstract
It is urgent to explore the potential biomarkers for pancreatic cancer (PC) prognosis and treatment to improve patients’ outcomes. Firstly, we performed an integrated bioinformatics analysis based on extensive transcriptome data from 615 PC tumors and 329 adjacent tissues, screening for genes with prognostic value. We then validated the prognostic value of OCIAD2, DCBLD2, and SAMD9 in different datasets and analyzed their expression levels in single-cell sequencing datasets of normal, paracancer, primary, and metastatic tissues. Next, we further explored the carcinogenic effect after knocking down the expression of OCIAD2 in PC cancer cell line. Finally, a drug sensitivity analysis was conducted. Differentially expressed genes (DEGs) analysis identified 22 DEGs: ACSL5, ANTXR1, AP1S3, ATP2C2, B3GNT5, C15orf48, CAPG, CTSK, DAPP1, DCBLD2, GPX8, HEPH, IFI44, KRT23, NCF2, OCIAD2, SAMD9,…
Genes, proteins, chemicals, diseases, species, mutations and cell lines named across the full text — each resolved to its canonical identifier and authoritative record.
Click any figure to enlarge with its caption.
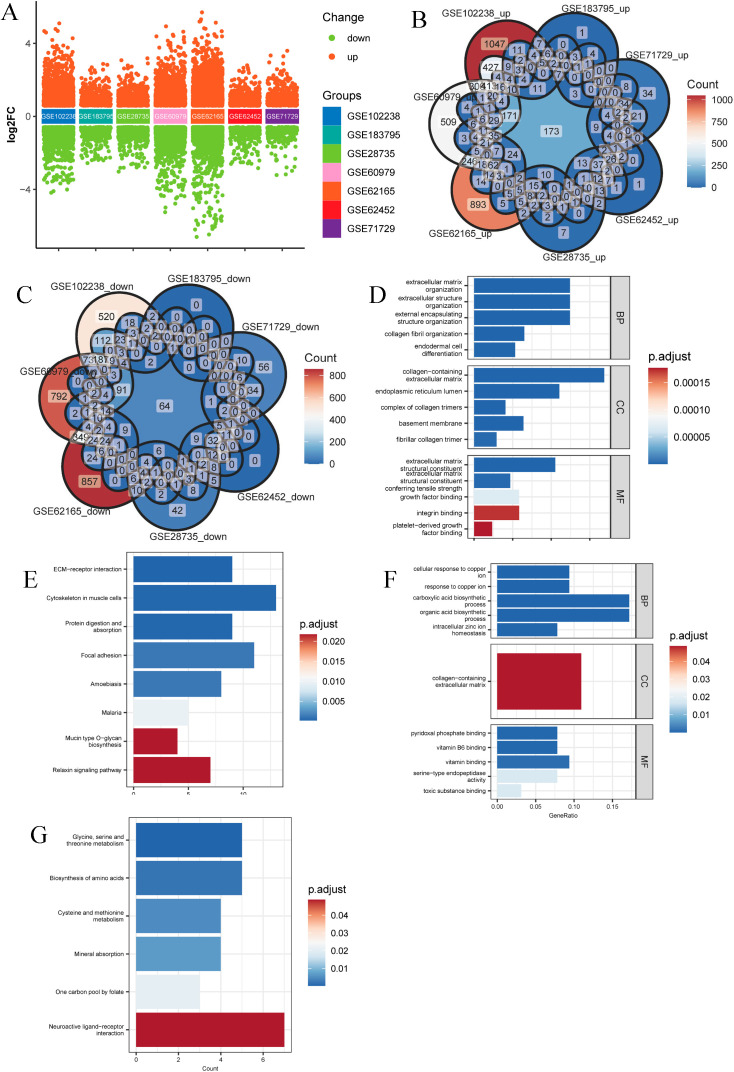 Fig 1
Fig 1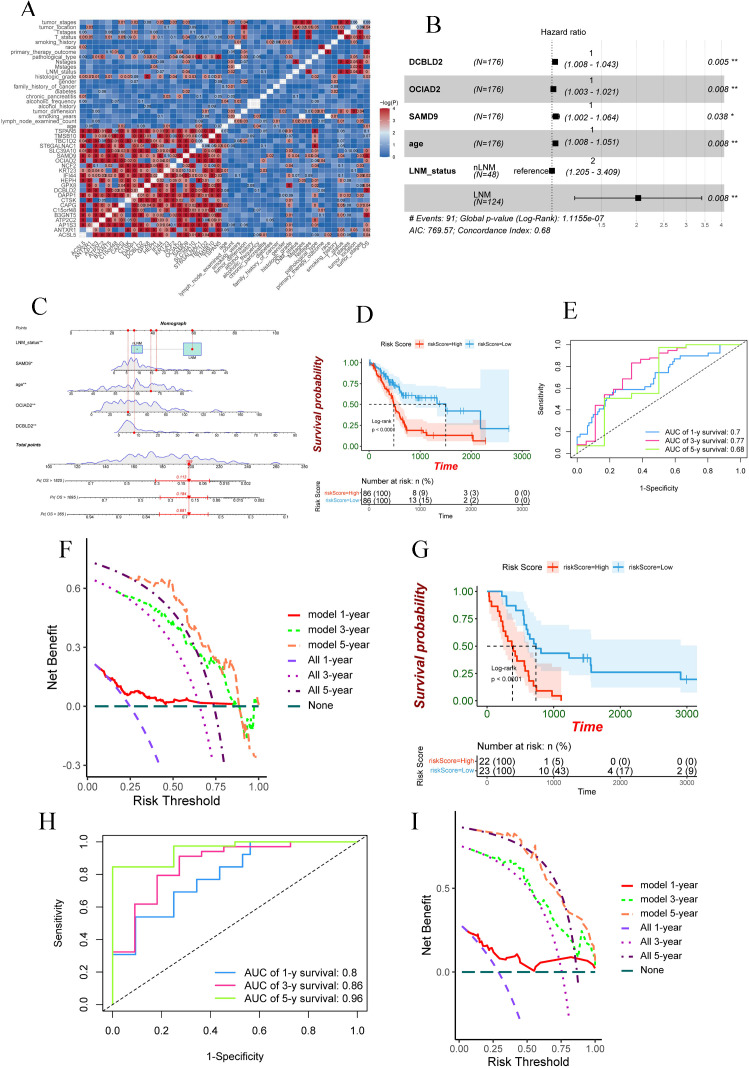 Fig 2
Fig 2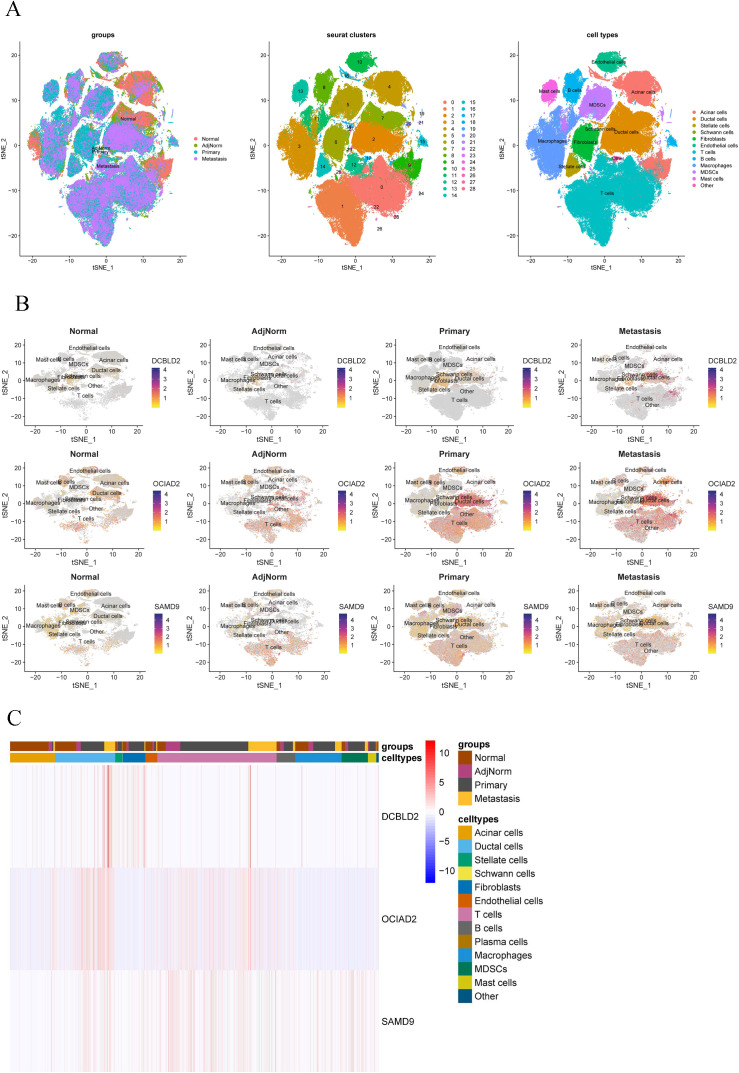 Fig 3
Fig 3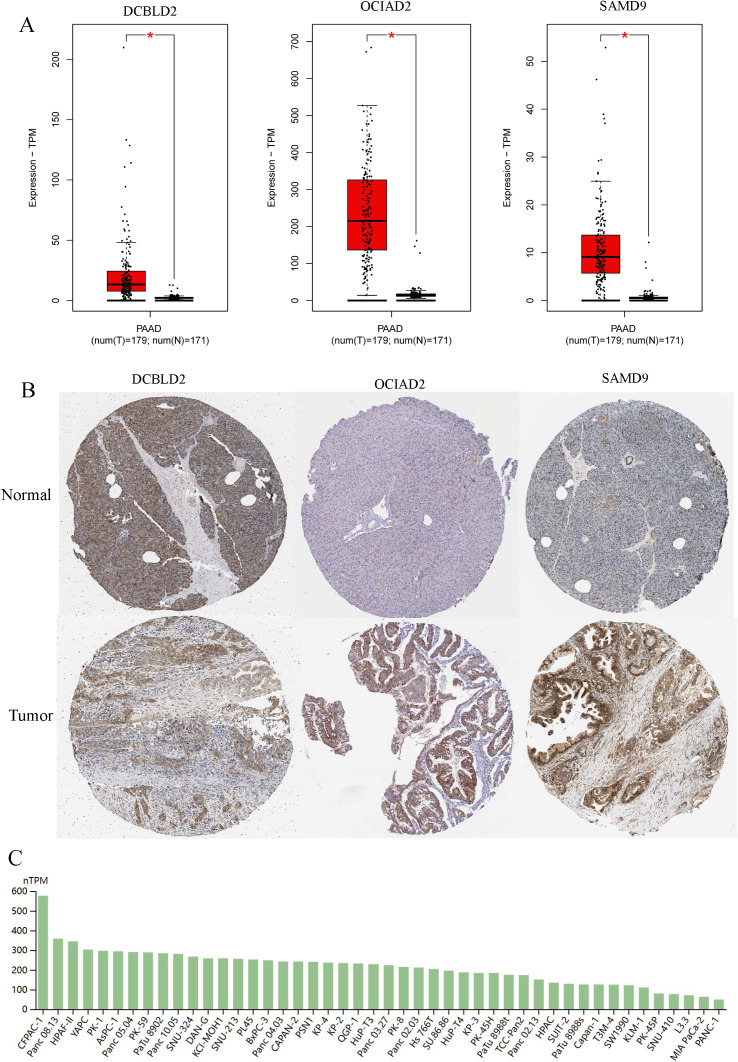 Fig 4
Fig 4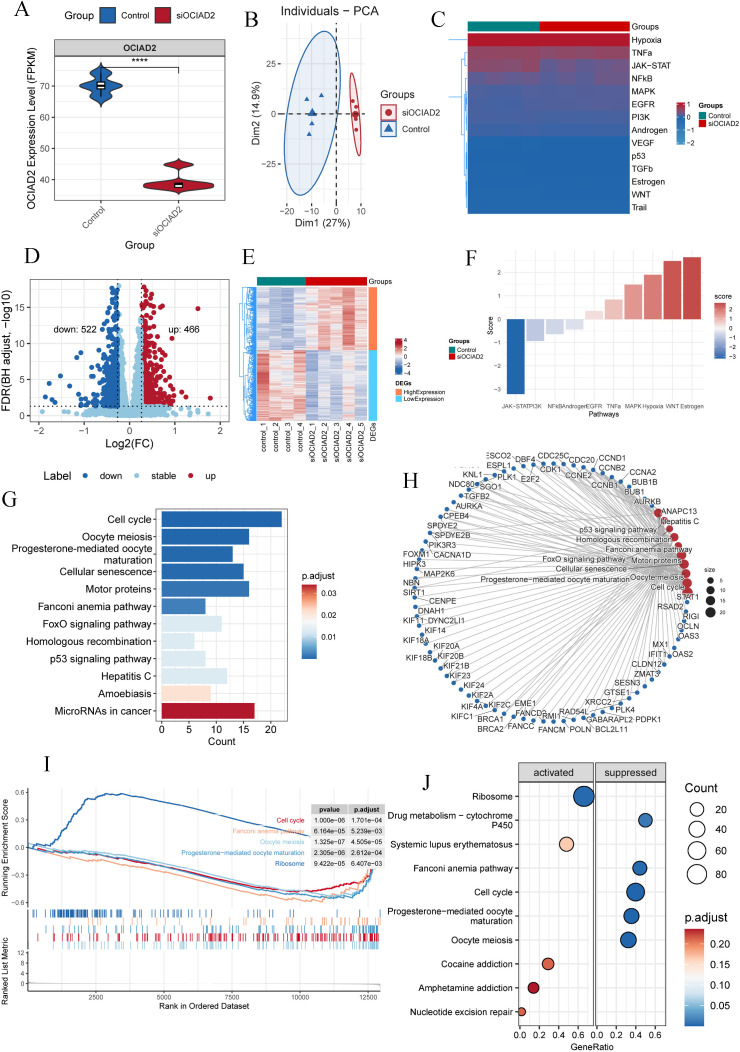 Fig 5
Fig 5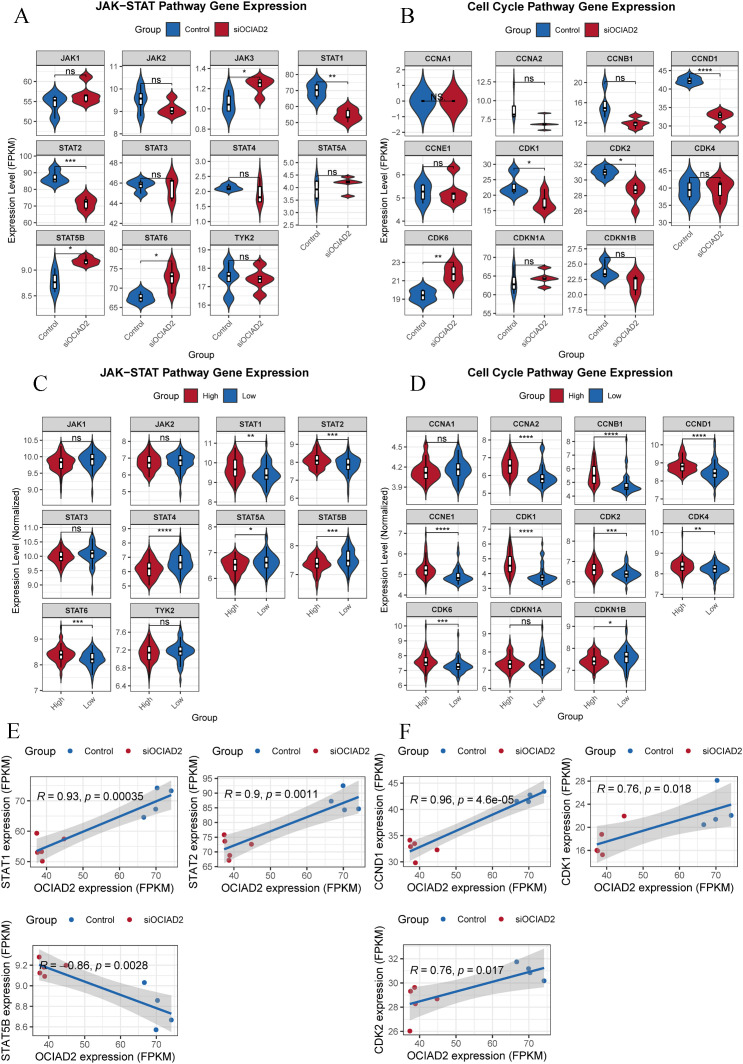 Fig 6
Fig 6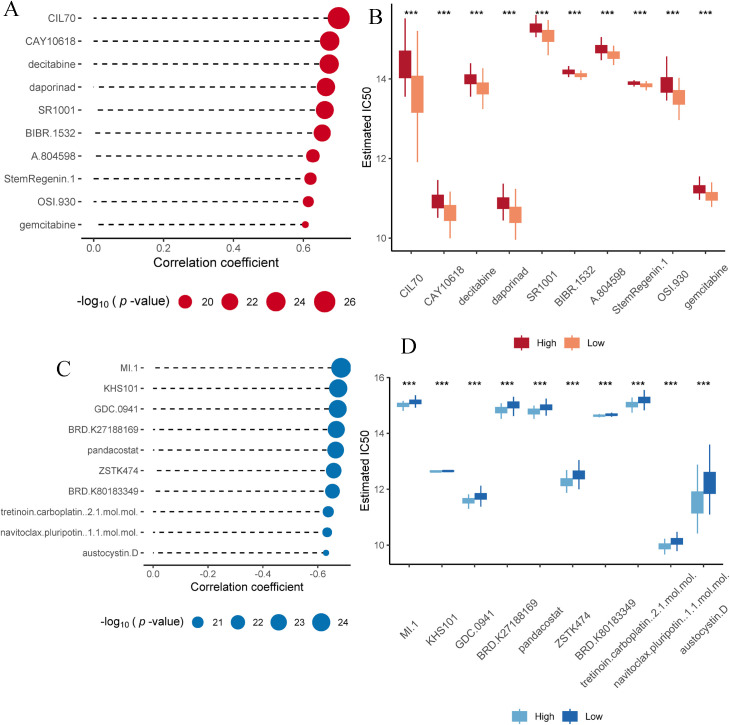 Fig 7
Fig 7- —2022 Drug Supervision Scientific Project of Gansu Provincial Food and Drug Administration
- —Science and Technology Innovation Joint Fund Project of Fujian Province
- —Cuiying Science and Technology Innovation Program of the Second Hospital of Lanzhou University
Peer Reviews
No public reviews on file for this paper yet. If you reviewed it on a platform where reviews are public (OpenReview, ICLR, NeurIPS, ICML), you can paste yours below so the community can read it here.
Videos
No videos yet. Explain this paper in a talk, walkthrough, or lecture? Add one.
Taxonomy
TopicsPancreatic and Hepatic Oncology Research · Ferroptosis and cancer prognosis · RNA modifications and cancer
Introduction
Pancreatic cancer (PC) is one of the most malignant tumors. Recent tumor epidemiology shows its incidence ranks 10th and mortality ranks 6th [1]. Although PC does not have the highest incidence, PC has the worst 5-year survival rate. Recent studies report that the highest 5-year survival rate was only 12% [1,2]. To improve the PC prognosis, numerous clinical trials have been conducted, yet most have not met expectations. Reports showed that the failure rate of phase III clinical trials for PC was the highest among common solid cancers [3].
Biomarkers for diagnosis, treatment, and research indicate that clinical drug trials based on various mutations have not yielded satisfactory results [4–6]. Other novel targeted therapies have also failed to improve overall survival (OS) [7–9]. PC’s ability to escape immune surveillance early in the disease haprognostic evaluation is are critical tool in PC precision medicine. Accurate biomarkers can better stratify patients and guide treatment plans. CA19–9 is currently the only biomarker used for PDAC, primarily for assessing recurrence and response to therapy [10]. Several currently reported biomarkers stem from small heterogeneous tumor samples, without extensive validation, posing a challenge to their reliability [11].
These reasons contribute to the difficulties in improving the 5-year survival for PC. Moreover, the incidence of PC is predicted to increase shortly, potentially surpassing colorectal cancer and becoming the second leading cause of cancer-related death after lung cancer [12]. Despite progress in basic or translational research on PDAC biology, diagnosis, treatment, and prognosis in the past two decades, research lags behind other cancer types [13]. We conducted an integrated study with analysis of a large amount of published PDAC transcriptomic and clinical data while performing mechanistic experiments, aiming at identifying promising novel prognostic and therapeutic biomarkers for PC patients.
Materials and methods
Analysis of differentially expressed genes (DEGs) in pancreatic tumors and adjacent tissues
We used the keywords “pancreatic cancer”, “pancreatic ductal adenocarcinoma”, “pancreatic ductal carcinoma”, or “Pancreatic adenocarcinoma (PAAD)” to search the Gene Expression Omnibus (GEO) database. We obtained the transcriptome data of PC and adjacent tissues from 7 independent studies, such as GSE102238 [14], GSE183795 [15], GSE71729 [16], GSE62452 [17], GSE28735 [18], GSE62165 [19], and GSE60979 [20] (Table A in S1 Text). For repeated probes or genes in these microarray expression data, we keep only the median value and then use the biomaRt (version 2.56.1) package [21] to filter protein-coding genes, keeping only those genes expressed in all tumor tissue samples for differential analysis. Differentially expressed genes were identified using the limma (version 3.56.2) package [22]. Fold change of ≥ 1.5 and adjusted p-values of ≤ 0.05 were used as a threshold for significant DEGs. After independent analysis of each group of data, the up-regulated and down-regulated DEGs were intersected respectively. Finally, Gene Ontology (GO) and Kyoto encyclopedia of genes and genomes (KEGG) enrichment analysis were performed using the clusterProfiler package (version 4.10.1) [23].
Screening DEGs with prognostic value
The upregulated DEGs with unclear function and mechanism were searched through the PubMed database for subsequent analysis. First, we conducted a preliminary screening in the Kaplan-Meier Plotter database [24] to select genes with prognostic value. Next, the Cancer Genome Atlas (TCGA) pancreatic adenocarcinoma (PAAD) fpkm transcriptome and clinicopathological data were downloaded via UCSC Xena [25] to analyze the relationship between DEGs with prognostic value, prognosis, and other clinicopathological features. GSE79668 [26] dataset was used to investigate the relationship between DEGs and the prognosis of PC patients. Multivariate Cox analysis and visualization of survival using survival (version 3.5-8) (https://CRAN.R-project.org/package=survival) and survminer (version 0.4.9) Package (https://CRAN.R-project.org/package=survminer). The regplot (version 1.1) package (https://CRAN.R-project.org/package=regplot) was used to construct the nomogram based on the prediction model. The area under the time-dependent ROC curve of the prediction model was calculated using the timeROC package [27]. Decision curve analysis (DCA) by the ggDCA (version 1.2) package was used to evaluate the clinical net benefit of the prediction models (https://github.com/yikeshu0611/ggDCA).
The mRNA expression levels of DCBLD2, OCIAD2, and SAMD9 in various tissues by single-cell sequencing
Single-cell sequencing datasets of normal tissues and PC were retrieved from the GEO database. Those are GSE155698 [28], GSE154778 [29], GSE197177 [30], GSE212966 [31], GSE229413 [32], and GSE156405 [33]. These datasets contained single-cell sequencing data of normal pancreas, adjacent normal, primary, and metastatic tumor tissues. The data was analyzed and visualized by R software (version 4.3.0, The R Foundation for Statistical Computing, Vienna, Austria) using Seurat (version 5.0.3) [34], harmony (version 1.2.0) [35], Dittoseq (Version 1.14.2) [36], and Scientomize (Version 2.1.2) packages. The analysis process is in S2 Text.
The expression of DCBLD2, OCIAD2 and SAMD9 proteins in clinical specimens
The Human Protein Atlas (HPA) database [37] and Gene Expression Profiling Interactive Analysis (GEPIA) [38] were used to investigate the protein and mRNA expression levels of DCBLD2, OCIAD2, and SAMD9 in normal and tumor pancreatic tissues, respectively.
Cell culture
The BxPC-3 pancreatic cancer cell line was purchased from Suzhou Haixing Biosciens Co., Ltd. BxPC-3 cells were cultured in RPMI-1640 medium supplemented with 10% fetal bovine serum (FBS) (HyCyte, Cat# FBP-C520, China), 1% streptomycin and penicillin in an incubator at 37^°^C with 5% CO_2_.
siRNA transfection
The siRNA targeting OCIAD2 was designed and synthesized by Beijing Tsingke Biotech Co., Ltd. The siRNA sequence was: Sense: GACUAGUCUACCAAGGUUA(dT)(dT), Anti-sense: UAACCUUGGUAGACUAGUC (dT)(dT). The negative control sequence was: Sense: UUCUCCGAACGUGUCACGUTT, Anti-sense: ACGUGACACGUUCGGAGAATT. TSnanofect V2 (Tsingke, Cat# TSV405, China) transfection reagent was purchased from Beijing Tsingke Biotech Co., Ltd. BxPC-3 cells were cultured in 6 or 24-well plates and transfected according to the TSnanofect V2 transfection reagent and siRNA instructions when the cells were in the logarithmic growth phase and used for subsequent experiments after 24 hours.
RNA sequencing and bioinformatics analysis
To explore the potential mechanism OCIAD2 promotes progress in PC, we conducted the transcriptome sequencing and analysis. siRNA targeting knockdown of OCIAD2 and negative controls were transfected into BxPC-3 cells. After 48 hours, cells from each group were collected, and TRIzol reagent was added to extract total RNA. Transcript sequencing was performed by Tsingke Biotech (Beijing, China). RNA extraction and subsequent transcription sequencing library preparation followed the instructions provided by the manufacturer. The main Library preparation Kit used was VAHTS Universal V6 RNA-seq Library Prep kit for MGI (Cat# NRM604–01), and the sequencing platform was BGI DNBSEQ-T7 sequencer.
DEGs analysis was performed using the Limma (Version 3.56.2) package [22]. DEGs were defined as fold change of ≥ 1.2 and adjusted p-values of ≤0.05. The clusterProfiler (version 4.10.1) package [23] was used for GO, KEGG, and Gene Set Enrichment Analysis (GSEA). The inference of the pathways’ status in each sample was conducted via the run_wmean and run_mlm functions of the decoupleR package (version 2.8.0) [39].
Drug sensitivity analysis of potential targets
Based on the gene expression matrix of 38 pancreatic Cancer cell lines and 545 drug sensitivity data from the Cancer Therapeutics Response Portal (CTRP) [40], the oncoPredict package [41] was used to evaluate the 545 drug IC50 values of TCGA pancreatic cancer samples. The IC50 value is used as a measure of drug susceptibility, with a higher IC50 value indicating a lower sensitivity to the drug. Then, Pearson correlation coefficients were calculated between IC50 and OCIAD2 expression for all drugs in the TCGA-PAAD cohort. A correlation coefficient of ≥0.6 and a p-value of ≤0.05 are considered to have a significant correlation. Finally, the top 10 compounds with the strongest positive and negative correlations were visualized.
Statistical analysis
Statistical analysis and visualization were performed using R software (version 4.3.0, The R Foundation for Statistical Computing, Vienna, Austria). All experimental data were represented by the mean ± SEM (Standard Error of the Mean). The comparison between multiple groups using analysis of variance (ANOVA) and unpaired two-tailed Student’s t-test. Non-normal distribution data using nonparametric statistical analysis. p < 0.05 was considered statistically significant.
Result
The significant DEGs in the pancreatic tumor tissue
First, we performed differentially expressed genes analysis on the transcriptome data of pancreatic tumors and adjacent normal tissues from 7 independent studies, including GSE102238 [14], GSE183795 [15], GSE71729 [16], GSE62452 [17], GSE28735 [18], GS E62165 [19] and GSE60979 [20] (Fig 1A). The results showed that the significantly up-regulated and down-regulated genes in each dataset: 3053 and 1291 for GSE102238, 619 and 271 for GSE183795, 499 and 312 for GSE71729, 689 and 302 for GSE62452, 754 and 448 for GSE28735, 2766 and 1919 for GSE62165, GSE60979 for 2263 and 1735 (Table B in S1 Text and S1 Data). Then, the intersection of DEGs was taken separately, and it was found that 173 genes were significantly up-regulated in all seven datasets (Fig 1B), and 64 genes were significantly down-regulated in all seven datasets (Fig 1C). Finally, GO and KEGG enrichment analyses were performed for up-regulated and down-regulated DEGs, respectively. The results showed that 173 up-regulated DEGs were mainly enriched in extracellular in biological process (BP), cellular component (CC), and molecular function (MF), respectively, extracellular matrix organization, collagen−containing extracellular matrix and extracellular matrix structural constituent (Fig 1D). KEGG enrichment analysis showed that up-regulated DEGs were mainly enriched in ECM−receptor interaction, cytoskeleton in muscle cells, protein digestion and absorption, and focal adhesion (Fig 1E). The 64 down-regulated DEGs in BP, CC, and MF were mainly enriched by cellular response to copper ion, collagen-containing extracellular matrix, and pyridoxal phosphate binding, respectively (Fig 1F). KEGG enrichment analysis showed that 64 down-regulated DEGs were mainly enriched in glycine, serine, and threonine metabolism, biosynthesis of amino acids, and cysteine and methionine metabolism (Fig 1G).
Bulk sequencing data from pancreatic tumors and adjacent normal tissue based on 7 independent studies revealed significant DEGs that were prevalent in pancreatic cancer.(A) Distribution of DEGs in each dataset. (B) The intersection of significantly up-regulated DEGs in each data set, 173 genes were significantly up-regulated in all 7 datasets. (C) The intersection of DEGs was significantly down-regulated in each dataset, with 64 genes significantly down-regulated in all 7 datasets. (D-E) Enrichment results of significantly up-regulated DEGs in GO and KEGG analyses. (F-G) Enrichment results of significantly down-regulated DEGs in GO and KEGG analysis.
DCBLD2, OCIAD2, and SAMD9 identified as novel biomarkers with independent prognostic value
We further investigated the 173 up-regulated DEGs by searching PubMed and Kaplan-Meier Plotter databases. DEGs with unclear function in PC and prognostic value were selected for subsequent studies. The results showed that 22 DEGs, including ACSL5, ANTXR1, AP1S3, ATP2C2, B3GNT5, C15orf48, CAPG, CTSK, DAPP1, DCBLD2, GPX8, HEPH, IFI44, KRT23, NCF2, OCIAD2, SAMD9, SLC39A10, ST6GALNAC1, TBC1D2, TMSB10 and TSPAN5, possessed prognostic value and their related functions and mechanisms in PC had not been reported (Table 1). Next, we explored the relationship between these 22 DEGs and various clinicopathological parameters using the TCGA PAAD dataset (Fig 2A). Furthermore, multivariate Cox and stepwise regression analysis showed that DCBLD2, OCIAD2, SAMD9, age, and lymph node metastasis (LNM) status were independent prognostic factors for PC patients (p < 0.05) (Fig 2B). We constructed a Nomogram to predict the 1,3, and 5-year survival rates of patients based on the Cox model (Figs 2C and S1). Patients with a high predictive score in the prognostic model had a worse prognosis (p < 0.0001) (Fig 2D). The time-dependent receiver operating characteristic curve (ROC) and the area under the curve (AUC) illustrated the predictive sensitivity and specificity of this nomogram at 1, 3, and 5-year survival rates. The results of the analysis showed that the AUC for 1,3, and 5-year survival rates were 0.7, 0.77, and 0.68, respectively (Fig 2E). Clinical decision curve analysis results show that the prognostic model aided clinical decision-making to benefit patients (Fig 2F).
Table 1: Correlation between the DEGs mRNA expression and the survival of PAAD patients.
DCBLD2, OCIAD2, and SAMD9 are novel biomarkers with prognostic value.(A) Correlation between the 22 DEGs and various clinicopathological features of pancreatic cancer patients. (B) Cox prognostic model based on DCBLD2, OCIAD2, SAMD9, age, and lymph node metastasis status. (C) Nomogram based on the Cox prognostic model to predict the 1,3, and 5-year survival rates of patients. (D) Patients with high prognostic model scores had worse prognosis in TCGA pancreatic cancer dataset. (E) AUC of prognostic model predictive efficacy for 1,3, and 5-year survival in the TCGA pancreatic cancer dataset. (F) Clinical decision curve analysis results in the TCGA pancreatic cancer dataset. (G) Patients with high prognostic model scores in the GSE79668 dataset had a worse prognosis. (H) AUC of prognostic model predictive efficacy for 1,3, and 5-year survival in the GSE79668 dataset. (I) Results of clinical decision curve analysis in the GSE79668 dataset.
We validated the performance of the prognostic model in the GSE79668 [26] dataset. The results showed that the prognosis of PC patients with high prognostic model scores was significantly worse than those with low scores (Fig 2G). In the GSE79668 [26] dataset, the AUC of 1-, 3-, and 5-year survival rates of the prognostic model were 0.8, 0.86, and 0.96, respectively (Fig 2H). Similarly, the results of clinical decision curve analysis showed that the prognostic model aided clinical decision-making (Fig 2I).
The expression levels of DCBLD2, OCIAD2, and SAMD9 in normal pancreatic, adjacent normal, primary, and metastatic tumor tissues
We retrieved 6 independent single-cell sequencing datasets, GSE155698 [28], GSE154778 [29], GSE197177 [30], GSE212966 [31], GSE229413 [32], and GSE156405 [33] from the GEO database. The datasets contained single-cell transcriptome sequencing data from 13 normal pancreatic tissues, 10 adjacent normal tissues, 57 primary tumors, and 13 metastatic tumors. A total of 225845 cells were obtained from these 93 tissues after quality control and filtration, and 29 cell clusters were obtained after clustering and grouping (Fig 3A). After annotation, it can be divided into 12 types of cells, including acinar cells, ductal cells, stellate cells, Schwann cells, fibroblasts, endothelial cells, T cells, B cells, macrophages, myeloid-derived suppressor cells (MDSCs), and mast cells (Fig 3A). Next, we analyzed the expression levels of DCBLD2, OCIAD2, and SAMD9 in each tissue cell subpopulation. The results showed that DCBLD2 mRNA expression was highest in ductal cells with metastatic cancer (Fig 3B and 3C). The expression of OCIAD2 mRNA was highest in ductal cells and T cells of primary and metastatic tumors (Fig 3B and 3C). SAMD9 mRNA was highly expressed in both primary and metastatic ductal cells (Fig 3B and 3C), and was also higher in T cells from adjacent normal tissues (Fig 3B and 3C).
The expression of DCBLD2, OCIAD2 and SAMD9 in pancreatic normal, adjacent normal, primary, and metastatic tumor tissues by single-cell sequencing.(A) Dimensionality reduction cluster and cell subpopulation annotation results of 93 pancreatic normal, adjacent normal, primary, and metastatic tumor samples, combined with batch removal effect. (BC) After cell type annotation, the expression of DCBLD2, OCIAD2, and SAMD9 was analyzed in normal pancreatic, adjacent normal, primary, and metastatic tumor tissues.
In addition, we found that, compared with DCBLD2 and SAMD9, OCIAD2 had the highest RNA and protein expression levels in PC tissues (Fig 4A and 4B). Therefore, we conducted further research on OCIAD2. For typical outcomes, BxPC-3 cell line with moderate OCIAD2 expression in pancreatic cancer cell lines was selected for subsequent experiments (Fig 4C).
The expression level of DCBLD2, OCIAD2, and SAMD9 in pancreatic tumor tissue and cell lines.(A) The mRNA expression levels of DCBLD2, OCIAD2, and SAMD9 in pancreatic cancer and normal tissues (GEPIA). (B) The protein expression level of DCBLD2, OCIAD2, and SAMD9 in pancreatic cancer and normal tissues (HPA). (C) The mRNA expression levels of OCIAD2 in 46 pancreatic cancer cell lines (HPA).
Knockdown of OCIAD2 in pancreatic cancer cells significantly inhibited JAK-STAT and cell cycle signaling pathways
To further understand the mechanism by which OCIAD2 promotes PC progression, we performed transcriptomic sequencing analysis after knocking down OCIAD2 expression in the BxPC-3 cell line. The results of transcriptome sequencing showed that the mRNA expression level of the OCIAD2 knockdown group was significantly lower than in the control group in BxPC-3 cells (Fig 5A). PCA analysis of the transcriptome data showed that the first two principal components (PC1, PC2) could clearly distinguish different samples with OCIAD2 knockdown from the control group (Fig 5B). To explore which pathways were inhibited or activated in the OCIAD2 knockdown group compared to the control group, we used the run_wmean function of the decoupleR package [39] to analyze the transcriptome data of the two groups of samples. The results showed that the JAK-STAT signaling pathway was significantly inhibited in the OCIAD2 knockdown group (Fig 5C). Next, we conducted differential gene expression analysis on the transcriptome data. The results showed that 466 genes were up-regulated and 522 genes were down-regulated in the OCIAD2 knockdown group compared with the control group (Fig 5D and 5E). Based on DEGs and corresponding t values, we further analyzed the signaling pathways that were abnormally activated or inhibited between the OCIAD2 knockdown group and control group using the run_mlm function. The results showed that the activities of JAK-STAT, PI3K, NFkB, and Androgen pathways were significantly inhibited in the OCIAD2 knockdown group (Fig 5F). Then, we performed KEGG enrichment analysis of down-regulated DEGs in the OCIAD2 knockdown group (Fig 5G and 5H). KEGG analysis showed that down-regulated DEGs were mainly enriched in cell cycle, oocyte meiosis, progesterone-mediated oocyte cellular senescence, and so on (Fig 5H). GSEA analysis was performed for all DEGs, and the results also showed that down-regulated genes were mainly enriched in the cell cycle pathway (Fig 5I and 5J).
The mechanism of targeting OCIAD2 to inhibit the progression of pancreatic cancer.(A) The expression level of OCIAD2 mRNA in the siRNA interference group in the BxPC-3 cell line was significantly down-regulated compared with the control group. (B) Principal component analysis results at the transcriptome level of the two groups of samples. (C) The activation of 14 signaling pathways in the OCIAD2 knockdown group. (D-E) Volcano plot and heat map of up-and down-regulated DEGs in the OCIAD2 knockdown group. (F) The activities of JAK-STAT, PI3K, NFkB, and Androgen pathways in the OCIAD2 knockdown group. (G) KEGG enrichment analysis of down-regulated DEGs in the OCIAD2 knockdown group. (K) DEGs enriched in each major pathway in KEGG analysis. (I-J) GSEA analysis results of DEGs after OCIAD2 knockdown.
Knockdown of OCIAD2 significantly down-regulated STAT1 and STAT2 in JAK-STAT pathway and CCND1, CDK1 and CDK2 in cell cycle pathway
In order to further verify whether core genes in JAK-STAT and cell cycle signaling pathways are changed at the transcriptomic level, subsequent expression and correlation analysis were performed. Firstly, the expression levels of JAK1, JAK2, JAK3, TYK2, STAT1, STAT2, STAT3, STAT4, STAT5A, STAT5B and STAT6 in JAK-STAT pathway were verified after OCIAD2 knockdown. The results revealed that both STAT1 and STAT2 were significantly down-regulated after knockdown of OCIAD2, whereas JAK3, STAT5B, and STAT6 were all up-regulated (Fig 6A). Knockdown of OCIAD2 significantly down-regulated CCND1, CDK1, and CDK2 and up-regulated CDK6 in the cell cycle signaling pathway (Fig 6B). Whether OCIAD2 expression in real tumor tissues may also affect the expression of related genes in the JAK-STAT and cell cycle pathways is unknown, and we investigated this with data from GSE183795 [15]. The results showed that the expression levels of STAT1, STAT2 and STAT6 in JAK-STAT pathway were also significantly lower, while STAT4, STAT5A and STAT5B were higher in tumors with low OCIAD2 expression (Fig 6C). Expression levels of CCNA2, CCNB1, CCND1, CCNE1, CDK1, CDK2, CDK4, and CDK6 in the cell cycle pathway were all significantly lower in OCIAD2 low-expressing tumor tissues, while CDKN1B was higher (Fig 6D). Based on these results, further analysis revealed a significant positive correlation between OCIAD2 expression and the expression of STAT1 and STAT2 in the JAK-STAT pathway, and a significant negative correlation between OCIAD2 expression and STAT5B (Fig 6E). The expression of OCIAD2 was positively correlated with CCND1, CDK1, and CDK2 in the cell cycle pathway (Fig 6F).
Effects of OCIAD2 on JAK-STAT and cell cycle signaling pathways.(A, B) Alterations in core genes in the JAK-STAT and cell cycle pathways following knockdown of OCIAD2 expression in the BxPC-3 cell line. (C-D) Expression levels of core genes in JAK-STAT and cell cycle pathways in PC tumor tissues in different OCIAD2 groups. (E-F) Correlation of OCIAD2 expression with STAT1, STAT2, STAT5B, CCND1, CDK1 and CDK2.
The most sensitive compounds corresponding to different OCIAD2 expression levels
To identify potential therapeutic agents for PC patients with different OCIAD2 expression, we performed drug sensitivity analyses (S2 Data). The analysis found that the top 10 drugs that were significantly positively correlated with OCIAD2 expression were CIL70, CAY10618, decitabine, daporinad, SR1001, BIBR.1532, A.804598, StemRegenin.1, OSI.930, and gemcitabine (Fig 7A). It is suggested that these drugs may be more sensitive to patients with low expression of OCIAD2, but not suitable for patients with high expression of OCIAD2 (Fig 7B). The top 10 drugs significantly negatively correlated with OCIAD2 expression were MI.1, KHS101, GDC.0941, BRD.K27188169, pandacostat, ZSTK474, BRD.K80183349, tretinoin.carboplatin..2.1.mol.mol., navitoclax.pluripotin..1.1.mol.mol., and austocystin.D, respectively. (Fig 7C). This suggests that patients with high OCIAD2 expression are more sensitive to these drugs, whereas patients with low expression are less sensitive (Fig 7D).
The most sensitive compounds corresponding to PC patients with high and low OCIAD2 expression.(A) Top 10 compounds with significant positive correlations with OCIAD2 expression. (B) IC50 values of positively correlated compounds at different OCIAD2 levels. (C) Top 10 compounds with significant negative correlations with OCIAD2 expression. (D) IC50 values of negatively correlated compounds at different OCIAD2 levels.
Discussion
In this study, based on comprehensive transcriptomic and clinical data, we discovered many genes that are poorly understood but may be very important in pancreatic cancer. Meanwhile, at the transcriptome level, we revealed for the first time the association between OCIAD2 and JAK-STAT1 as well as the cell cycle pathway. And the sensitivity of patients to various drugs under different OCIAD2 expression levels was evaluated. Based on these results, we believe that OCIAD2 is a potential prognostic and therapeutic marker for PC patients. Ovarian cancer immunoreactive antigen domain containing 2 (OCIAD2), with sequence similarity to OCIAD1, was first identified as a novel gene by the National Institutes of health mammalian gene collection program in 2002 [42]. OCIAD2 is located on chromosome 4p11 in humans, with 7 exons and composed of 154 amino acids [43].
OCIAD2 has been reported to be implicated in liver cancer, lung adenocarcinoma, and ovarian mucinous tumors. Hypermethylation of OCIAD2 in liver cancer tissues was associated with poor prognosis in patients [44–46]. In addition, Wu et al. showed that the hypermethylation of OCIAD2 in liver cancer resulted in the decrease of OCIAD2 mRNA and protein levels, which promoted the migration and invasion of cancer cells, the enhancement of MMP9 expression, and the activation of AKT and FAK [46]. Chigusa et al. demonstrated that similar to OCIAD1, OCIAD2 was a cancer-associated protein whose expression increased during the progression of ovarian mucinous tumors and was a useful marker for evaluating malignancy [47].
Overexpression of OCIAD2 was observed in lung adenocarcinoma, which was potentially caused by demethylation of the CpG site in the OCIAD2 promoter region. Furthermore, low CpG methylation of OCIAD2 was associated with adverse outcomes in patients [48]. Hong et al. reported that the expression of OCIAD2 in invasive lung adenocarcinoma was significantly higher than in in situ lung adenocarcinoma and was associated with poor prognosis of patients. Inhibition of OCIAD2 downregulated cell growth, proliferation, migration, and invasion, loss of mitochondrial structure, and reduction of mitochondrial number [49]. However, two studies on lung adenocarcinoma showed an inverse relationship between abnormal expression of OCIAD2 and patient prognosis and clinicopathological features. One of them found that high OCIAD2 protein expression was significantly correlated with vascular invasion, lymphatic infiltration, and pathological stages [50]. In another study, although OCIAD2 was highly expressed in lung adenocarcinoma, patients with high expression exhibited better prognosis. OCIAD2 expression was inversely associated with lymphatic invasion, vascular invasion, and lymph node metastasis [51]. These results indicate that the function of OCIAD2 in various tumors is complex, and its role varies among different tumors, requiring further research and exploration. In this study, we found that the expression level of OCIAD2 was strongly correlated with chronic pancreatitis, primary therapy outcome, and pathological type in PC patients. In addition, we found that OCIAD2 itself was rarely mutated, but PC patients with high OCIAD2 expression had more mutations in KRAS, TP53, and CDKN2A than those with low OCIAD2 expression (S2 Fig).
At the time we wrote the manuscript of this study, we found that Yi-Fan et al. had partially worked on OCIAD2 in PC [52]. Although they also found that OCIAD2 was highly expressed in PC and correlated with prognosis, they did not conduct a comprehensive evaluation of the prognostic value of OCIAD2 in multiple datasets. In addition, they found that OCIAD2 may play a role in PC cell proliferation, migration, and apoptosis through the PI3K/Akt signaling pathway. In this study, however, we found that JAK-STAT and the cell cycle pathway may play a more important role. In particular, we found that the JAK-STAT pathway is more strongly inhibited after OCIAD2 knockdown than PI3K/Akt. In summary, these results suggest that OCIAD2 plays a critical pathological function in PC and is a novel biomarker for the prognosis of PC patients.
However, our current study has several limitations. Although we demonstrated that OCIAD2 plays an oncogenic role in PC and targeted knockdown of OCIAD2 can inhibit the activity of JAK-STAT and the cell cycle, it has not been validated in vivo. In addition, although this study has confirmed the prognostic value of the mRNA level of OCIAD2 for PC patients, the prognostic value of OCIAD2 protein expression in PC patients has not been investigated. These remain to be further studied in our future.
In conclusion, we have now demonstrated that OCIAD2 is a useful prognostic biomarker for PC patients and plays a key pathological function in PC, and knockdown of OCIAD2 significantly inhibits JAK-STAT and the cell cycle pathway activity. It represents a potential candidate for drug development in PC patients.
Supporting information
S1 TextTable A.Information of 7 GEO datasets for differential expression gene analysis. Table B. Significantly up-regulated and down-regulated DEGs in each GEO dataset.(DOCX)
S2 TextThe mRNA expression levels of DCBLD2, OCIAD2, and SAMD9 in various tissues by single-cell sequencing.(DOCX)
S1 DataDifferentially expressed genes analysis and intersection results of 7 geo datasets.(XLSX)
S1 FigConfusion matrices of prognostic models 1, 3, and 5 years.(TIF)
S2 DataCorrelation analysis results between OCIAD2 expression and IC50 of different compounds in PC patients.(XLSX)
S2 Fig(A) The mutation rate of OCIAD2 in patients with pancreatic cancer.(B-C) Mutation profiles of PC patients with different OCIAD2 expression levels.(TIF)
S3 DataTable A.Transcriptome sequencing results of knocking down OCIAD2 expression in BxPC-3 cells. Table B. Analysis of differentially expressed genes after knocking down OCIAD2 expression (DESeq2). Table C. Analysis of differentially expressed genes after knocking down OCIAD2 expression (limma).(XLSX)
The reference list from the paper itself. Each links out to its DOI / PubMed record.
- 1Siegel RL, Miller KD, Wagle NS, Jemal A. Cancer statistics, 2023. CA Cancer J Clin. 2023;73(1):17–48.36633525 10.3322/caac.21763 · doi ↗ · pubmed ↗
- 2Khalaf N, El-Serag HB, Abrams HR, Thrift AP. Burden of Pancreatic Cancer: From Epidemiology to Practice. Clin Gastroenterol Hepatol. 2021;19(5):876–84. doi: 10.1016/j.cgh.2020.02.054 32147593 PMC 8559554 · doi ↗ · pubmed ↗
- 3Halbrook CJ, Lyssiotis CA, Pasca di Magliano M, Maitra A. Pancreatic cancer: Advances and challenges. Cell. 2023;186(8):1729–54. doi: 10.1016/j.cell.2023.02.014 37059070 PMC 10182830 · doi ↗ · pubmed ↗
- 4De Dosso S, Siebenhüner AR, Winder T, Meisel A, Fritsch R, Astaras C, et al. Treatment landscape of metastatic pancreatic cancer. Cancer Treat Rev. 2021;96:102180. doi: 10.1016/j.ctrv.2021.102180 33812339 · doi ↗ · pubmed ↗
- 5Li H-Y, Qi W-L, Wang Y-X, Meng L-H. Covalent inhibitor targets K Ras G 12C: A new paradigm for drugging the undruggable and challenges ahead. Genes Dis. 2021;10(2):403–14. doi: 10.1016/j.gendis.2021.08.011 37223497 PMC 10201555 · doi ↗ · pubmed ↗
- 6Kindler HL, Hammel P, Reni M, Van Cutsem E, Macarulla T, Hall MJ, et al. Overall Survival Results From the POLO Trial: A Phase III Study of Active Maintenance Olaparib Versus Placebo for Germline BRCA-Mutated Metastatic Pancreatic Cancer. J Clin Oncol. 2022;40(34):3929–39. doi: 10.1200/JCO.21.01604 35834777 PMC 10476841 · doi ↗ · pubmed ↗
- 7Golan T, Hammel P, Reni M, Van Cutsem E, Macarulla T, Hall MJ, et al. Maintenance Olaparib for Germline BRCA-Mutated Metastatic Pancreatic Cancer. N Engl J Med. 2019;381(4):317–27. doi: 10.1056/NEJ Moa 1903387 31157963 PMC 6810605 · doi ↗ · pubmed ↗
- 8Assenat E, Mineur L, Mollevi C, Lopez-Crapez E, Lombard-Bohas C, Samalin E, et al. Phase II study evaluating the association of gemcitabine, trastuzumab and erlotinib as first-line treatment in patients with metastatic pancreatic adenocarcinoma (GATE 1). Int J Cancer. 2021;148(3):682–91. doi: 10.1002/ijc.33225 33405269 · doi ↗ · pubmed ↗