Correction: Src inhibition attenuates neuroinflammation and protects dopaminergic neurons in Parkinson's disease models
Hanyu Yang, Lu Wang, Caixia Zang, Yue Wang, Junmei Shang, Zihong Zhang, Hui Liu, Xiuqi Bao, Xiaoliang Wang, Dan Zhang

Abstract
Genes, proteins, chemicals, diseases, species, mutations and cell lines named across the full text — each resolved to its canonical identifier and authoritative record.
Click any figure to enlarge with its caption.
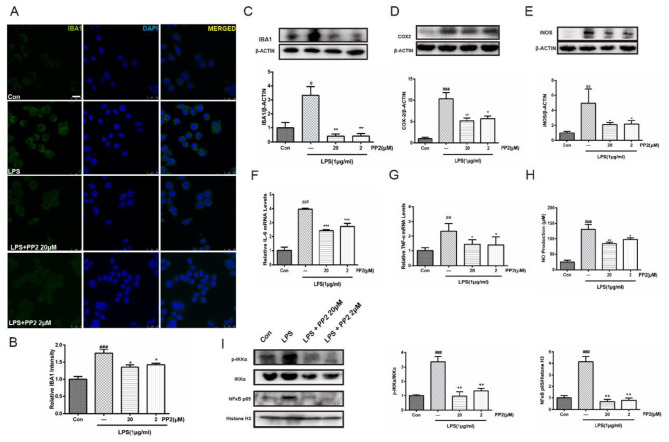 Figure 1
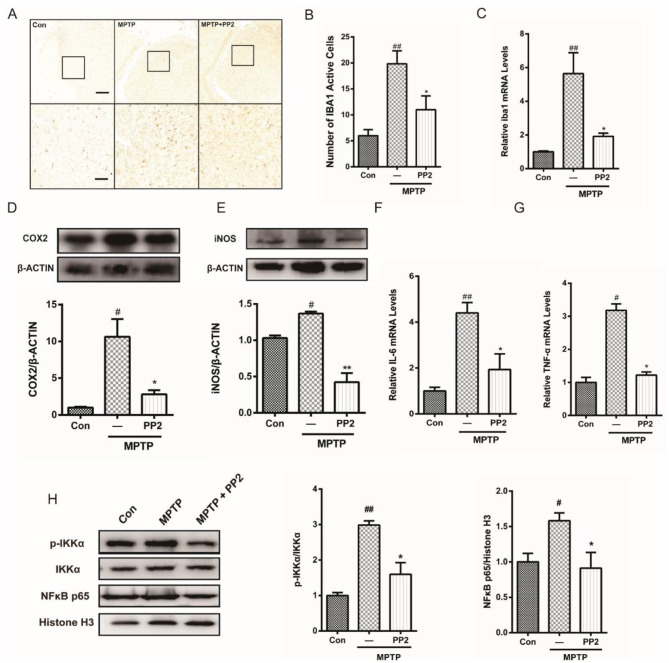 Figure 2
Peer Reviews
No public reviews on file for this paper yet. If you reviewed it on a platform where reviews are public (OpenReview, ICLR, NeurIPS, ICML), you can paste yours below so the community can read it here.
Videos
No videos yet. Explain this paper in a talk, walkthrough, or lecture? Add one.
Taxonomy
TopicsNuclear Receptors and Signaling
In the published article, there were errors in Figure 2A and Figure 5A as published. During assembly of Figure 2A by Adobe Illustrator, a technical error occurred where the DAPI channel in the LPS + PP2-20μM group was partially overlapped by the LPS + PP2-2μM image. However, MERGED panels were not affected. We have provided a corrected version with the proper DAPI alignment.
Due to a mistake during the scanning process of brain slices by the CRO company, one image in Figure 5 from the Model group was inadvertently mislabeled as Control, which caused a mistake in Figure 5A when composing the layouts of the figures. We have re-verified all raw data and replaced the incorrect image with the accurate Control image.
The corrected Figure 2, Figure 5 and their captions appear below.
In the published article, there were errors in the legends for Figures 4B–D, Figures 5B–E, and 6B, C as published. In these legends, “MPTP group” was mistakenly written as “LPS group”. The corrected legends appear below.
Figure 4. The efficiency of Src inhibitor PP2 was confirmed in 1-methyl-4-phenyl-1,2,3,6-tetrahydropyridine (MPTP)-treated mice. (A) The experimental arrangement. (B–D) The protein level of p-Src and Src in SNpc of MPTP-treated mice was analyzed by western blot with anti-p-Src and anti-Src antibodies. Data are expressed as means ± SEM. n = 4. ^#^P < 0.05 vs. control group, ^^P < 0.001 vs. MPTP group. (E) The brown stain represented p-Src-immunoreactive cells in SNpc (scale bar: top, 600 μm; bottom, 25 μm). (F) The number of p-Src-positive cells per 100 cells in SNpc was counted and provided in a histogram. Data are expressed as means ± SEM. n = 4. ^#^P < 0.05 and ^##^P < 0.01 vs. control group, ^^P < 0.01 and ^**^P < 0.001 vs. MPTP group.
Figure 5. Src inhibition reduced activation of microglial cells and neuroinflammation in 1-methyl-4-phenyl-1,2,3,6-tetrahydropyridine (MPTP)-treated mice. (A) The activation of microglia in SNpc showed by IBA1 immunostaining (scale bar: top, 200 μm; bottom, 50 μm). (B) The number of IBA1-positive cells per 100 cells was counted and provided in a histogram. Data are expressed as means ± SEM. n = 4. ^##^P < 0.01 vs. control group, ^^P < 0.05 vs. MPTP group. (C) The mRNA expression level of IBA1 in SNpc was determined by quantitative reverse transcription (qRT)-PCR. Data are expressed as means ± SEM. n = 4. ^##^P < 0.01 vs. control group, ^^P < 0.05 vs. MPTP group. (D, E) The protein expression level of cyclooxygenase-2 (COX2) and iNOS were determined by western blot with anti-COX2 and anti-iNOS antibodies. Data are expressed as means ± SEM. n = 4. ^#^P < 0.05 vs. control group, ^^P < 0.05 and ^**^P < 0.01 vs. MPTP group. (F, G) The mRNA expression level of IL-6 and TNF-α was determined by qRT-PCR. Each bar represents the mean ± SEM. n = 4. ^#^P < 0.05 and ^##^P < 0.01 vs. control group, ^^P < 0.05 vs. MPTP group. (H) The protein expression level of p-IKKα, IKKα, NF-κB p65, and histone H3 were measured by western blot. Each bar represents the mean ± SEM. n = 4. ^#^P < 0.05 and ^##^P < 0.01 vs. control group, ^*^P < 0.05 vs. MPTP group.
Figure 6. Src inhibition enhanced the survival of dopaminergic neurons of the 1-methyl-4-phenyl-1,2,3,6-tetrahydropyridine (MPTP)-treated mice. (A) Representative images showed tyrosine hydroxylase (TH)-immunoreactive neurons in the SNpc (scale bar: top, 500 μm; bottom, 250 μm). (B) The number of TH-positive neurons per slide in SNpc was counted for each section and provided in a histogram. Data are expressed as means ± SEM. n = 4. ^#^P < 0.05 vs. control group, ^^P < 0.05 vs. MPTP group. (C) The protein expression level of TH in SNpc of MPTP-treated mice was analyzed by western blot. Data are expressed as means ± SEM. n = 4. ^#^P < 0.05 vs. control group, ^^P < 0.05 vs. MPTP group. (D) The mRNA expression level of TH in SNpc of MPTP-treated mice was determined by quantitative reverse transcription (qRT)-PCR. Data are expressed as means ± SEM. n = 4. ^###^P < 0.001 vs. control group, ^*^P < 0.05 vs. MPTP group.
The original version of this article has been updated.