Single-nucleus RNA sequencing: immature excitatory neurons and transformed glia build human BRAFV600E-negative gangliogliomas
Silvia Cases-Cunillera, Philipp Müller, Ashley J van Waardenberg, Susanne Schoch, Gilles Huberfeld, Anke Höllig, Daniel Delev, Motaz Hamed, Albert J Becker, Karen M J van Loo

TL;DR
This study explores BRAFV600E-negative gangliogliomas, revealing immature excitatory neurons and transformed glia that may contribute to epilepsy.
Contribution
The study identifies unique molecular and cellular profiles in BRAFV600E-negative gangliogliomas using single-nucleus RNA sequencing.
Findings
BRAFV600E-negative gangliogliomas show immature excitatory neurons with enhanced glutamatergic signaling.
Metabolically active astrocytes and oligodendrocytes are present in these tumors, potentially contributing to epileptogenicity.
Abstract
Gangliogliomas are glioneuronal neoplasms, generally with a benign evolution, accounting for the most common tumours in patients with long-term pharmacoresistant epilepsy. BRAFV600E has been detected in a high percentage of World Health Organization grade 1 gangliogliomas. However, biopsy collections from epilepsy patients include tumours that meet neuropathological ganglioglioma criteria but lack the BRAFV600E mutation. The molecular pathology of such BRAFV600E-negative gangliogliomas remains largely unexplored. We here focused on decoding the molecular and cellular profiles of these BRAFV600E-negative gangliogliomas at the single-cell resolution. Our results identify an exclusive profile in excitatory, but not inhibitory, neurons, astrocytes and oligodendrocytes in BRAFV600E-negative gangliogliomas. Moreover, we confirm the presence of immature excitatory neurons with higher…
Genes, proteins, chemicals, diseases, species, mutations and cell lines named across the full text — each resolved to its canonical identifier and authoritative record.
Click any figure to enlarge with its caption.
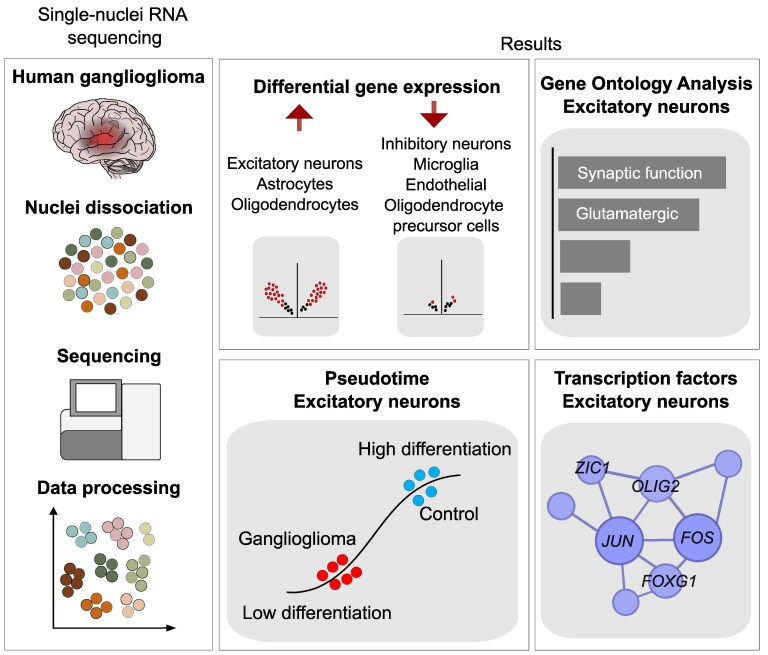 Figure 1
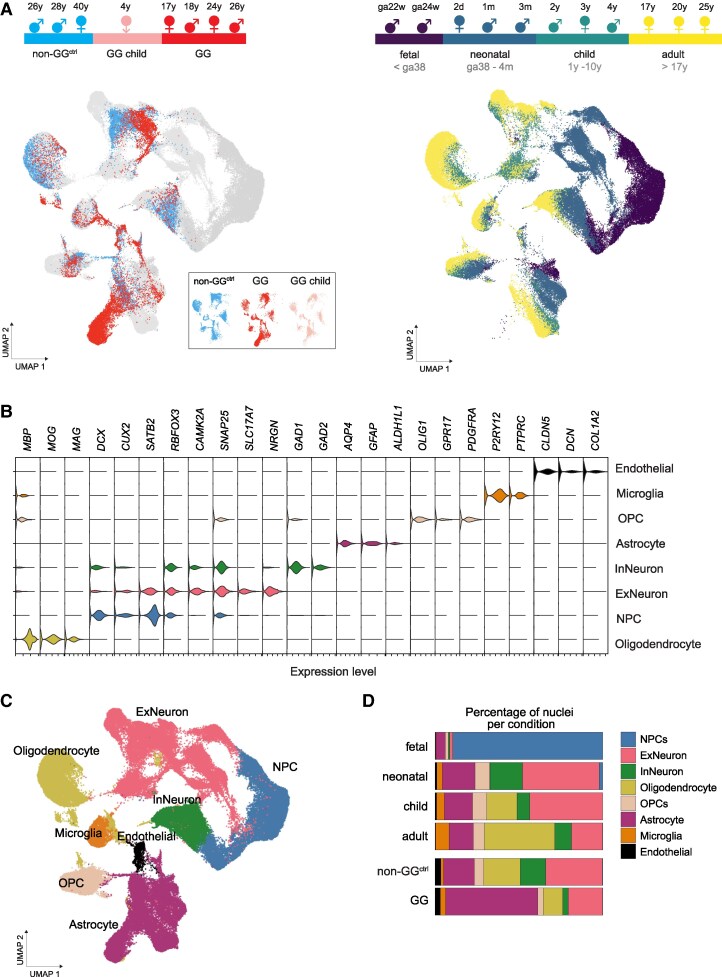 Figure 2
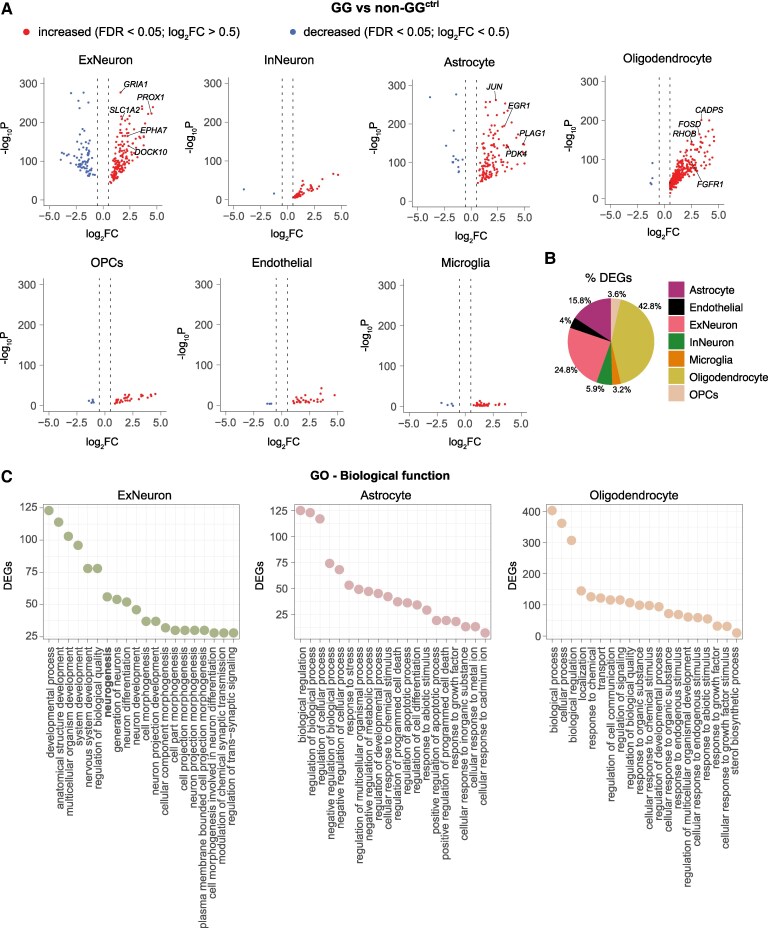 Figure 3
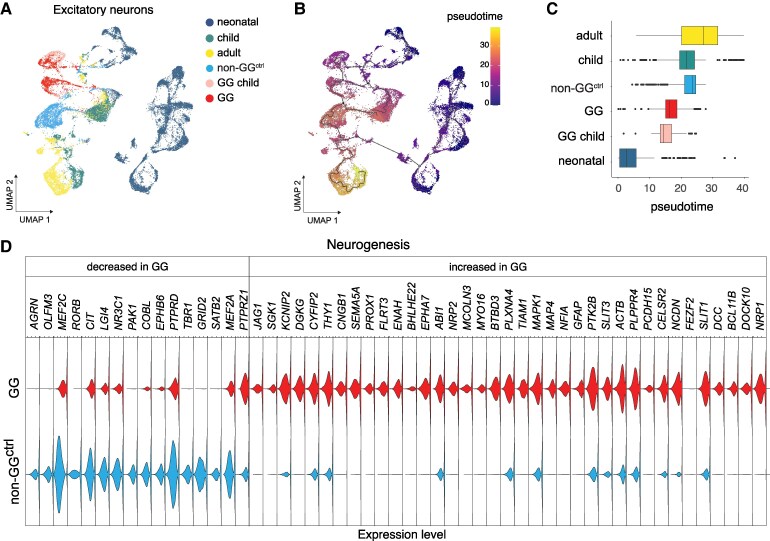 Figure 4
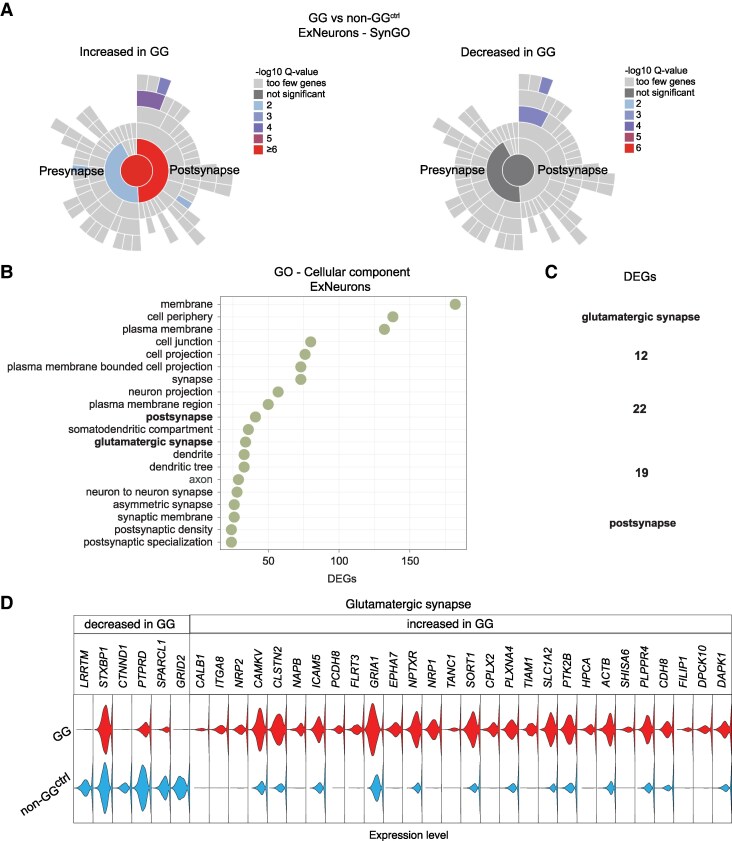 Figure 5
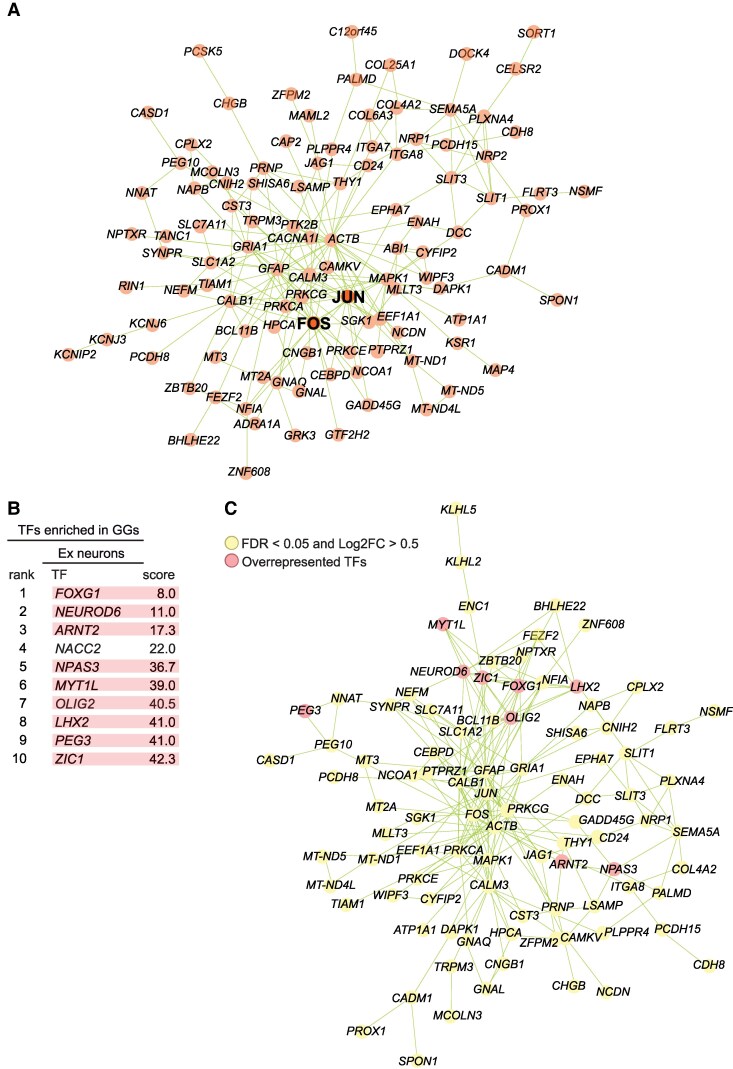 Figure 6
- —Deutsche Forschungsgemeinschaft10.13039/501100001659
- —Research Infrastructure West German Genome Center
- —Next Generation Sequencing Competence Network
- —West German Genome Center Bonn
- —Next Generation Sequencing Core Facility of the Medical Faculty at the University of Bonn
Peer Reviews
No public reviews on file for this paper yet. If you reviewed it on a platform where reviews are public (OpenReview, ICLR, NeurIPS, ICML), you can paste yours below so the community can read it here.
Videos
No videos yet. Explain this paper in a talk, walkthrough, or lecture? Add one.
Taxonomy
TopicsSingle-cell and spatial transcriptomics · Glioma Diagnosis and Treatment · Ferroelectric and Negative Capacitance Devices
Introduction
Gangliogliomas (GGs) are glioneuronal neoplasms composed of dysmorphic neurons and neoplastic glial cells, accounting for the most common tumour associated with long-term pharmacoresistant epilepsy.^1^ The course and nature of GGs are generally benign and surgical resection allows seizure control in a large fraction of patients.^2-4^ However, epileptic seizures are a factor of concern since they can remain after surgery.^5^ Therefore, finding new treatments to tackle this symptomatology in patients with GGs is critical.
BRAF^V600E^ mutation has been reported in a considerable fraction of WHO grade 1 GGs ranging from 13% to 58% depending on the study.^6-10^ Regardless of the discrepancy in the percentage of GGs harbouring the mutation, all studies identified BRAF^V600E^-positive GGs within their cohorts. This has resulted in research focusing on understanding molecular mechanisms associated with this mutation in both human and mouse GGs^7,11-14^ and led to BRAF^V600E^-negative tumours that clearly fulfil histological and immunohistochemical criteria of GG being less investigated.^15^ Even though BRAF^V600E^ has been associated with neuronal hyperexcitability^13,16^ previous reports have claimed no significant differences in epilepsy duration^17^ or age at seizure onset^6,18^ between patients with GG with or without BRAF^V600E^ mutation.
In this study, we aim to unravel molecular features of human tumours fulfilling histological and immunohistochemical criteria of GGs but BRAF^V600E^ negative status, further referred to as GGs, from patients with a clinical story of epilepsy at a single-cell resolution.
Materials and methods
Human samples
GG (WHO grade 1) samples negative for BRAF^V600E^ were obtained from patients who underwent surgery at the Department of Neurosurgery of the University of Bonn. Control samples were collected at the Department of Neurosurgery of the RWTH Aachen University Hospital. The clinical courses of the patients are summarized in Supplementary Tables 1 and 2. All procedures were conducted in accordance with the Declaration of Helsinki. Informed written consent was obtained from every patient according to the approvals of the local ethics committee (University of Bonn: Nr. 229/18, 371/20, 504/20; RWTH Aachen University Hospital: EK067/20). Relevant clinical information was extracted from the corresponding medical reports.
Histology
Brain specimens were fixed in paraformaldehyde and embedded in paraffin. The resulting paraffin-embedded blocks were sectioned at a thickness of 4 µm. The paraffin was removed by sequential treatment with ethanol solutions of decreasing concentrations (1 min each). Following deparaffinization, the brain sections were washed with distilled water and immersed in haematoxylin for 5 min. After an additional wash with crane water, the sections were treated with eosin for 2 min. To remove excess eosin, the sections were washed with 100% ethanol for 30 s, followed by two washes with isopropanol (2 min each) and xylene (1 min each). After air-drying for 5 min, a coverslip was mounted on the haematoxylin and eosin (H&E)-stained brain sections using Cytoseal. BRAF^V600E^ status was validated by immunochemistry using the anti-BRAF-V600E (VE1) Mouse Monoclonal Primary Antibody (VENTANA) (Supplementary Fig. 2B).
Tissue dissociation to single nucleus
A single nuclei suspension was prepared from frozen human brain samples stored at −80°C. The samples were sectioned into small fragments and resuspended in ice-cold lysis buffer (Miltenyi Biotec). The resulting suspension was transferred to a gentleMACS C tube (Miltenyi Biotec) and processed using the gentleMACS Dissociator (Miltenyi Biotec) to achieve tissue dissociation into nuclei. Subsequently, the nuclei suspension was filtered through 70 µm and 30 µm MACS SmartStrainers (Miltenyi Biotec). The filtered solution was centrifuged, the supernatant was removed and the pellet was then resuspended in an ice-cold resuspension buffer by gentle pipetting. The nuclei suspension was centrifuged, and the resulting pellet was resuspended in phosphate-buffered saline (PBS). Debris Removal Solution was added, followed by the careful addition of PBS. After centrifugation at full acceleration, three distinct phases formed; the two upper phases, containing the debris, were aspirated and discarded. The remaining solution was centrifuged, and the pellet was resuspended in an appropriate volume of buffer (PBS containing 2% bovine serum albumin, BSA). The nuclei were treated with DAPI at a final concentration of 0.1 µg/mL. All solutions were supplemented with an RNase inhibitor at a final concentration of 0.5%. The nuclei suspension was maintained in ice for all the steps. Nuclei concentration was determined using a Countess automated cell counter.
Single-nucleus RNA sequencing
Single-nucleus RNA sequencing (snRNA-seq) was performed using the 10 × Genomics Chromium NextGEM Single Cell 3′ Reagent Kits v3.1, following the manufacturer’s instructions. Nuclei were loaded onto the GEM Chip at a concentration of 500–1500 nuclei/µL, targeting 16 500 nuclei per sample. Libraries were sequenced on a NovaSeq 6000 platform with read settings of 28/10/10/90, achieving an average sequencing depth of ∼25 000 reads per nucleus.
Single-nucleus RNA sequencing data pre-processing
snRNA-seq data from samples from temporal lobe epilepsy (TLE; referred to as non-GG^ctrl^) and GGs was mapped against the ‘GRCh38-3.0.0’ human reference transcriptome (downloaded from 10xgenomics: https://cf.10xgenomics.com/supp/cell-exp/refdata-cellranger-GRCh38-3.0.0.tar.gz) with Cell Ranger version 6.1.2.^19^ Fastq sequencing data corresponding to each sample were input into the CellRanger ‘count’ subcommand, with parameters –expect set to 10 000 and run two times, firstly with ‘-include-introns’ and secondly without ‘-include-introns’. The snRNA-seq data from^20^ were retrieved from the Gene Expression Omnibus (GEO:GSE168408). All datasets were integrated and analysed using the Seurat package (v4.0). Filtered feature-barcode matrices were loaded into R using the Read10X_h5 function. Each dataset was converted into a Seurat object using CreateSeuratObject function with a minimum feature threshold of 100 genes per nucleus.
Quality control was performed by filtering nuclei based on the following criteria: exclusion of (1) nuclei with fewer than 250 genes or 500 UMIs, (2) nuclei with a mitochondrial gene ratio greater than 20% and (3) nuclei with less than 0.8 log_10_GenesPerUMI ratio. Filtered datasets were merged using Merge function to create a combined dataset containing foetal, neonatal, childhood, and adult developmental samples alongside non-GG^ctrl^ and GG samples. The full names of gene symbols which are displayed in Figures and Supplementary figures are listed in Supplementary Table 4.
Dimensionality reduction and cell type annotation
To correct batch effects, each dataset underwent normalization using the NormalizeData function with default settings, ensuring consistency across samples. To identify the most informative genes, the top 2000 variable features were selected using FindVariableFeatures function. The datasets were integrated using IntegrateData, incorporating the first ten principal components to create a harmonized dataset suitable for downstream analyses. After integration, standard Seurat workflows were applied to reduce dimensionality and identify distinct cell populations. The integrated dataset was first scaled using ScaleData function and subjected to RunPCA function to capture major sources of variation. To visualize the data in a lower-dimensional space, RunUMAP function was performed using the first ten principal components. Clustering was then conducted using a graph-based approach, where nearest-neighbour graphs were computed with FindNeighbors function, followed by clustering at a resolution of 0.5 using FindClusters function. Cell type annotation was performed based on marker gene expression profiles, leveraging FeaturePlot and VlnPlot functions to examine established markers.
Trajectory analysis
To analyse developmental trajectories, the Seurat object was converted into a Monocle3 cell dataset, preserving metadata, gene features, and clustering information. UMAP coordinates were transferred to maintain spatial distribution, and all cells were assigned to a single partition. Trajectory inference was performed using Monocle3’s graph-learning algorithm, reconstructing differentiation pathways and identifying key transition points such as branch points and root cells. To assign the root in Monocle3, we utilized cells from the fetal group of the GEO:GSE168408 dataset, ensuring accurate pseudotime ordering. Cells were then ordered along the trajectory, with pseudotime values assigned to track excitatory neuron differentiation.
Copy number variation analysis
Analysis was performed with R package inferCNV (version 1.16.0). Raw gene expression counts were extracted from the Seurat object using the RNA assay. Genes with an average expression below 0.1 in the reference group were excluded (cut-off = 0.1). Annotations linking each cell to its cell type were provided as input to CreateInfercnvObject function, and gene position information was supplied via a custom file. The CNV inference was performed using infercnv::run function with denoising (denoise = TRUE), a six-state Hidden Markov Model.
Transcription factor enrichment analysis
Enrichment of transcription factors (TFs) was determined using the ChIP-X Enrichment Analysis Version 3 API (ChEA3).^21^ The ten most enriched transcription factors are displayed along with their mean rank. TFEA data were embedded in the STRING functional association network.^22^
Statistical analysis
Violin plots were generated to visualize gene expression distributions across cell populations identified in the single-cell RNA-seq dataset. Statistical comparisons underlying these plots were performed using Seurat’s FindAllMarkers function. Violin plots showing gene expression between different conditions were created using Seurat’s FindMarkers function. Both functions apply the Wilcoxon rank sum test, a non-parametric statistical method. Differentially expressed genes (DEGs) between GG and non-GG^ctrl^ samples were identified using the FindMarkers function with a log fold-change threshold of 0.5, a minimum percent difference of 0.2, and an adjusted P-value cut-off of 0.05. Gene Ontology (GO) and the SynGO enrichment analysis were performed fisher’s exact test for statistical significance and correcting for multiple testing using the False Discovery Rate (FDR) method.
Supplementary Material
fcaf372_Supplementary_Data
The reference list from the paper itself. Each links out to its DOI / PubMed record.
- 1Blumcke I, Spreafico R, Haaker G, et al Histopathological findings in brain tissue obtained during epilepsy surgery. N Engl J Med. 2017;377(17):1648–1656.29069555 10.1056/NEJ Moa 1703784 · doi ↗ · pubmed ↗
- 2Blümcke I, Wiestler OD. Gangliogliomas: An intriguing tumor entity associated with focal epilepsies. J Neuropathol Exp Neurol. 2002;61(7):575–584.12125736 10.1093/jnen/61.7.575 · doi ↗ · pubmed ↗
- 3Luyken C, Blümcke I, Fimmers R, Urbach H, Wiestler OD, Schramm J. Supratentorial gangliogliomas: Histopathologic grading and tumor recurrence in 184 patients with a median follow-up of 8 years. Cancer. 2004;101(1):146–155.15222000 10.1002/cncr.20332 · doi ↗ · pubmed ↗
- 4Compton JJ, Laack NNI, Eckel LJ, Schomas DA, Giannini C, Meyer FB. Long-term outcomes for low-grade intracranial ganglioglioma: 30-year experience from the Mayo clinic. J Neurosurg. 2012;117(5):825–830.22957524 10.3171/2012.7.JNS 111260 · doi ↗ · pubmed ↗
- 5Lamberink HJ, Otte WM, Blümcke I, et al Seizure outcome and use of antiepileptic drugs after epilepsy surgery according to histopathological diagnosis: A retrospective multicentre cohort study. Lancet Neurol. 2020;19(9):748–757.32822635 10.1016/S 1474-4422(20)30220-9 · doi ↗ · pubmed ↗
- 6Schindler G, Capper D, Meyer J, et al Analysis of BRAF V 600E mutation in 1,320 nervous system tumors reveals high mutation frequencies in pleomorphic xanthoastrocytoma, ganglioglioma and extra-cerebellar pilocytic astrocytoma. Acta Neuropathol. 2011;121(3):397–405.21274720 10.1007/s 00401-011-0802-6 · doi ↗ · pubmed ↗
- 7Koelsche C, Wöhrer A, Jeibmann A, et al Mutant BRAF V 600E protein in ganglioglioma is predominantly expressed by neuronal tumor cells. Acta Neuropathol. 2013;125(6):891–900.23435618 10.1007/s 00401-013-1100-2 · doi ↗ · pubmed ↗
- 8Durślewicz J, Klimaszewska-Wiśniewska A, Antosik P, et al Detection of BRAF V 600E mutation in ganglioglioma and pilocytic astrocytoma by immunohistochemistry and real-time PCR-based idylla test. Dis Markers. 2020;2020:1–10.10.1155/2020/8880548 PMC 744824332879641 · doi ↗ · pubmed ↗