A New Early Warning System for Predicting Adverse Outcomes in Hospitalized Patients With Neurological Conditions: A Retrospective Cohort Study
Carlos Arellano González, Luis Enrique Niembro Muñoz, Juan Jose Aguilar-Lugo-Gerez, Javier Sanchez Závala

TL;DR
This study develops a new early warning system for hospitalized neurological patients to better predict adverse outcomes like death or urgent transfers.
Contribution
The paper introduces NEURO-EWS, a novel early warning score specifically tailored for neurological and neurosurgical patients.
Findings
Standard EWS models showed lower predictive accuracy in neurological patients compared to general populations.
The new NEURO-EWS model achieved an AUC of 0.782, outperforming existing models in predicting adverse outcomes in neurological patients.
Abstract
Introduction Early Warning Scores (EWS) are widely used to identify acute clinical deterioration in hospitalized patients, particularly when integrated with rapid response teams (RRTs) as part of hospital safety systems. Although EWS have demonstrated benefits in reducing mortality and facilitating timely intensive care transfers, existing models have been primarily validated in general populations. Neurological and neurosurgical patients, despite being a significant subgroup of emergency admissions, are often underrepresented in these validation studies. Their unique clinical presentations - often subtle or atypical - pose additional challenges for early detection. This study aims to assess the predictive accuracy of various EWS for in-hospital mortality and urgent transfers among patients with neurological and neurosurgical diagnoses, and to develop a new, neurological-specific score…
Genes, proteins, chemicals, diseases, species, mutations and cell lines named across the full text — each resolved to its canonical identifier and authoritative record.
Click any figure to enlarge with its caption.
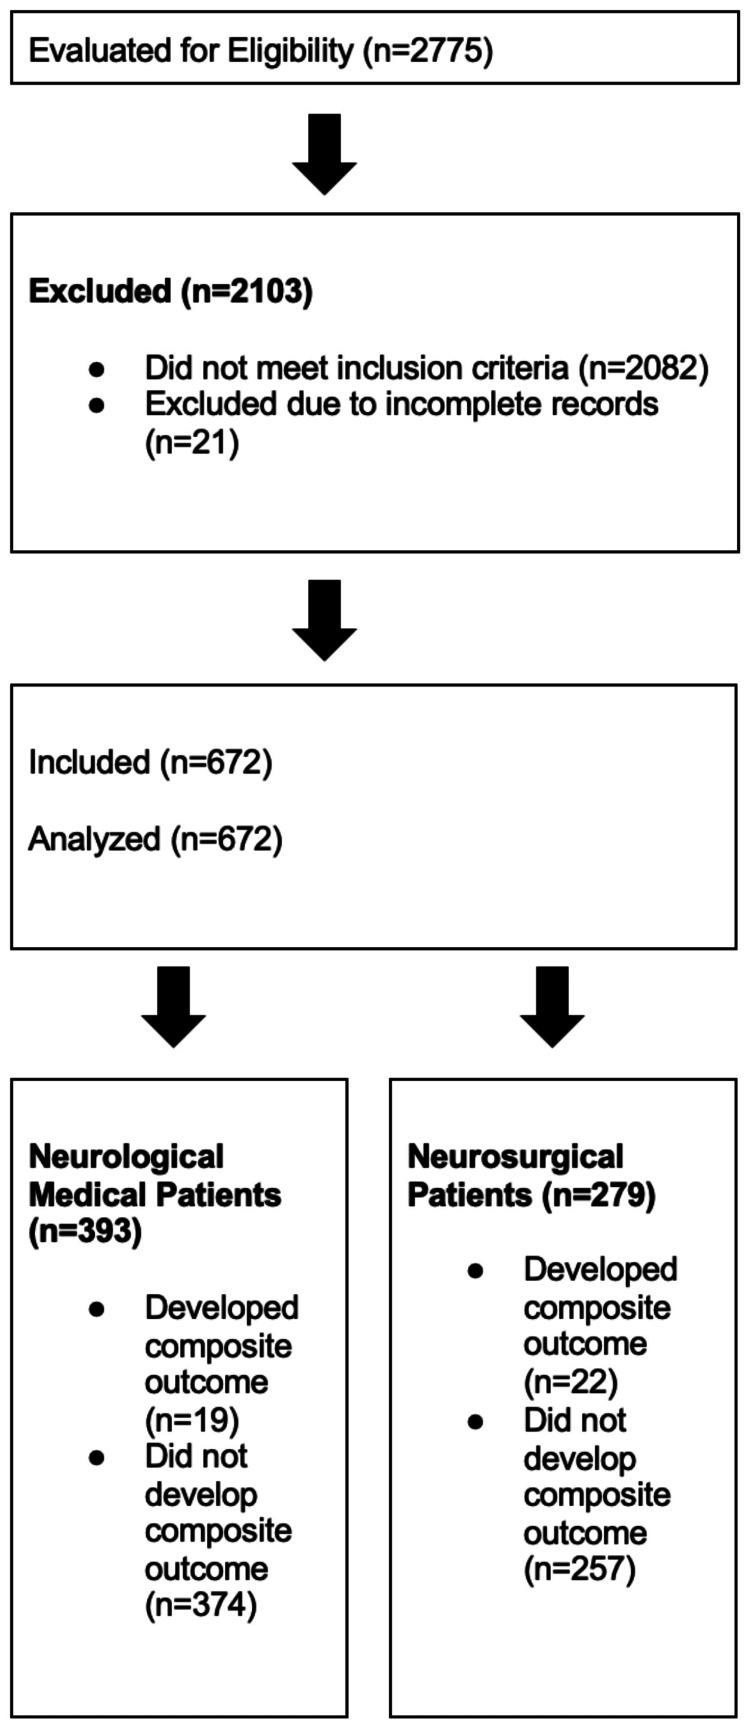 Figure 1
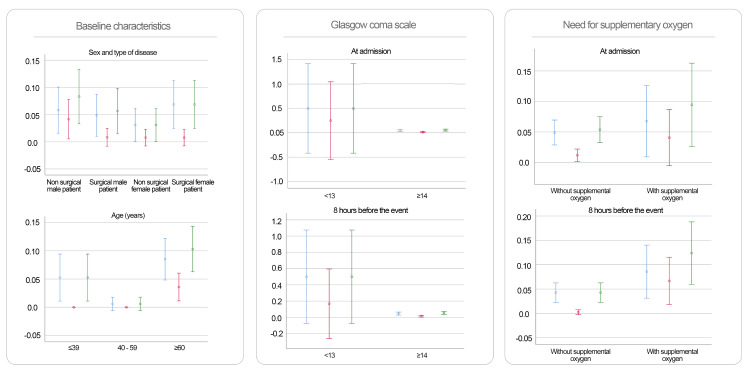 Figure 2
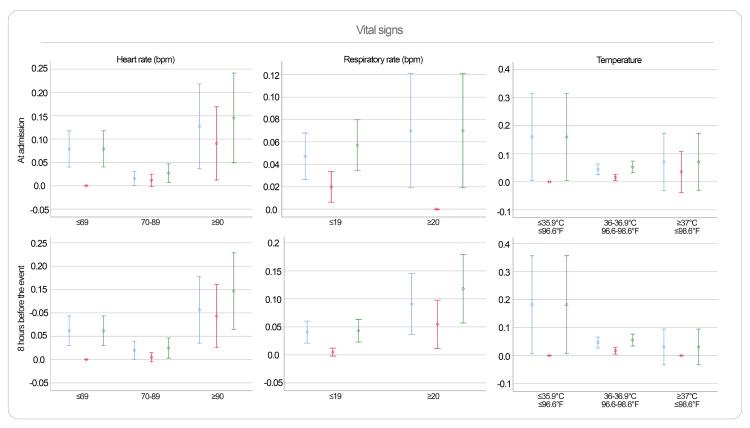 Figure 3
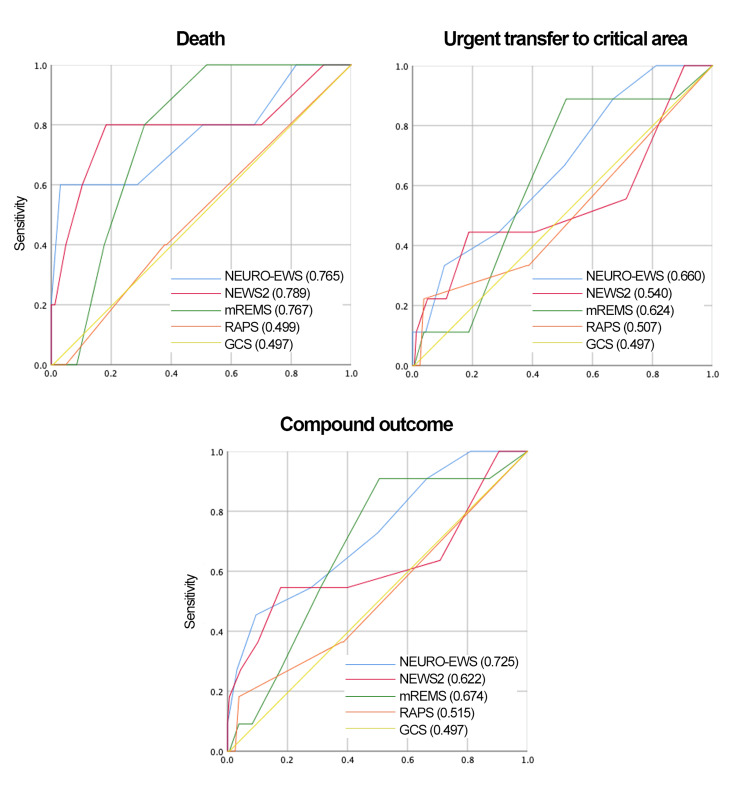 Figure 4
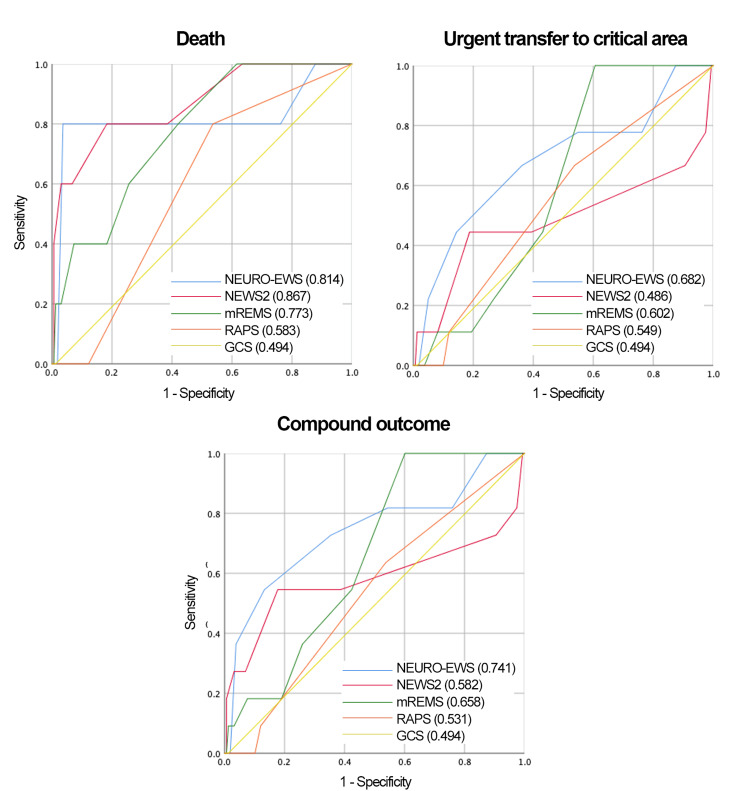 Figure 5
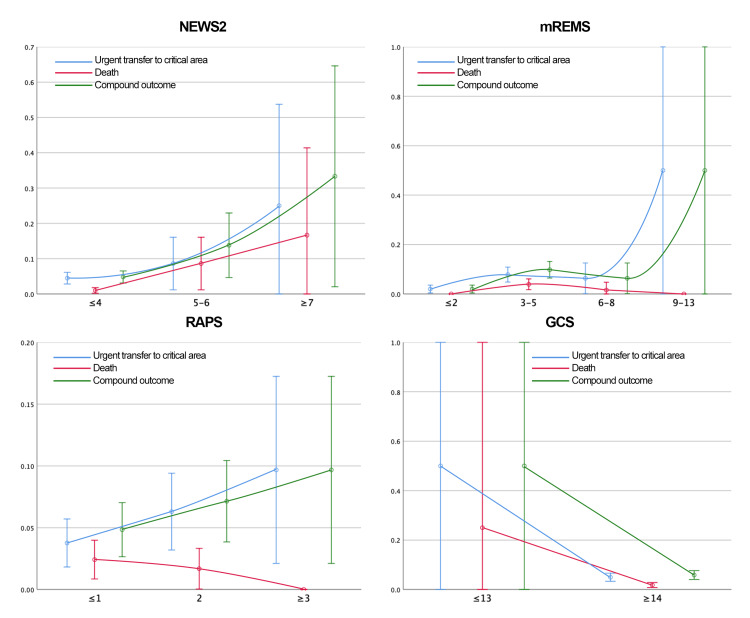 Figure 6
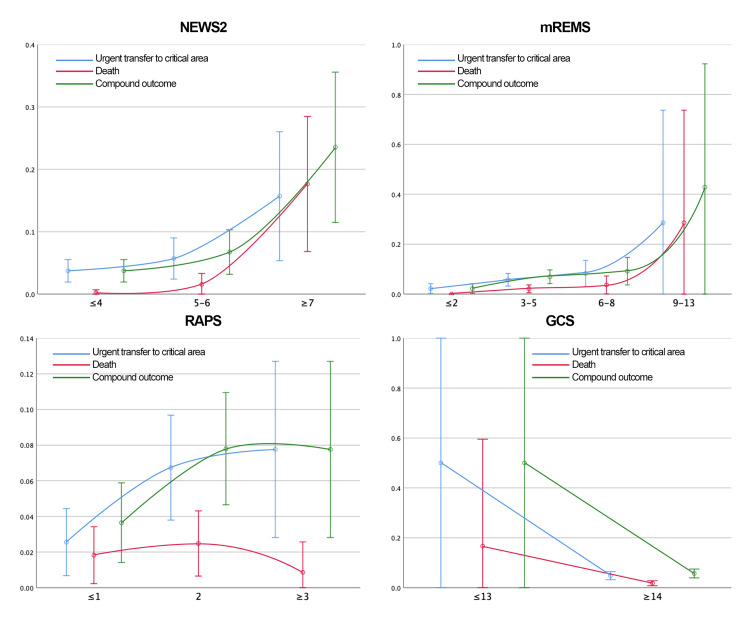 Figure 7
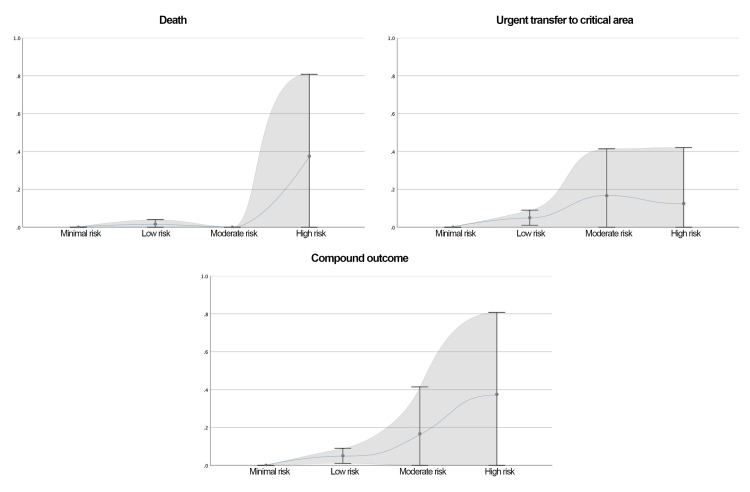 Figure 8
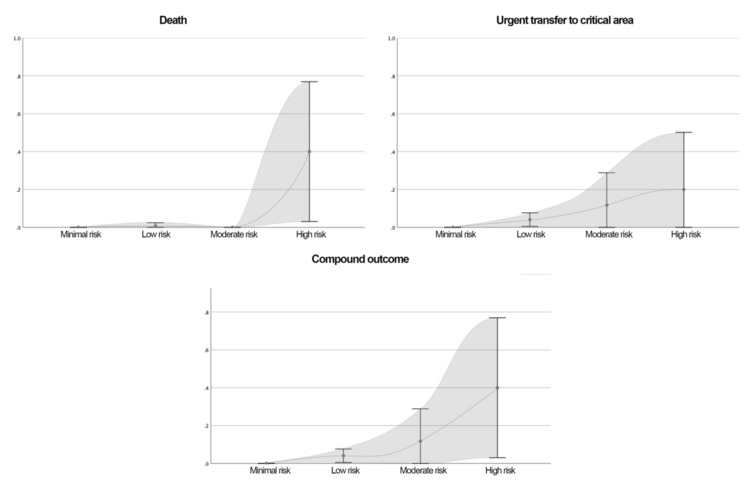 Figure 9
| Variable | Median (IQR) or n (%) |
| Age | 56 (42-69) |
| Sex (female) | 343 (51.2%) |
| Diagnosis (surgical) | 340 (50.6%) |
| BMI (kg/m²) | 24.9 (22.5-28.1) |
| In-hospital mortality | 13 (1.9%) |
| Urgent transfer to critical care | 35 (5.2%) |
| Composite outcome | 41 (6.1%) |
| SBP at admission (mmHg) | 118 (106-131) |
| SBP 8 hours before outcome (mmHg) | 104 (94-123) |
| DBP at admission (mmHg) | 72 (65-79) |
| DBP 8 hours before outcome (mmHg) | 65 (59-74) |
| HR at admission (bpm) | 74 (65-83) |
| HR 8 hours before outcome (bpm) | 72 (64-83) |
| RR at admission (rpm) | 18 (18-19) |
| RR 8 hours before outcome (rpm) | 18 (18-19) |
| Temperature at admission (°C) | 36.4 (36.2-36.6) |
| Temperature 8 hours before outcome (°C) | 36.4 (36.2-36.6) |
| Need for supplemental O2 at admission | 98 (14.6%) |
| Need for supplemental O2 8 hours before outcome | 138 (20.5%) |
| SpO2 at admission (%) | 94 (93-96) |
| SpO2 8 hours before outcome (%) | 92 (91-95) |
| GCS at admission | 15 (15-15) |
| GCS 8 hours before outcome | 15 (15-15) |
| NEWS-2 at admission | 2 (1-3) |
| NEWS-2 8 hours before outcome | 4 (3-5) |
| mREMS at admission | 3 (1-4) |
| mREMS 8 hours before outcome | 3 (2-5) |
| RAPS at admission | 0 (0-2) |
| RAPS 8 hours before outcome | 2 (0-2) |
| Diagnosis | n (%) |
| Cerebrovascular event | 117 (17.4) |
| Spinal surgery | 102 (15.2) |
| Metabolic encephalopathies | 76 (11.3) |
| Craniotomy | 67 (10.0) |
| Gamma Knife surgery for malignant disease | 64 (9.5) |
| Epilepsy | 51 (7.6) |
| Traumatic brain injury | 40 (6.0) |
| Headaches | 36 (5.4) |
| Neuropathies | 33 (4.9) |
| Demyelinating disease | 25 (3.7) |
| Gamma Knife surgery for benign disease | 25 (3.7) |
| Pituitary adenoma | 21 (3.1) |
| Dementias | 10 (1.5) |
| Movement disorders | 5 (0.7) |
| Early warning system | In-hospital mortality | Urgent transfer to a critical care unit | Composite outcome |
| Initial NEURO-EWS | 0.765 (0.502-1) | 0.66 (0.488-0.832) | 0.725 (0.566-0.884) |
| Initial NEWS2 | 0.789 (0.522-1) | 0.54 (0.309-0.771) | 0.622 (0.408-0.836) |
| Initial mREMS | 0.767 (0.655-0.879) | 0.624 (0.459-0.789) | 0.674 (0.527-0.821) |
| Initial RAPS | 0.499 (0.25-0.748) | 0.507 (0.291-0.723) | 0.515 (0.323-0.707) |
| Initial GCS | 0.497 (0.24-0.754) | 0.497 (0.303-0.691) | 0.497 (0.321-0.673) |
| 8h prior NEURO-EWS | 0.832 (0.569-1) | 0.723 (0.325-1) | 0.832 (0.569-1) |
| 8h prior NEWS2 | 0.853 (0.673-1) | 0.756 (0.497-1) | 0.853 (0.673-1) |
| 8h prior mREMS | 0.782 (0.611-0.953) | 0.696 (0.473-0.919) | 0.782 (0.611-0.953) |
| 8h prior RAPS | 0.579 (0.375-0.783) | 0.669 (0.506-0.832) | 0.579 (0.375-0.783) |
| 8h prior GCS | 0.494 (0.235-0.753) | 0.494 (0.163-0.825) | 0.494 (0.235-0.753) |
| Early warning system | In-hospital mortality | Urgent transfer to a critical care unit | Composite outcome |
| Initial NEURO-EWS | 0.787 (0.534-1) | 0.638 (0.299-0.977) | 0.787 (0.534-1) |
| Initial NEWS2 | 0.806 (0.547-1) | 0.685 (0.307-1) | 0.806 (0.547-1) |
| Initial mREMS | 0.773 (0.653-0.893) | 0.69 (0.561-0.819) | 0.773 (0.653-0.893) |
| Initial RAPS | 0.522 (0.261-0.783) | 0.488 (0.161-0.815) | 0.522 (0.261-0.783) |
| Initial GCS | 0.5 (0.237-0.763) | 0.5 (0.165-0.835) | 0.5 (0.237-0.763) |
| 8h prior NEURO-EWS | 0.832 (0.569-1) | 0.723 (0.325-1) | 0.832 (0.569-1) |
| 8h prior NEWS2 | 0.853 (0.673-1) | 0.756 (0.497-1) | 0.853 (0.673-1) |
| 8h prior mREMS | 0.782 (0.611-0.953) | 0.696 (0.473-0.919) | 0.782 (0.611-0.953) |
| 8h prior RAPS | 0.579 (0.375-0.783) | 0.669 (0.506-0.832) | 0.579 (0.375-0.783) |
| 8h prior GCS | 0.494 (0.235-0.753) | 0.494 (0.163-0.825) | 0.494 (0.235-0.753) |
| Early warning system | Urgent transfer to a critical care unit | Composite outcome |
| Initial NEURO-EWS | 0.657 (0.467-0.847) | 0.657 (0.467-0.847) |
| Initial NEWS2 | 0.448 (0.164-0.732) | 0.448 (0.164-0.732) |
| Initial mREMS | 0.582 (0.347-0.817) | 0.582 (0.347-0.817) |
| Initial RAPS | 0.51 (0.23-0.79) | 0.51 (0.23-0.79) |
| Initial GCS | 0.494 (0.255-0.733) | 0.494 (0.255-0.733) |
| 8h prior NEURO-EWS | 0.642 (0.417-0.867) | 0.642 (0.417-0.867) |
| 8h prior NEWS2 | 0.346 (0.021-0.671) | 0.346 (0.021-0.671) |
| 8h prior mREMS | 0.547 (0.41-0.684) | 0.547 (0.41-0.684) |
| 8h prior RAPS | 0.489 (0.246-0.732) | 0.489 (0.246-0.732) |
| 8h prior GCS | 0.494 (0.255-0.733) | 0.494 (0.255-0.733) |
| Outcome | NEWS-2, ≤4 | NEWS-2, 5-6 | NEWS-2, ≥7 | p-value |
| In-hospital mortality at hospital admission | 1% (0.2-1.8%) | 8.6% (1.3-15.9%) | 16.7% (0-38.7%) | 1.56 x 10⁻⁷ |
| Urgent transfer to a critical care unit at hospital admission | 4.5% (2.8-6.1%) | 8.6% (1.3-15.9%) | 25% (0-50.6%) | 0.010261 |
| Composite outcome at hospital admission | 4.8% (3.1-6.5%) | 13.8% (4.8-22.7%) | 33.3% (5.5-61.2%) | 0.000029 |
| In-hospital mortality 8h prior to outcome | 0.2% (0-0.7%) | 1.6% (0-3.3%) | 17.6% (7.1-28.2%) | 3.4917 x 10⁻⁸ |
| Urgent transfer to a critical care unit 8h prior to outcome | 3.7% (1.9-5.5%) | 5.7% (2.4-9%) | 15.7% (5.6-25.8%) | 0.005945 |
| Composite outcome 8h prior to outcome | 3.7% (1.9-5.5%) | 6.7% (3.2-10.3%) | 23.5% (11.8-35.3%) | 0.000035 |
| Outcome | mREMS, ≤2 | mREMS, 3-5 | mREMS, 6-8 | mREMS, ≥9 | p-value |
| In-hospital mortality at hospital admission | 0% (0-0%) | 3.9% (1.7-6.1%) | 1.6% (0-4.7%) | 0% (0-0%) | 0.006025 |
| Urgent transfer to a critical care unit at hospital admission | 2% (0.4-3.6%) | 7.8% (4.8-10.9%) | 6.3% (0.3-12.4%) | 50% (0-100%) | 0.001223 |
| Composite outcome at hospital admission | 6% (0-17.8%) | 9.8% (6.5-13.1%) | 6.3% (0.3-12.4%) | 50% (0-100%) | 0.000259 |
| In-hospital mortality 8h prior to outcome | 0% (0-0%) | 2.1% (0.6-3.7%) | 3.7% (0.1-7.2%) | 28.6% (0-64.7%) | 0.000729 |
| Urgent transfer to a critical care unit 8h prior to outcome | 2.2% (0.3-4.2%) | 5.7% (3.2-8.2%) | 8.3% (3.1-13.4%) | 28.6% (0-64.7%) | 0.002866 |
| Composite outcome 8h prior to outcome | 2.2% (0.3-4.2%) | 6.9% (4.2-9.7%) | 9.2% (3.7-14.6%) | 42.9% (3.3-82.5%) | 0.000438 |
| Outcome | RAPS, ≤1 | RAPS, 2 | RAPS, ≥3 | p-value |
| In-hospital mortality at hospital admission | 2.4% (0.9-4%) | 1.7% (0-3.3%) | 0% (0-0%) | 0.234621 |
| Urgent transfer to a critical care unit at hospital admission | 3.8% (1.8-5.7%) | 6.3% (3.2-9.4%) | 9.7% (2.3-17.1%) | 0.038077 |
| Composite outcome at hospital admission | 4.8% (2.7-7%) | 7.1% (3.9-10.4%) | 9.7% (2.3-17.1%) | 0.098199 |
| In-hospital mortality 8h prior to outcome | 1.8% (0.2-3.4%) | 2.5% (0.7-4.3%) | 0.9% (0-2.6%) | 0.797835 |
| Urgent transfer to a critical care unit 8h prior to outcome | 2.6% (0.7-4.4%) | 6.7% (3.8-9.7%) | 7.8% (2.9-12.6%) | 0.011505 |
| Composite outcome 8h prior to outcome | 3.6% (1.4-5.9%) | 7.8% (4.7-10.9%) | 7.8% (2.9-12.6%) | 0.043148 |
| Outcome | GCS, ≤13 | GCS, ≥14 | p-value |
| In-hospital mortality at hospital admission | 25% (0-74%) | 1.8% (0.8-2.8%) | 0.028341 |
| Urgent transfer to a critical care unit at hospital admission | 50% (0-100%) | 4.9% (3.3-6.6%) | 0.010577 |
| Composite outcome at hospital admission | 50% (0-100%) | 5.8% (4.1-7.6%) | 0.023386 |
| In-hospital mortality 8h prior to outcome | 16.7% (0-49.3%) | 1.8% (0.8-2.8%) | 0.126044 |
| Urgent transfer to a critical care unit 8h prior to outcome | 50% (6.2-93.8%) | 4.8% (3.2-6.4%) | 0.00312 |
| Composite outcome 8h prior to outcome | 50% (6.2-93.8%) | 5.7% (3.9-7.5%) | 0.009106 |
| Predictor | Patient clinical characteristics | |||||
| Assigned points | 2 | 1 | 0 | 1 | 2 | 3 |
| Type of patient | - | - | Women without surgical condition | All other patients | - | - |
| Age (years) | ≤39 | - | 40-59 | - | - | ≥60 |
| Heart rate (bpm) | - | ≤69 | 70-89 | - | ≥90 | - |
| Respiratory rate (rpm) | - | - | ≤19 | ≥20 | - | - |
| Temperature (°C) | - | ≤35.9 | ≥36.0 | - | - | - |
| Need for supplemental O2 | - | - | No | Yes | - | - |
| GCS | ≤13 | - | ≥14 | - | - | - |
| Outcome | Minimal risk (≤ 1 point) | Low risk (2-5 points) | Moderate risk (6 points) | High risk (≥ 7 points) | p-value | U-Mann Whitney |
| In-hospital mortality at hospital admission | 0% (0-0%) | 1.7% (0-4%) | 0% (0-0%) | 37.5% (1.6-73.4%) | 0.003663 | 158.5 |
| Urgent transfer to a critical care unit at hospital admission | 0% (0-0%) | 5% (1.1-9%) | 16.7% (0-38.7%) | 12.5% (0-37%) | 0.028323 | 468.5 |
| Composite outcome at hospital admission | 0% (0-0%) | 5% (1.1-9%) | 16.7% (0-38.7%) | 37.5% (1.6-73.4%) | 0.001061 | 456.5 |
| In-hospital mortality 8h prior to outcome | 0% (0-0%) | 0.8% (0-2.4%) | 0% (0-0%) | 40% (8-72%) | 0.000213 | 95.5 |
| Urgent transfer to a critical care unit 8h prior to outcome | 0% (0-0%) | 4.1% (0.6-7.6%) | 11.8% (0-27.6%) | 20% (0-46.1%) | 0.015096 | 446.5 |
| Composite outcome 8h prior to outcome | 0% (0-0%) | 4.1% (0.6-7.6%) | 11.8% (0-27.6%) | 40% (8-72%) | 0.000469 | 436.5 |
Peer Reviews
No public reviews on file for this paper yet. If you reviewed it on a platform where reviews are public (OpenReview, ICLR, NeurIPS, ICML), you can paste yours below so the community can read it here.
Videos
No videos yet. Explain this paper in a talk, walkthrough, or lecture? Add one.
Taxonomy
TopicsSepsis Diagnosis and Treatment · Machine Learning in Healthcare · Clinical Reasoning and Diagnostic Skills
Introduction
It is unacceptable for any hospital not to incorporate Early Warning Scores (EWS), alongside a rapid response team (RRT), within its quality assurance processes. Patients do not deteriorate suddenly; rather, we suddenly recognize their deterioration.
Neurological conditions rank as the third leading cause of admission to emergency services [1,2]. EWS were developed to identify patients experiencing acute clinical deterioration, enabling timely interventions to prevent adverse outcomes [3]. Numerous studies have highlighted the limited ability of healthcare centers to detect such deterioration in hospitalized patients, directly impacting prognosis. In response, the National Early Warning Score (NEWS) was introduced to standardize protocols for early identification of clinical deterioration and facilitate prompt therapeutic action [4].
EWS are designed based on theoretical models, physiological parameters, and pathophysiological mechanisms, and have been validated in general healthcare settings worldwide [5-9]. Typically, these scores incorporate vital signs (VS) and validated clinical scales, routinely used in hospitals - such as the Glasgow Coma Scale (GCS) - to detect acute health deterioration during hospitalization [1,9].
The implementation of EWS, in conjunction with RRTs, has rapidly improved early transfers to critical care units, reducing the need for invasive emergency procedures and lowering mortality rates [10]. Consequently, numerous EWS have been developed, many demonstrating significant predictive ability for cardiac arrest and mortality, thereby guiding critical care decisions [11]. Among the most widely validated and implemented are NEWS version 2 (NEWS2), the Rapid Acute Physiology Score (RAPS), and the modified Rapid Emergency Medicine Score (mREMS). NEWS2, originally developed for the English population, has been extensively validated internationally [5]; RAPS was developed and validated in the United States [6,7]; and mREMS originated in Thailand, with validations in multiple populations [12].
EWS have shown potential in predicting various adverse outcomes. However, most validation studies have involved general hospitalized populations, regardless of diagnosis or admission type, raising concerns about their applicability to specific groups [9,13-15]. To address this, recent studies have focused on specific populations [16-19]. NEWS2 was evaluated in patients with cardiovascular diseases in a retrospective cohort in London, reporting an area under the receiver operating characteristic curve (AUC) of 0.70 for predicting cardiac arrest. Additional variables that improved the score’s discriminative power were identified, such as age and heart rhythm, increasing the AUC above 0.90 [20].
Despite the proliferation of EWS and recent context-specific validations, data on their performance in neurological patients remain scarce and are mainly limited to cerebrovascular disease [16,18,19], traumatic brain injury [17], or emergency department settings [1]. The detection of clinical deterioration in neurological patients is particularly challenging due to negative symptomatology [2]. Although current results are modest, incorporating additional variables may improve predictive accuracy, and evaluating alternative EWS for neurological patients is warranted. To date, no EWS has been specifically developed for hospitalized neurological patients.
The primary objective of this study is to evaluate the predictive capacity of various EWS (NEWS2, mREMS, and RAPS) for mortality, critical care transfer, or a composite outcome in neurological and neurosurgical patients in the hospital setting. The composite outcome is defined as the sum of mortality and critical care transfer events, with the aim of analyzing them as a whole, since either event directly impacts patient prognosis during hospitalization. Considering these outcomes separately, while informative, falls short of the main purpose of an effective EWS. For instance, if an EWS is effective at detecting mortality, but no intervention is undertaken to prevent it, its utility is limited. Conversely, if an EWS accurately predicts critical care transfer, but mortality ultimately remains unchanged, its impact is also insufficient.
The secondary objective of this work is to analyze variables associated with in-hospital mortality or urgent critical care transfer, and to identify those with the greatest impact. Based on these findings, we plan to develop a novel predictive model, incorporating these variables, to enhance predictive accuracy for mortality, critical care transfer, or the previously defined composite outcome in neurological patients.
Finally, by achieving these two objectives, we aim to fulfill a third objective: to compare the predictive capacity of the new NEURO-EWS (Neurological Early Warning Score) model against the other EWS previously analyzed. Previous research supports the idea that adding relevant variables, such as other demographic or biochemical characteristics (e.g., interleukin levels or copeptin levels), can substantially improve the performance of existing EWS [21,22]. Therefore, this may lead to a greater impact on patient prognosis and a reduction in mortality.
To define our population, we selected the 14 most common neurological diagnoses worldwide for detailed analysis [23], aiming to identify the most suitable EWS for this patient group.
Materials and methods
Study design
We conducted a retrospective cohort study at a tertiary care center in Mexico City, spanning September 1, 2019, through December 31, 2022. The study protocol received approval from the Ethics and Research Committee of Hospital Médica Sur, Mexico City, Mexico (committee register: CONBIOÉTICA-09-CEI-018-20160729), with approval reference number 2024-EXT-810. We included all consecutive adult patients who met the eligibility criteria during the study period, yielding a complete cohort for analysis.
Study population
The required sample size was estimated at 597 patients, calculated using the formula \begin{document}n = \frac{Z^2 S^2}{d^2}\end{document} to achieve 80% statistical power. Eligible patients were adults (≥18 years) who were inpatients, having been admitted through the Emergency Department, direct admission, or the operating room. Inclusion diagnoses encompassed cerebrovascular disease, demyelinating diseases, traumatic brain injury, headaches, neuropathies, metabolic encephalopathies, epilepsy, dementias, movement disorders, Gamma Knife radiosurgery (malignant and non-malignant), craniotomy, spine surgery, and pituitary adenoma.
Records lacking admission or discharge documentation, or with incomplete critical data - such as medical record number, full name, admission and discharge dates, diagnosis, sex, age, GCS at admission and within 24 hours prior to discharge/transfer/death, or NEWS2 at admission and within 24 hours prior to discharge/transfer/death - were excluded. A detailed patient selection flowchart is shown in Figure 1.
STROBE Diagram
Outcomes
The primary outcome was a composite of in-hospital mortality and urgent transfer to a critical care unit, where “urgent transfer” is understood as the imminent need to move the patient to the critical care area due to the risk of death if the transfer is not performed, regardless of time or other factors. Each component was also assessed individually as secondary outcomes.
Data collection
Clinical records were retrospectively reviewed to extract relevant outcomes and variables. Demographic, clinical, and anthropometric data were collected alongside VS, peripheral oxygen saturation (SpO₂), oxygen supplementation status, and GCS scores at hospital admission. Using these data, NEWS2, mREMS, and RAPS were calculated; all of these scales are open access [4,12,17].
To construct the model that predicts outcomes within the subsequent eight hours, physiological variables and EWS values for patients who developed an outcome (“cases”) were extracted from the time window within eight hours prior to the event. For patients who did not develop an outcome (“controls”), we extracted the single most abnormal value observed during the first 48 hours from hospital admission to serve as a comparator. After exclusions for incomplete records, there were no missing data in the analytic dataset for variables used in the models; therefore, no imputation was required.
Statistical analysis
All analyses were performed using IBM SPSS Statistics for Windows, Version 24 (Released 2016; IBM Corp., Armonk, NY, USA). Two prespecified multivariable logistic regression models were developed: (i) a hospitalization model to predict the occurrence of the composite outcome (in-hospital mortality or urgent transfer to critical care) at any time during the index hospitalization using admission measurements, and (ii) an eight-hour model to predict the composite outcome within the next eight hours using the time-window definitions described above. Candidate predictors included age, sex, body mass index, surgical status, systolic and diastolic blood pressure, mean arterial pressure, heart rate, respiratory rate, temperature, SpO₂, supplemental oxygen requirement, and GCS. Continuous predictors were modeled both linearly and as categories informed by observed probability distributions. Variables with Wald test p < 0.20 in either modeling approach were retained for multivariable analyses.
To derive the new score (NEURO-EWS), we included predictors that were statistically significant in either of the two logistic models. Complete specifications of the two original logistic regression models (predictors, coefficients, and intercepts) are provided in the Appendix. Regression β-coefficients from the final models were scaled and rounded to the nearest integer to assign item weights and generate the point-based score. Discrimination was quantified by the AUC, with 95% confidence intervals, calculated at admission and within eight hours prior to the event. Calibration was assessed by plotting observed outcome probabilities across score categories.
We categorized the total NEURO-EWS by visually inspecting the observed probability of the composite outcome at each possible score in the derivation cohort and selecting cut-points at the inflection transitions; adjacent scores with similar risks were collapsed to ensure a monotonic gradient and adequate counts per stratum. The resulting thresholds (minimal ≤1, low 2-5, intermediate 6, high ≥7) were prespecified and applied unchanged to the validation cohort.
For internal validation, the dataset was randomly partitioned a priori into a derivation (75%) and validation (25%) cohort, stratified by surgical status and outcome. All head-to-head comparisons between NEURO-EWS and existing EWS (NEWS2, mREMS, RAPS, GCS) were performed in the validation cohort to avoid optimism bias.
Differences in outcome probabilities between score categories were evaluated with the Mann-Whitney U test. Statistical significance was set at two-sided p < 0.05.
Development of a novel predictive model
The dataset was randomly partitioned into derivation (75%) and validation (25%) cohorts, stratified by surgical status and outcome. Multivariate logistic regression identified physiological variables associated with clinical outcomes.
Candidate predictors included age, sex, body mass index, surgical intervention during the current admission, systolic and diastolic blood pressure, mean arterial pressure, heart rate, respiratory rate, temperature, SpO₂, supplemental oxygen requirement, and GCS score. Models were developed using parameters recorded at admission and again using data from eight hours prior to the critical event.
Continuous variables were modeled both linearly and categorically. Predictors with Wald test p-values < 0.2 in either model were retained. Logistic regression β-coefficients were rounded to assign weights in the new scoring system. The predictors evaluated and their associations with outcomes are illustrated in Figures 2-3.
Predictors Assessed for the Development of NEURO-EWS (Baseline Characteristics, Glasgow Coma Scale, and Need for Supplementary Oxygen)This figure presents the predictors analyzed for the development of NEURO-EWS. It illustrates the distribution of the evaluated outcomes across the predictive variables, which are categorized based on the probability distribution analysis.Color coding of outcomes: blue = urgent transfer to the critical care area, red = death, green = composite outcome (urgent transfer to the critical care area or death).NEURO-EWS: Neurological Early Warning Score
Predictors Assessed for the Development of NEURO-EWS (Heart Rate, Respiratory Rate, and Temperature)This figure presents the predictors analyzed for the development of NEURO-EWS. It illustrates the distribution of the evaluated outcomes across the predictive variables, which are categorized based on the probability distribution analysis.Color coding of outcomes: blue = urgent transfer to the critical care area, red = death, green = composite outcome (urgent transfer to the critical care area or death).NEURO-EWS: Neurological Early Warning Score; bpm: Beats per Minute
Discriminative ability of the new score was assessed by AUC at admission and eight hours prior to the critical event, stratified by surgical status and outcome.
Results
Sample characteristics
A total of 671 electronic medical records meeting the predefined diagnostic criteria were included, as shown in Table 1. Of these, 340 patients (50.6%) had neurosurgical diagnoses. The median age was 56 years (interquartile range (IQR), 42-69 years), with a nearly equal sex distribution and a slight female predominance (51.2%).
Among patients with neurological conditions, cerebrovascular disease was the most prevalent diagnosis (117 patients, 17.4%), while spine surgery was the most frequent diagnosis among neurosurgical patients (102 patients, 15.2%). A complete list of diagnoses and their frequencies is available in Table 2. There were 41 composite outcomes (6.1%) observed, comprising 35 urgent transfers to critical care units and 13 in-hospital deaths.
Discriminative performance of EWS
All EWS demonstrated lower discriminative performance than what has been reported in the international literature. Additionally, EWS were generally less effective in patients with neurosurgical conditions compared to those with medical neurological diagnoses.
The NEWS2 score exhibited the highest AUC for predicting in-hospital mortality - both at admission and within the subsequent eight hours - across surgical, non-surgical, and combined patient cohorts. Conversely, the mREMS score yielded the highest AUCs for predicting critical care admission and the composite outcome, both at admission and within the following eight hours, in all patient subgroups. In contrast, the RAPS and GCS scales generally did not discriminate between patients who would or would not experience adverse outcomes better than chance.
Receiver operating characteristic (ROC) curves for all EWS, including the newly developed model, are presented in Figures 4-5.
ROC Curves for 4 EWS and NEURO-EWS for the Compound Outcome and Secondary Outcomes in Neurological and Neurosurgical Patients at 8 Hours Prior to the OutcomeThe areas under the ROC curve, for the 4 EWS analyzed and the NEURO-EWS, within the parentheses of each graphic, is the numerical value of the AUC.GCS: Glasgow Coma Score, mREMS: Modified Rapid Emergency Medicine Score, NEWS-2: National Early Warning Score, RAPS: Rapid Acute Physiology Score; ROC: Receiver Operating Characteristic; AUC: Area Under the Curve; EWS: Early Warning Score; NEURO-EWS: Neurological Early Warning Score
ROC Curve for 4 EWS and NEURO-EWS for the Compound Outcome and Secondary Outcomes Studied in Neurological Patients and Neurosurgical Patients at 8 Hours Prior to OutcomeThe areas under the ROC curve, for the 4 EWS analyzed and the NEURO-EWS, within the parentheses of each graphic, is the numerical value of the AUC.GCS: Glasgow Coma Score, mREMS: Modified Rapid Emergency Medicine Score, NEWS-2: National Early Warning Score, RAPS: Rapid Acute Physiology Score; ROC: Receiver Operating Characteristic; AUC: Area Under the Curve; EWS: Early Warning Score; NEURO-EWS: Neurological Early Warning Score
The discriminative performance of all scoring systems in the full sample is summarized in Table 3.
Discrimination data for non-surgical and surgical subgroups are provided in Tables 4-5, respectively.
Probability analyses for each outcome by EWS category are presented in Tables 6-9 and Figures 6-7.
Table 6: Probability of Studied Outcomes by NEWS-2 CategoriesHighlighted Mann-Whitney U values indicate differences between categories with a p-value < 0.05.NEWS-2: National Early Warning Score
Table 7: Probability of Studied Outcomes by mREMS CategoriesHighlighted Mann-Whitney U values indicate differences between categories with a p-value < 0.05.mREMS: Modified Rapid Emergency Medicine Score
Table 8: Probability of Studied Outcomes by RAPS CategoriesHighlighted Mann-Whitney U values indicate differences between categories with a p-value < 0.05.RAPS: Rapid Acute Physiology Score
Table 9: Probability of Studied Outcomes by GCS CategoriesHighlighted Mann-Whitney U values indicate differences between categories with a p-value < 0.05.GCS: Glasgow Coma Score
Distribution of the Probability of the Outcomes Studied by Category of the Scales Analyzed at AdmissionGCS: Glasgow Coma Score; mREMS: Modified Rapid Emergency Medicine Score; NEWS-2: National Early Warning Score; RAPS: Rapid Acute Physiology Score
Distribution of the Probability of the Outcomes Studied by Category of the Scales Analyzed at 8 Hours Prior to OutcomeGCS: Glasgow Coma Score; mREMS: Modified Rapid Emergency Medicine Score; NEWS-2: National Early Warning Score; RAPS: Rapid Acute Physiology Score
Calibration analysis
A linear relationship was observed between the NEWS2 score at admission and the incidence of all three outcomes throughout hospitalization. However, when predicting outcomes within eight hours, the relationship with the NEWS2 score was exponential.
The mREMS score exhibited exponential relationships with outcomes at both time points, except for in-hospital mortality prediction at admission, where higher scores paradoxically correlated with a lower likelihood of death. For the RAPS score, a direct linear relationship was noted with critical care admission and the composite outcome, while an inverse linear relationship was found with in-hospital mortality during the hospital stay. Within the eight-hour prediction window, RAPS demonstrated a logarithmic trend, with little differentiation between medium- and high-score categories.
GCS scores were broadly associated with the likelihood of all outcomes; however, due to limited variability in score distribution, scores were dichotomized, precluding the identification of a clear gradient of risk.
Development of a novel predictive model
The newly developed predictive model is presented in Table 10. This model outperformed NEWS2, mREMS, RAPS, and GCS in predicting the composite outcome, both at hospital admission and eight hours before a critical event. AUC values and ROC curves for the new model are shown in Table 3 and Figures 4-5, respectively. Calibration plots are shown in Figures 8-9.
Distribution of the Probability of the Outcomes Studied by Category of NEURO-EWS at AdmissionThe calibration plot illustrates the probability of the studied outcomes according to the categories defined by the new scale. The risk categories are as follows: minimal risk, ≤1 point; low risk, 2-5 points; intermediate risk, 6 points; and high risk, ≥7 pointsThe shaded gray area represents the 95% confidence interval (95% CI).NEURO-EWS: Neurological Early Warning Score
Distribution of the Probability of the Outcomes Studied by Category of NEURO-EWS at 8 Hours Prior to OutcomeThe calibration plot illustrates the probability of the studied outcomes according to the categories defined by the new scale. The risk categories are as follows: minimal risk, ≤1 point; low risk, 2-5 points; intermediate risk, 6 points; and high risk, ≥7 points.The shaded gray area represents the 95% confidence interval (95% CI).NEURO-EWS: Neurological Early Warning Score
Outcome probabilities across score categories are provided in Table 11.
Table 11: Probability of Different Outcomes by Categories of NEURO-EWSMann-Whitney U: Differences between categories with a p-value < 0.05 are shown in bold.NEURO-EWS: Neurological Early Warning Score
Discussion
This study analyzed a homogeneous patient population, thereby reducing the likelihood that specific characteristics or variables introduced bias or negatively affected the results. The median age of patients in our cohort was higher than the national average for hospital admissions in Mexico [24]. Notably, patients with neurological diagnoses exhibited a significantly higher incidence of unplanned transfers to critical care or in-hospital death compared to those with other conditions (61 vs. 22 episodes per 1,000 admissions, respectively). This elevated incidence was consistent across both neurological and neurosurgical groups. While the composite outcome incidence in our cohort aligns with that reported in previous EWS studies, it is markedly higher among patients with neurological disorders. These findings underscore the elevated risk of clinical deterioration in this population and suggest that patients with neurological conditions may derive greater benefit from EWS implementation than those with other diagnoses [16-19].
Among medical neurological patients, cerebrovascular events were the most frequent diagnosis (17.4%), followed by metabolic encephalopathies (11.3%). These results likely reflect the high prevalence of cardiovascular risk factors and metabolic disease within our population, consistent with national health data [24]. In the neurosurgical subgroup, lumbar radiculopathy (15.2%) was the most common diagnosis, followed by craniotomy (10%). These findings point to a predominance of degenerative and traumatic conditions, particularly in the context of an aging population. Gamma Knife radiosurgery for malignant conditions was the third most frequent procedure; when combined with benign indications, it became the second most prevalent neurosurgical intervention, potentially reflecting referral bias in our center. It is important to note that Gamma Knife is a procedure not widely used worldwide; even in referral centers, it is relatively rare - being more common in our center compared to others globally.
Overall, EWS demonstrated lower predictive accuracy for neurological patients than reported in general medical populations [9,11]. This reduced performance may be attributable to the absence of neurological-specific variables in existing scoring systems or to population-specific factors, such as lower baseline oxygen saturation levels related to altitude. One of the theories proposed here gains strength with the model we developed, since - as shown in the results - when neurological-specific variables are added, the predictive power of an EWS improves. Nevertheless, this is only one possible reason why EWS perform less effectively in neurological populations. Further studies are needed to analyze the specific causes of the lower predictive power of EWS in this group.
Among the validated tools, mREMS and NEWS-2 outperformed RAPS and GCS in predicting primary outcomes across all timeframes and subgroups, as well as secondary outcomes. Among the EWS, there was considerable variability between mREMS and NEWS-2 regarding which performed better, depending on several factors, such as the type of population being analyzed at that moment and the timeframe of evaluation. These results should be interpreted with caution, avoiding definitive conclusions or early assumptions about which of these two EWS is superior. For instance, in some cases - such as surgical and non-surgical neurological patients - the initial score showed a better area under the ROC curve with mREMS, while the confidence interval was more favorable with NEWS-2.
One of the possible reasons for mREMS being one of the two better EWS for predicting the analyzed outcomes may be the greater emphasis placed on GCS within the mREMS score, enhancing its discriminatory power in neurologically compromised patients. For this reason, our hypothesis and suggestion is that mREMS may be more appropriate than NEWS-2 or RAPS for use in neurological populations, emphasizing that further studies are needed to reach a definitive conclusion and to make a fully evidence-based recommendation. Importantly, mREMS offers this improved precision without added complexity. These results emphasize the value of tailoring EWS models to specific clinical contexts by integrating or reweighting key variables. This is consistent with previous findings, which demonstrated that the addition of heart rhythm to NEWS-2 significantly improved predictive performance in cardiovascular patients [20].
Our proposed model further supports this concept by showing that the inclusion of easily accessible variables - such as sex, age, or type of neurological condition - can enhance predictive accuracy. These findings highlight the need for context-specific refinement of EWS, particularly for specialized populations such as neurological inpatients. Future research should continue to evaluate existing models in distinct clinical subgroups to identify limitations and refine them accordingly. Additionally, incorporating other routinely available data, such as biochemical markers (e.g., capillary glucose, inflammatory markers) or imaging findings (e.g., CT or MRI results), may further improve predictive accuracy.
The ultimate goal is to implement such a system in real-world clinical settings to reduce morbidity and mortality in neurological patients, in conjunction with RRTs. Should existing EWS models prove insufficiently cost-effective, further optimization through the inclusion of additional easily obtainable clinical variables will be essential.
This study has several limitations. The retrospective design is inherently subject to information bias. Moreover, due to logistical constraints, we were unable to exclude patients who had opted for do-not-resuscitate orders or palliative care pathways from the primary outcome, although these patients constituted a small fraction of the total sample.
Conclusions
Although NEWS-2 is one of the most widely adopted EWS globally, our findings show it performs poorly in hospitalized patients with neurological conditions. These results underscore the need to evaluate alternative EWS tailored to specific hospital subpopulations with distinct demographic and clinical profiles. In our study, the mREMS system demonstrated higher point estimates for AUC predictive performance for catastrophic events and, in our view, represents a more appropriate tool for neurological inpatients.
Additionally, we propose a new predictive model - NEURO-EWS - specifically designed to detect adverse outcomes in patients with neurological and neurosurgical conditions. This model demonstrated strong predictive ability for in-hospital mortality, urgent transfer to critical care, and the composite of both outcomes, performing comparably to or better than widely used systems such as NEWS-2, mREMS, and RAPS. This makes it a potential new EWS that could be used for these types of patients. However, external validation, enhancement of this new EWS with additional variables, and prospective evaluation are necessary before widespread clinical implementation.
The reference list from the paper itself. Each links out to its DOI / PubMed record.
- 1Comparison of nine early warning scores for identification of short-term mortality in acute neurological disease in the emergency department J Pers Med Durantez-Fernández C Polonio-López B Martín-Conty JL 6301220223545574810.3390/jpm 12040630 PMC 9024907 · doi ↗ · pubmed ↗
- 2An overview of management of intracranial hypertension in the intensive care unit J Anesth Schizodimos T Soulountsi V Iasonidou C Kapravelos N 7417573420203244080210.1007/s 00540-020-02795-7PMC 7241587 · doi ↗ · pubmed ↗
- 3The rapid acute physiology score Am J Emerg Med Rhee KJ Fisher CJ Jr Willitis NH 27828251987359349210.1016/0735-6757(87)90350-0 · doi ↗ · pubmed ↗
- 4National Early Warning Score (NEWS) 2: Standardizing the assessment of acute-illness severity in the NHS 4 2022 2017 https://www.rcp.ac.uk/media/a 4ibkkbf/news 2-final-report_0_0.pdf
- 5Prehospital q SOFA, m SOFA, and NEWS 2 performance for sepsis prediction: a prospective, multi-center, cohort study Front Med (Lausanne) Melero-Guijarro L Sanz-García A Martín-Rodríguez F 11497361020233714403710.3389/fmed.2023.1149736 PMC 10151818 · doi ↗ · pubmed ↗
- 6Internal validation and comparison of the prognostic performance of models based on six emergency scoring systems to predict in-hospital mortality in the emergency department BMC Emerg Med Rahmatinejad Z Tohidinezhad F Rahmatinejad F Eslami S Pourmand A Abu-Hanna A Reihani H 682120213411208810.1186/s 12873-021-00459-7PMC 8194224 · doi ↗ · pubmed ↗
- 7Early warning system scores for clinical deterioration in hospitalized patients: a systematic review Ann Am Thorac Soc Smith ME Chiovaro JC O'Neil M 145414651120142529611110.1513/Annals ATS.201403-102OC · doi ↗ · pubmed ↗
- 8Validation of a modified early warning score in medical admissions QJM Subbe CP Kruger M Rutherford P Gemmel L 5215269420011158821010.1093/qjmed/94.10.521 · doi ↗ · pubmed ↗