Assessing Evolutionary Divergence in Genome‐Wide MADS‐Box Genes and Expression Profiles Between Toona ciliata and Toona sinensis
Xiao‐Han Liu, Yu Xiao, Yan‐Wen Lv, Zi‐Yun Wang, Chao Wu, Hui Xie, Xin‐Sheng Hu

TL;DR
This study compares MADS-box genes in two Toona species to understand how they contribute to differences in flower development and evolution.
Contribution
The study identifies evolutionary divergence in MADS-box genes and their expression between two Toona species.
Findings
MADS-box genes in Toona ciliata and Toona sinensis show high homology and conserved motifs within subfamilies.
Most MADS-box genes are under purifying selection, but some show weak positive selection in specific subfamilies.
Highly expressed MADS-box genes show a negative correlation with evolutionary rate, indicating evolutionary constraints.
Abstract
Toona ciliata and Toona sinensis, two economically important timber species in China, exhibit interspecific variation in floral traits that are related to mating systems. The MADS‐box genes play a crucial role in floral patterning of angiosperms. Here we identified 97 and 75 MADS‐box genes at the genome scale in T. ciliata and T. sinensis , respectively, which were classified into Type I and Type II groups. Genes within the same subfamily exhibited high homology and conserved motifs. Promoter analysis revealed cis‐acting elements related to growth, light response, hormone signaling, and stress response. Gene duplication was prevalent, with several genes undergoing multiple duplications. Most MADS‐box genes were under purifying selection between T. ciliata and T. sinensis , while eight orthologous genes in the AGL32, Mβ, MIKC*, AG/STK, and AP1/FUL subfamilies were under weakly…
Genes, proteins, chemicals, diseases, species, mutations and cell lines named across the full text — each resolved to its canonical identifier and authoritative record.
Click any figure to enlarge with its caption.
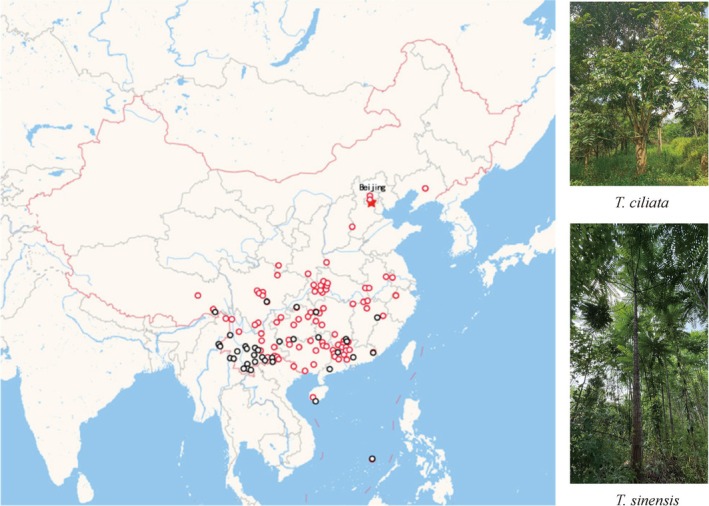 FIGURE 1
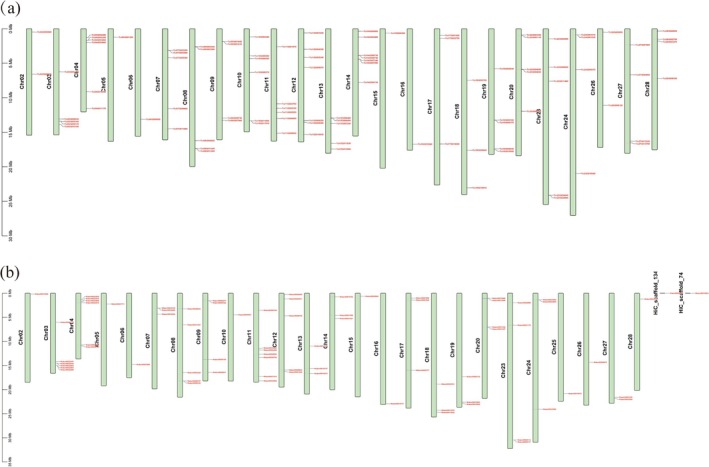 FIGURE 2
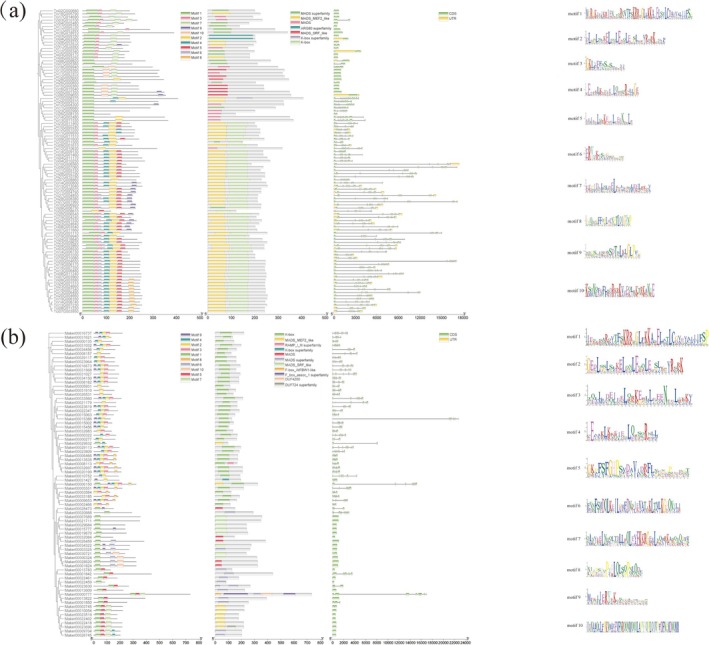 FIGURE 3
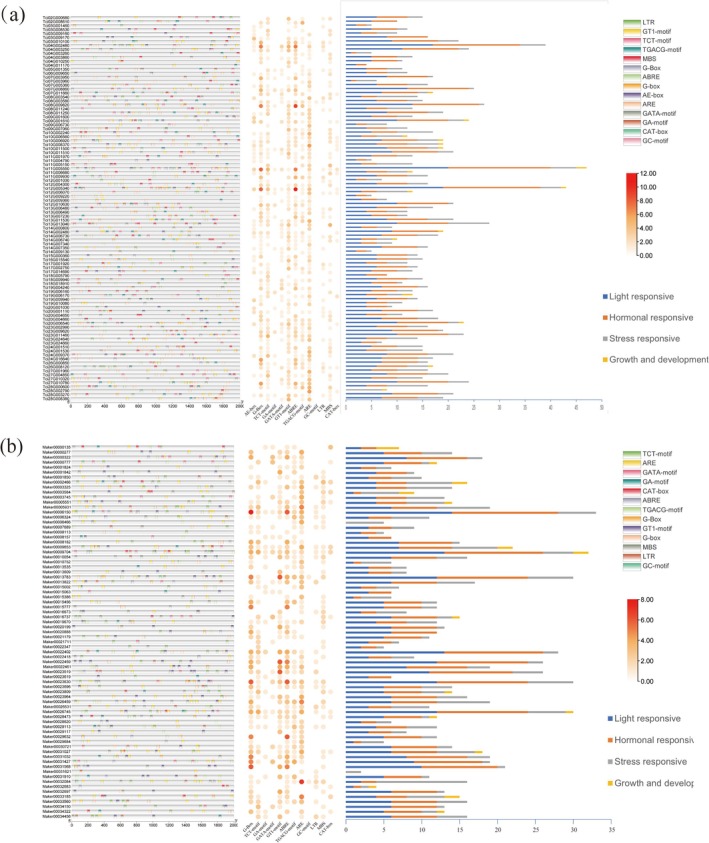 FIGURE 4
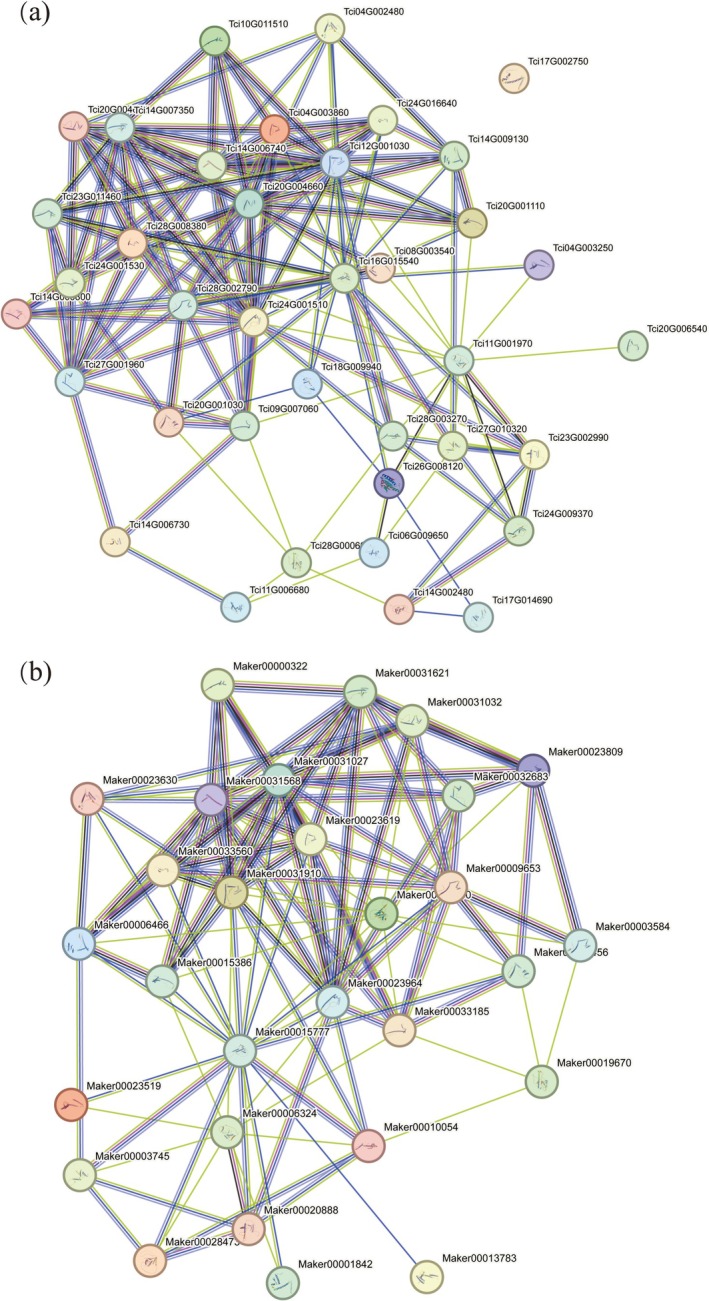 FIGURE 5
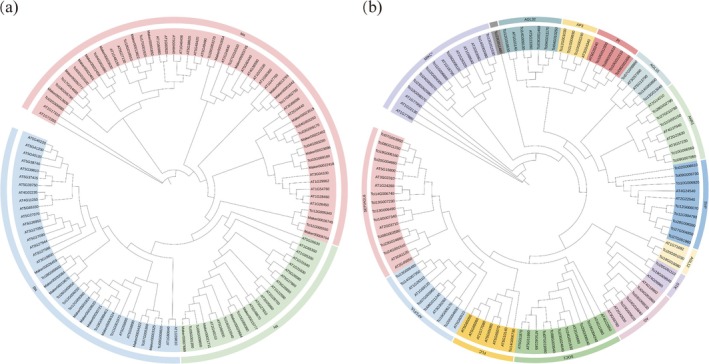 FIGURE 6
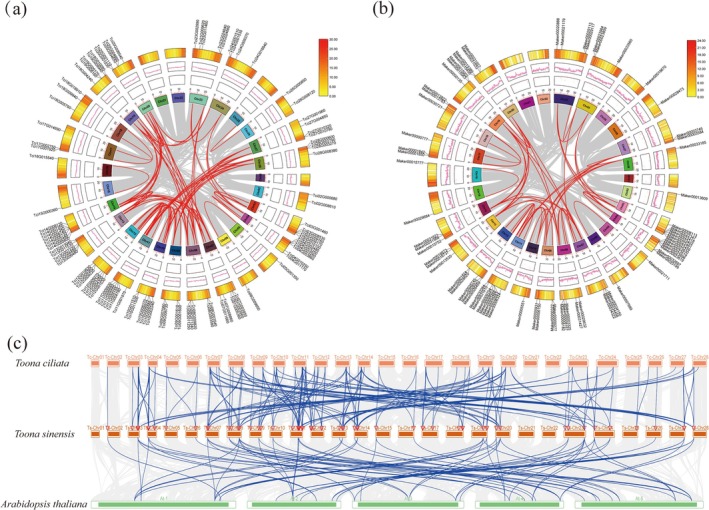 FIGURE 7
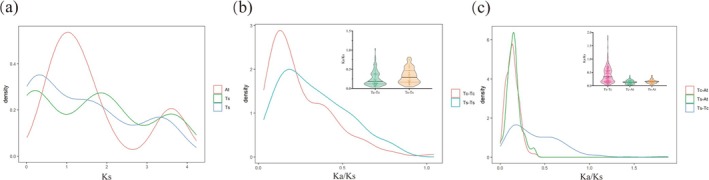 FIGURE 8
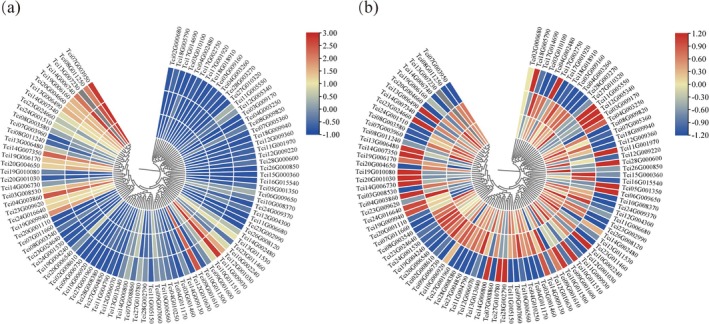 FIGURE 9
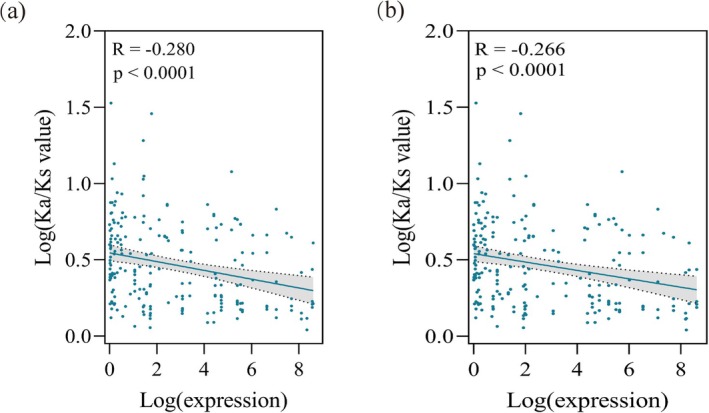 FIGURE 10
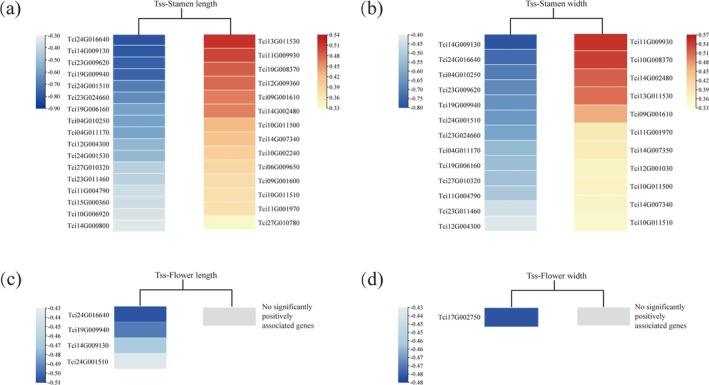 FIGURE 11
- —National Natural Science Foundation of China10.13039/501100001809
- —South China Agricultural University10.13039/501100012601
Peer Reviews
No public reviews on file for this paper yet. If you reviewed it on a platform where reviews are public (OpenReview, ICLR, NeurIPS, ICML), you can paste yours below so the community can read it here.
Videos
No videos yet. Explain this paper in a talk, walkthrough, or lecture? Add one.
Taxonomy
TopicsPlant Molecular Biology Research · Plant Reproductive Biology · Plant biochemistry and biosynthesis
Introduction
1
T. ciliata and T. sinensis are deciduous or semi‐deciduous plants and belong to the Toona genus of the Meliaceae family. T. ciliata is distributed across tropical and subtropical regions, including India, Malaysia, Indonesia, and southern China. This species is highly valued for its timber properties, such as the bright reddish‐brown heartwood, beautiful grain patterns, and durable, corrosion resistance. As such, it is a preferred material for crafts and furniture and has significant economic value, earning the nickname “Chinese Mahogany” (Cheng and Cui 2010; Edmonds and Staniforth 1998). The species is also used as the medicinal material for hemostasis, antibacteria, and anti‐inflammation (Malairajan et al. 2007; Selvalakshmi et al. 2007). The species is taxonomically divided into five varieties according to leaf and flower characteristics, encompassing T. ciliata var. ciliata, T. ciliata var. pubescens, T. ciliata var. yunnanensis, T. ciliata var. henryi, and T. ciliata var. sublaxiflora (Chen et al. 1997), and these varieties are closely related (Lv et al. 2025; Xiao et al. 2023). Owing to overexploitation and low natural regeneration, T. ciliata is classified as an endangered species at the second class in China (Fu and Jin 1992; National Forestry and Grassland Administration & Ministry of Agriculture and Rural Affairs 2021). Its genetic conservation has received ever‐increasing concern.
Unlike T. ciliata , T. sinensis has been cultivated for more than 2000 years in China. The tree barks are dark brown, and its inflorescences are terminal panicles. Both the young leaves and flowers emit a distinctive fragrance, and the flowering period occurs from June to July. The natural distribution of T. sinensis ranges from the southern temperate zone to the northern tropical regions of China (Lu et al. 2001), much wider than that of T. ciliata in China (Figure 1). Besides being a source of high‐quality timber, T. sinensis is widely used as the material for food sources as well as for traditional Chinese medicine and is a valuable economic species (Hao 2003; Jiao et al. 2019; Liao et al. 2009; Peng et al. 2019). In general, both T. ciliata and T. sinensis are precious species for timber industrial and medicinal purposes in China (Wang, Xiao, He, Li, Lv, et al. 2022).
Different ranges in natural distribution between T. ciliata (black circles) and T. sinensis (red circles) in China. This figure was drawn by synthesizing the distribution map of specimens of the two species from the Chinese Virtual Herbarium website (https://www.cvh.ac.cn/). The distribution of each species can be searched by inputting the species names on the website. Each point in the map represents a record of specimens collected from the corresponding position (Wang, Xiao, He, Li, Lv, et al. 2022).
One striking feature is that both species initially have perfect flowers in floral development, but as flower development proceeds, some flowers become functionally unisexual, producing different mating systems between them. T. sinensis develops a more strictly outcrossing system, whereas T. ciliata exhibits a mixed mating system, that is, predominantly outcrossing with selfing and inbreeding (Zhou et al. 2020). There are significant interspecific variations in floral traits (Cheng 2021), and genes associated with interspecific floral differences potentially participate in forming their divergent mating systems (Dart et al. 2012; Goodwillie et al. 2006; Lin and Ritland 1997). The two species were divergent at about 6–25 Mya from common ancestral populations (Wang, Xiao, He, Li, Lv, et al. 2022). The long‐term process of natural selection could evolve their developmental divergence and produce differential expression of genes associated with floral traits. Thus, identifying genes associated with floral traits and assessing their evolutionary mechanisms would provide insights into their roles in forming divergent mating systems.
MADS‐box genes are excellent candidates for studying functional genes associated with floral traits, such as the formation of floral morphology and initialization of flowering time. These genes exhibit similarities in sequence, protein‐coding characteristics, and functional properties (Theißen et al. 1996) and consist of a family of MADS‐box genes. They encode transcription factors that share a common DNA‐binding domain (MADS‐box) and recognize similar target DNA sequences. Formation of this gene family can be traced back to a key gene duplication event, which yielded two major lineages: SRF (serum response factor)‐like (Type I) and MEF2 (myocyte enhancer factor 2)‐like (Type II) (Alvarez‐Buylla et al. 2000). Type I genes encode proteins that possess a core MADS domain (M domain), with a relatively simple structure, and are classified into three subfamilies: Mα, Mβ, and Mγ (Parenicova et al. 2003; Wu et al. 2010). Type II genes, also known as MIKC‐type, encode proteins that, in addition to the MADS conserved domain, contain an intervening domain (I domain), a characteristic keratin‐like domain (K domain), and the least conserved carboxyl‐terminal domain (C domain) (Riechmann and Meyerowitz 1997). The MIKC‐type proteins are further classified into two subfamilies, MIKCC and MIKC*, based on the repetitive exon sequences within the K domain (Chen et al. 2017; Lai et al. 2019), displaying complex structure.
Ample evidence showed the significant effects of the MADS‐box gene family in a wide range of functions in plants (Airoldi and Davies 2012; Smaczniak et al. 2012; Tang et al. 2022; Zhang et al. 2024). For instance, there were 38 Type I genes expressed during female gametophyte and seed development in Arabidopsis thaliana (Qiu and Köhler 2022). MIKC* genes (Type II) were expressed during pollen development in both A. thaliana and Oryza sativa , playing a crucial role in pollen maturation (Liu et al. 2013). MIKC^C^ genes are involved in reproductive processes, such as floral induction and the formation of floral organs. Expression of subfamily genes, such as SVP, FLC, SOC1, ANR1, and AP1/FUL, is influenced by the developmental stages, environmental factors (such as light and temperature), and hormones, which further promote or impede the transition from vegetative to reproductive growth and determine floral organ identity. This regulation enhances plant adaptation to changing environments (Guo et al. 2019; Kennedy and Geuten 2020; Yue et al. 2021; Zhang et al. 2022). Evidence also implies that MADS‐box genes play a conservative and dominant role in both floral development and self‐incompatibility. For instance, Taraxacum kok‐saghyz (apomixis) and T. mongolicum (self‐incompatibility) exhibited entirely different reproductive modes, where the MADS‐55 gene in T. kok‐saghyz was potentially involved in self‐incompatibility (Chen et al. 2023).
Here we conducted genome‐wide identification of the MADS‐box gene family in T. ciliata and T. sinensis based on our previous genome sequencing of T. ciliata and transcriptomic data of 150 samples of flowers. Since T. ciliata is classified into five varieties according to leaf and flower characteristics (Chen et al. 1997), we proceeded to employ two varieties ( T. ciliata var. ciliata and T. ciliata var. pubescens) that are closely related (Lv et al. 2025; Xiao et al. 2023) and compared their divergence from T. sinensis in expression profiles of the MADS‐box genes. We analyzed phylogenetic relationships among MADS‐box genes, chromosomal mapping of the family members, and the evolutionary processes underlying orthologous MADS‐box genes between species. Besides, TWAS was conducted to identify the MADS‐box genes that were associated with floral traits. By assessing the evolutionary divergence between T. ciliata and T. sinensis in MADS‐box genes, we elucidated the role of the MADS‐box gene family in maintaining interspecific variation in floral traits and hence in potentially shaping divergent mating systems between T. ciliata and T. sinensis .
Results
2
Identification and Structure of the MADS‐Box Genes
2.1
A total of 97 and 75 MADS‐box gene family members were identified from the whole genomes of T. ciliata var. ciliata and T. sinensis , respectively. Analysis of the physicochemical properties of these MADS‐box genes (Table S1) revealed that the coding sequences (CDS) in T. ciliata var. ciliata ranged from 357 to 1221 bp, while the coding sequences in T. sinensis ranged from 255 to 2202 bp. The molecular weights of the corresponding proteins coded by these genes ranged from 13.8 to 45.9 KDa in T. ciliata var. ciliata and from 9.6 to 83.9 KDa in T. sinensis . The isoelectric points (pI) of the proteins ranged from 4.65 to 10.28 for T. ciliata var. ciliata and from 4.64 to 10.18 for T. sinensis . Notably, in T. ciliata var. ciliata, 25 MADS‐box proteins had the pI below 7, indicating the acidic nature, while 72 proteins had the pI above 7, indicating alkalinity. In T. sinensis , 37 MADS‐box proteins exhibited the acidic nature (pI < 7), and 38 proteins were alkaline (pI > 7). Analysis of physicochemical data indicated considerable variations in the properties of MADS‐box gene family members, indicating the complexity and diversity of MADS‐box proteins in both T. ciliata var. ciliata and T. sinensis . Subcellular localization results indicated that these MADS‐box proteins were localized in the nucleus, consistent with their role as transcription factors (Table S1).
To investigate the physical distribution of MADS‐box genes on chromosomes, we observed that the MADS‐box genes in T. ciliata var. ciliata were unevenly distributed across 24 chromosomes, without MADS‐box genes on chromosomes Chr01, Chr21, Chr22, and Chr25 (Figure 2a). Similarly, the MADS‐box genes in T. sinensis were unevenly distributed across 25 chromosomes, without MADS‐box genes on chromosomes Chr01, Chr21, and Chr22. Additionally, two MADS‐box genes (Maker00006466 and Maker00010054) from the genome's GFF annotation file were not located on any chromosome (Figure 2b).
Distribution of MADS‐box gene family members across chromosomes. (a) T. ciliata var. ciliata; (b) T. sinensis . The orange‐red labels indicate the physical positions of MADS‐box genes on each chromosome. Chromosome sizes were scaled down according to their real lengths (Mb).
Conserved Motifs of MADS‐Box Proteins
2.2
To characterize the structure of the MADS‐box gene family members in T. ciliata var. ciliata and T. sinensis , we predicted the conserved motifs within their amino acid sequences. The results showed that the MADS‐box genes in both species encoded proteins containing either the MADS domain or the K‐box domain, with 10 conserved motifs identified and labeled by Motif 1 to Motif 10 (Figure 3). In T. ciliata var. ciliata, the 97 MADS‐box genes contained 1 to 7 motifs and were distributed diversely, with Motif 1 corresponding to the typical MADS‐box domain and Motif 2 corresponding to the K‐box domain (Figure 3a). In T. sinensis , the 75 MADS‐box genes contained 1 to 6 motifs, with a similar diverse distribution; Motif 1 also represented the typical MADS‐box domain, while Motif 4 represented the K‐box domain (Figure 3b). Most genes in both species contained the typical MADS‐box domain, indicating its common role in the gene family, while the distribution of other motifs reflected structural similarities within subfamilies.
Conserved protein motifs and structure of MADS‐box genes. (a) T. ciliata var. ciliata; (b) T. sinensis . The left panel shows the phylogenetic relationships among proteins encoded by the MADS‐box genes. The middle panels illustrate the distribution of conserved motifs (colored boxes) and exon–intron structure of the corresponding genes. The right panels display sequence logos of the conserved motifs generated by MEME.
To gain a deeper understanding of the structural diversity, similarity, and evolutionary relationships of MADS‐box genes, we further analyzed the arrangement of introns and exons, along with the conserved motifs. The results (Figure 3) indicated that, in T. ciliata var. ciliata, 15 out of the 97 MADS‐box genes (15.96%) lacked introns, and most genes contained 5 to 8 introns. In T. sinensis , 22 out of the 75 MADS‐box genes (29.33%) lacked introns, and most MADS‐box genes contained 4 to 7 introns. A comparison analysis revealed different numbers of introns between the two species, with Type I genes having simpler structures and fewer introns, and Type II genes having more complex structures and more introns.
Cis‐Acting Elements in Promoters of the MADS‐Box Genes
2.3
The distribution of cis‐acting elements in gene promoters is related to potential regulatory mechanisms and functional roles of the genes. Figure 4 shows the cis‐acting elements in promoters of MADS‐box genes in T. ciliata var. ciliata and T. sinensis . The MADS‐box gene promoters in both species contained various elements, including light‐responsive, plant growth, stress‐responsive, and hormone response elements. Among these, the light‐responsive elements were particularly abundant, indicating that light could play a significant role in regulating the expression of MADS‐box genes in T. ciliata var. ciliata and T. sinensis . Additionally, a considerable number of hormone response elements were identified in the promoters of MADS‐box genes in both species. Given the critical roles of plant hormones in flower initiation and organ development, MADS‐box genes in both species could play important roles in flower development and organ formation.
Classification and functions of cis‐acting elements in MADS‐box gene promoters: (a) T. ciliata var. ciliata; (b) T. sinensis. The figure consists of, from left to right, the distribution map of promoter elements, the bubble plot of promoter elements, and the stacked bar chart of different functions.
Protein–Protein Interaction Networks of the MADS‐Box Genes
2.4
To explore the functional relationships of MADS‐box genes in T. ciliata var. ciliata and T. sinensis , we predicted the protein–protein interaction (PPI) networks using the STRING database, with A. thaliana proteins as the reference. The results showed that, in T. ciliata var. ciliata, all MADS‐box proteins except for Tci17G002750 (a member of the Mα subfamily) exhibited different degrees of interactions with other proteins. Notably, the Tci20G004660 protein from the SEP subfamily was positioned at the center of the network, showing strong interactions with the other gene family members (Figure 5a). In T. sinensis , MADS‐box proteins also displayed different levels of interactions, where Maker00031568 and Maker00031027 from the SEP subfamily, Maker00023619 from the AG subfamily, and Maker00031910 from the AP3 subfamily at the network's core demonstrated close interactions with the other gene family members (Figure 5b).
Networks for protein–protein interactions (PPIs) among proteins encoded by MADS‐box genes: (a) T. ciliata var. ciliata; (b) T. sinensis . PPIs were predicted using the STRING database with A. thaliana as the reference.
Evolution Mechanisms of the MADS‐Box Genes
2.5
Multiple sequence alignments were performed for 97 MADS‐box family members in T. ciliata var. ciliata and 75 MADS‐box family members in T. sinensis. The relevant proteins from A. thaliana as the outgroup were employed to construct a phylogenetic tree using IQ‐TREE2. The phylogeny of the MADS‐box family members was separately constructed with Type I and Type II groups. Type I was further divided into three subfamilies: Mα, Mβ, and Mγ (Figure 6a); while Type II was divided into two subgroups, MIKC* and MIKC^C^. The MIKC^C^ group was further subdivided into subfamilies including SEP/AGL6, AP1/FUL, SOC1, FLC, AG/STK, AGL12, ANR1, SVP, AGL15, AP3, PI, and AGL32 (Figure 6b). The MADS‐box family members in T. ciliata var. ciliata were distributed across all major clades, although the Tci23G011460 gene was not assigned to a specific category. The MADS‐box family members in T. sinensis were found in all subfamilies except for FLC, indicating the absence of FLC that was likely related to the unique biological characteristics or environmental adaptation of this species.
Phylogenetic tree of MADS‐box proteins among T. ciliata var. ciliata, T. sinensis , and A. thaliana . (a) Type I MADS‐box proteins; (b) Type II MADS‐box proteins. Subfamilies are indicated in different colors based on their classifications.
Intra‐and interspecific collinearity analyses were conducted to investigate gene duplication events with the MADS‐box genes in T. ciliata var. ciliata, T. sinensis , and A. thaliana . The intraspecific collinearity analysis revealed 100 and 63 homologous gene pairs in T. ciliata var. ciliata (Figure 7a) and T. sinensis (Figure 7b), respectively. The MADS‐box gene family in both species underwent different degrees of conserved evolution and gene duplication events. The interspecific synteny analysis revealed 213 homologous gene pairs between T. ciliata var. ciliata and T. sinensis , and 72 homologous gene pairs between T. sinensis and A. thaliana (Figure 7c). The MADS‐box gene family showed numerous collinearity blocks, indicating multiple duplication events between species. These results indicate that the MADS‐box gene family exhibited high intraspecific conservation, although it underwent frequent interspecific duplication events in the genomes of T. ciliata var. ciliata and T. sinensis .
Collinearity analysis of MADS‐box genes in T. ciliata var. ciliata, T. sinensis , and A. thaliana . (a) Intragenomic collinearity and duplication events of MADS‐box genes in T. ciliata var. ciliata (red lines for collinearity between genes); (b) Intragenomic collinearity and duplication events of MADS‐box genes in T. sinensis (red lines for collinearity between genes); (c) Interspecific collinearity of MADS‐box genes among T. ciliata var. ciliata, T. sinensis , and A. thaliana (blue lines for collinearity between orthologous genes).
The distribution of synonymous substitution rate (Ks) between paralogous genes indicated that MADS‐box genes underwent three duplication events in both T. ciliata var. ciliata and T. sinensis (Figure 8a). Figure 8b indicated that most gene family members were under purifying selection during evolution (Ka/Ks < 1). The Ka/Ks ratio ranged from 0.0311 to 1.0425 in T. ciliata var. ciliata, with the mean of 0.2549 ± 0.1934 from estimates of 100 gene members, and from 0.0413 to 0.8141 in T. sinensis , with the mean of 0.3283 ± 0.1981 from estimates of 63 gene members. Kolmogorov–Smirnov (K‐S) test showed a significant difference between two species (statistics D = 0.2436, p value = 0.0163), indicating that T. ciliata var. ciliata was generally under stronger purifying selection than T. sinensis among the MADS‐box gene family members.
Distribution of synonymous (Ks) and nonsynonymous (Ka) substitution rates and their ratio (Ka/Ks) of the MADS‐box genes. (a) Ks for the paralogous genes within T. ciliata var. ciliata, T. sinensis and A. thaliana ; (b) Ka/Ks between paralogous members in T. ciliata var. ciliata and T. sinensis ; (c) Ka/Ks of the orthologous genes between T. ciliata var. ciliata and T. sinensis , between T. ciliata var. ciliata and A. thaliana , and between T. sinensis and A. thaliana .
The Ka/Ks ratio for orthologous MADS‐box genes ranged from 0.0042 to 0.3936 between T. ciliata var. ciliata and A. thaliana , with the mean of 0.1400 ± 0.0707 from estimates of 101 gene members, and from 0.0020 to 0.3859 between T. sinensis and A. thaliana, with the mean of 0.1526 ± 0.0762 from estimates of 72 gene members (Figure 8c). There were no significant differences between these two pairs of comparisons (K‐S test, D = 0.1225, p value = 0.5013). This indicated that strong purifying selection occurred for all MADS‐box mutant genes in Toona species compared with those in A. thaliana , and more than 85% (1‐Ka/Ks) of deleterious mutant genes were eliminated by natural selection. However, selection strength was generally weaker for all MADS‐box mutant genes in T. ciliata var. ciliata compared with T. sinensis , with Ka/Ks of 0.4081 ± 0.2947 and the range from 0.0289 to 1.8828. There were eight orthologous genes between T. ciliata var. ciliata and T. sinensis showing positive selection, and these genes belonged to the AGL32, Mβ, MIKC*, AG/STK, and AP1/FUL subfamilies.
Expression Comparison Among Taxa in the MADS‐Box Genes
2.6
Based on the transcriptomic data from samples of mixed flowers of 150 individuals (Xiao 2025), we plotted a heatmap in terms of expression levels of the MADS‐box genes. Figure 9a shows the expression differences among 97 MADS‐box genes for each taxon. Figure 9b shows the expression differences among three taxa for each MADS‐box gene. The analysis revealed that the expression patterns of MADS‐box genes had certain commonalities among T. ciliata var. ciliata, T. ciliata var. pubescens, and T. sinensis , particularly within the SEP, AP1/FUL, AG/STK, PI, and AP3 subfamilies, where these genes exhibited relatively high expression levels. Notably, the expression patterns of these subfamily genes were highly conserved across species, indicating the conserved functions of the MADS‐box genes in floral development in T. ciliata var. ciliata and T. sinensis . Comparative expression analysis revealed that most MADS‐box genes exhibited similar patterns between T. ciliata var. ciliata and T. ciliata var. pubescens, likely reflecting their close phylogenetic relationship. However, the expression levels of many MADS‐box genes in T. sinensis varied, indicating the presence of different regulatory mechanisms in floral development. A reviewer pointed out the impact of growing niches on gene expression. Note that the large samples of flowers at the same developmental stage could mainly reflect genetic variation between species, although a complete removal of the influence of growing niches on interspecific variation in gene expression is challenging. The large sample sizes could provide robust inferences for TWAS (described in the next section) within each taxon.
Heatmaps for expression profiles of the MADS‐box genes in flowers of 150 samples. (a) Comparison of expression levels among different genes for each taxon; (b) Comparison of expression levels among three taxa for each MADS‐box gene. In each figure, the outside circle represents the expression profile of T. sinensis , the middle circle for T. ciliata var. pubescens, and the innermost circle for T. ciliata var. ciliata. Levels of gene expression are indicated in different colors.
We further tested the relationship between the gene expression level and the evolutionary rate of MADS‐box genes. The MADS‐box genes from A. thaliana were employed as the referent genes to calculate the Ka/Ks values for orthologous genes in T. ciliata var. ciliata (or T. ciliata var. pubescens) and T. sinensis . The expression levels of MADS‐box genes were derived from transcriptomes of flowers of 100 samples T. sinensis and T. ciliata var. pubescens. Figure 10 indicated the presence of significantly negative correlations between Ka/Ks and gene expression levels. The deleterious mutant alleles underwent stronger purifying selection but had higher expression levels in flowers.
Correlation between the gene expression level and evolutionary rate (Ka/Ks). (a) T. sinensis — T. ciliata var. ciliata; (b) T. sinensis — T. ciliata var. pubescens. In both figures, Ka/Ks values were calculated for orthologous gene pairs. Gene expression levels were obtained from transcriptome data of 100 flowers. A significantly negative correlation occurred between log‐transformed gene expression levels and log‐transformed Ka/Ks values in both taxon pairs.
TWAS of the MADS‐Box Genes
2.7
TWAS was separately conducted to identify MADS‐box genes associated with each floral trait in T. ciliata var. ciliata, T. ciliata var. pubescens, and T. sinensis . We identified 31, 24, 4, and 1 genes that were significantly associated with the stamen length, stamen width, flower length, and flower width (FDR < 0.05), respectively, in T. sinensis (Figure 11). Notably, the stamen length and width were both affected by the expression of multiple MADS‐box genes. Specifically, there were 17 MADS‐box genes that were negatively correlated with the stamen length and 14 genes that were positively correlated with the trait (Figure 11a). There were respectively 13 and 11 MADS‐box genes that were negatively and positively correlated with the stamen width (Figure 11b). Four MADS‐box genes were negatively correlated with the flower length but none were significantly positively associated with the trait (Figure 11c). Only one gene was negatively correlated with the flower width, and none was significantly positively associated with this trait (Figure 11d). Among the MADS‐box genes, four genes, encompassing Tci24G016640 and Tci19G009940 (AG/STK subfamily), Tci14G009130 (AGL32 subfamily), and Tci24G001510 (SEP/AGL6 subfamily), were simultaneously significantly associated with the stamen length, stamen width, and flower length in T. sinensis , highlighting their important roles in floral trait regulation.
TWAS between gene expression and floral traits in T. sinensis . The MADS‐box genes significantly associated with four floral traits (FDR < 0.05) are presented: (a) stamen length, (b) stamen width, (c) flower length, and (d) flower width. In each panel, heatmaps display the correlation coefficients between the gene expression level and a floral trait value. Blue blocks stand for genes with negative correlations with the trait in different degrees, red blocks for genes with positive correlations in different degrees, and gray blocks for genes without positive correlations with the trait.
Although the MADS‐box genes associated with floral traits were also detected in T. ciliata var. ciliata and T. ciliata var. pubescens, none passed the FDR threshold after multiple‐test corrections (Table S2).
Discussion
3
The MADS‐box genes encode an array of transcription factors that are widely involved in various stages of plant growth and development and particularly play key roles in inflorescence, flowering, and fruit development (Becker and Theißen 2003). Throughout plant evolution, numerous gene duplication and loss events occurred in history. The retention of duplicated genes varies greatly across species, leading to significant differences in the richness and abundance of the MADS‐box genes among species. For instance, there are 107 MADS‐box gene members in A. thaliana (Parenicova et al. 2003), 108 members in chrysanthemum (Won et al. 2020), and 79 members in Prunus persica (L.) Batsch (Wells et al. 2015). Here we identified that more MADS‐box genes occurred in T. ciliata var. ciliata than in T. sinensis (97 vs. 75), consistent with a general pattern of more gene family expansion in T. ciliata var. ciliata (Wang, Xiao, He, Li, Lv, et al. 2022; Wang, Xiao, He, Li, Song, et al. 2022). The MADS‐box genes in the two species included both Type I and Type II of MADS‐box genes, and Type I was further subdivided into three subfamilies and Type II into 13 subfamilies. In T. ciliata var. ciliata, the MADS‐box genes were distributed in all subfamilies, while in T. sinensis , they were distributed in all subfamilies except for the FLC subfamily.
Compared with A. thaliana , both T. ciliata var. ciliata and T. sinensis had fewer Type I genes but more Type II genes. This evolutionary divergence is likely related to natural adaptation where the Toona species have a more restrictive distribution than A. thaliana . Notably, A. thaliana contains six genes in the FLC subfamily, while T. ciliata var. ciliata and T. sinensis have only one and zero FLC genes, respectively. It is recognized that the FLC genes in A. thaliana are critical regulators of flowering time and play crucial roles in ecological responses to cold stress. The FLC genes act as key integrators of environmental and endogenous developmental signals (Becker and Theißen 2003; Sheldon et al. 2000). Therefore, the FLC gene expansion facilitates adaptation to diverse environmental conditions (e.g., light and temperature) in different habitats. For instance, compared with A. thaliana and Oryza sativa , the FLC subfamily is significantly expanded in Triticum aestivum , which enhances its adaptation to various habitats and expands its global distribution (Schilling et al. 2020). In contrast, plants (e.g., O. sativa and Citrullus lanatus ) do not require vernalization for flowering and lack FLC subfamily genes (Arora et al. 2007; Wang et al. 2019). Thus, it is speculated that T. ciliata and T. sinensis could not require vernalization for flowering.
Structural differences in subfamilies of the MADS‐box genes between T. ciliata var. ciliata and T. sinensis highlight the divergent evolutionary processes underlying them. For instance, T. ciliata var. ciliata had 11 subfamilies of Type II members, while T. sinensis had eight subfamilies. It remains to be explored whether this difference limits the natural distribution of T. ciliata or not in comparison with T. sinensis in China. However, both T. ciliata var. ciliata and T. sinensis generally exhibited a simpler structure with fewer introns in Type I MADS‐box genes, which could arise from intron loss during gene evolution. In contrast, Type II genes were more complex and had abundant introns and considerable variation in arrangement, a pattern similar to that observed in the MADS‐box genes of O. sativa (Arora et al. 2007). Such a difference in intron abundance and arrangement implies the significance of these genes in structural evolution. The conserved motifs between T. ciliata var. ciliata and T. sinensis imply their effects on maintaining the conserved function of MADS‐box genes.
Gene duplication and transposition events are important factors driving the expansion of gene families and increasing the complexity of eukaryotic genomes (Hughes 1994). The presence of numerous collinearity blocks suggests that the MADS‐box gene families potentially underwent multiple gene duplication events prior to the divergence between T. ciliata var. ciliata and T. sinensis (Wang, Xiao, He, Li, Lv, et al. 2022). The interspecific differences in abundance and MADS‐box structure were formed during the subsequent genomic evolution after speciation. The evolutionary processes for generating such divergences are unknown. These divergences could contribute to the functional diversification of MADS‐box genes in regulating interspecific variation in floral traits. Additionally, the functional regulation of MADS‐box genes is closely associated with cis‐regulatory elements in their promoters (Preston and Hileman 2013). The MADS‐box gene promoters in both T. ciliata var. ciliata and T. sinensis contain numerous cis‐regulatory elements related to light response and hormone signaling, implying that these genes could regulate growth, flowering, and adaptation to environmental changes.
Similar patterns of interspecific selection pressures (Ka/Ks) generally reflect the long‐distant genetic relationships between T. ciliata var. ciliata (or T. ciliata var. pubescens) and A. thaliana and between T. sinensis and A. thaliana in the MDAS‐box gene family. However, our results imply that T. ciliata var. ciliata and T. sinensis underwent different strengths of purifying selection against MADS‐box genes after speciation. The interspecific selection pressures between T. ciliata and T. sinensis (0.4081 ± 0.2947) were generally weaker than interfamily members within T. ciliata (0.2549 ± 0.1934) or T. sinensis (0.3283 ± 0.1981), implying more strict limitations on the number of MADS‐box genes. The presence of eight orthologous genes between T. ciliata and T. sinensis with positive selection (Ka/Ks > 1) suggests potentially disruptive selection driving species divergence in the AGL32, Mβ, MIKC*, AG/STK, and AP1/FUL subfamilies.
The identified subfamilies with genes of positive selection are likely related to plant mating systems besides their effects on adaptation to environments. Previous studies showed that the AGL32 (Bsister) subfamily with genes of positive selection affected ovule and fruit development in plants (Yang et al. 2012; Yin and Xue 2012). The AGL32 subfamily gene MADS‐55 affected self‐incompatibility in T. kok‐saghyz (self‐incompatibility) and T. mongolicum (apomixis) (Chen et al. 2023). The MIKC* subfamily genes affect pollen maturation in Arabidopsis and rice (Liu et al. 2013). Class C gene AGAMOUS (AG) affects stamen and carpel identity during early flower development and is closely associated with the formation of carpels, ovules, and fruit (Bowman 1989). The D‐class gene SEEDSTICK (STK) is involved in the development of ovules and seeds, and in promoting seed dispersal after fertilization, with strong temporal and spatial expression specificity (Dreni and Kater 2014; Mizzotti et al. 2012). In Arabidopsis thaliana , the AP1/FUL subfamily includes APETALA1 (AP1), which functions as a class A gene in sepal and petal identity, and FRUITFULL (FUL), which is involved in the development of cauline leaves and siliques (Gu et al. 1998; Litt and Irish 2003). Therefore, it is naturally hypothesized that these subfamilies' genes are likely associated with divergent mating systems between T. ciliata and T. sinensis (Zhou et al. 2020). Note that T. ciliata and T. sinensis are not an ideal model system for testing this hypothesis since their mating systems are not completely contrasted (outcrossing for T. sinensis vs. predominantly outcrossing with partial selfing and inbreeding for T. ciliata ). Future study using alternative plant species with contrast mating systems (e.g., selfing vs. outcrossing) could be effective to verify whether these MADS‐box genes evolve plant mating systems.
Previous research indicated a significantly negative correlation between the Ka/Ks ratio and gene expression level (Li, Li, et al. 2023). This was the same case for most MADS‐box genes in T. ciliata and T. sinensis where a significant negative correlation between Ka/Ks values and gene expression levels occurred. The pattern is consistent with theoretical prediction where, given a deleterious mutant allele with section coefficient s, the Ka/Ks ratio decreases as the purifying selection strength (4Nes where N _ e _ is the effective population size) increases (Kimura 1962; Li, Xiao, et al. 2023; Xiao et al. 2024). This result further suggests a complex interplay among selection pressure, evolutionary rates, and gene expression in MADS‐box genes, with these factors jointly shaping floral development of T. ciliata and T. sinensis .
Patterns of expression profiles of MADS‐box family genes revealed significant differences in flowers between T. ciliata and T. sinensis . Notably, genes from SEP, AP1/FUL, AG/STK, PI, and AP3 subfamilies exhibited unregulated expression, suggesting that these genes affected flowering and floral organ morphogenesis in both species. The differential expression of these genes was associated with interspecific variations in floral traits and likely related to divergent mating systems between T. ciliata and T. sinensis . Furthermore, MADS‐box family genes are key regulators during floral development in T. ciliata and T. sinensis . TWAS also evidenced the correlations between MADS‐box genes and floral trait variations. These findings provide new insights into future studies on the functional roles of MADS‐box genes in driving interspecific variation in floral traits.
TWAS in T. sinensis revealed significant associations between the expression of some MADS‐box genes and floral traits, particularly the stamen length and width, indicating that these genes could involve floral development. Four genes (Tci24G016640, Tci19G009940, Tci14G009130, and Tci24G001510) were significantly associated with multiple traits, suggesting their core regulatory functions. Given that these floral traits are related to the plant mating system (Goodwillie et al. 2006; Lin and Ritland 1997), these findings imply that MADS‐box genes could participate in the evolution or maintenance of reproductive strategies. Reasons for no significant associations detected in T. ciliata var. ciliata or T. ciliata var. pubescens were likely due to the limited sample size and low phenotypic variation. Overall, the strong association between MADS‐box gene expression and floral traits in T. sinensis highlights the potential role of this gene family not only in floral development but also in shaping the mating system in Toona species.
One attention in the preceding discussions is concerned with the functions of the identified MADS‐box genes associated with floral traits. Although Type I errors were strictly controlled (FDR < 5%) in TWAS, experimental verification of these gene functions is important in future studies. Both reviewers suggested future experiments to validate these findings, such as gene knockout and overexpression tests of a few identified MADS‐box genes by qPCR. Thus, separate experimental studies are needed in future studies to test gene functions with T. ciliata and T. sinensis , although some identified genes were tested in other plant species discussed above.
Materials and Methods
4
Data Acquisition
4.1
We collected the genomic data of T. ciliata var. ciliata from our previous study, which is accessible in the CNGB Nucleotide Sequence Archive (Accession number: CNP0001985) (Wang, Xiao, He, Li, Song, et al. 2022). The genomic data of T. sinensis were also retrieved from the CNGB Nucleotide Sequence Archive (Accession number: CNP0000958) (Ji et al. 2021). One reviewer suggested inclusion of closely related species for analysis. Although genome sequences of several species in the Meliaceae family are available, including Azadirachta indica [NCBI SRA 053330] (Krishnan et al. 2012), Xylocarpus granatum (GenBank accession: GCA_019650275.1) and Toona fargesii A. Chev. (Ma et al. 2025), gene annotations (gff files) were not publicly available. These species were not included for MADS‐box gene family analysis. The amino acid sequences of MADS‐box gene family members from A. thaliana (a model plant) were downloaded from the TAIR website (https://www.arabidopsis.org/).
Transcription data (RNA‐seq) were also based on our recent study (Xiao 2025), including 150 samples of mixed flowers that were at the same developmental stages (mainly mature flowers). We collected flower samples from 50 trees of T. ciliata var. ciliata and 50 trees of T. ciliata var. pubescens in Lijiang and Dali cities in Yunnan Province, respectively. One reviewer concerned the fluctuation of gene expression with time. We acknowledged this variation in transcriptomic analysis and collected all flower samples at the same developmental stages within 2 days at each location. Note that the field sampling was challenging since the trees were tall trees (> 20 m) at the reproductive period (more than 10 years old). The grow habitats in the two locations in Yunnan Province are similar, with the annual average temperature of approximately 16°C–19°C, the total annual rainfall of about 800–1100 mm, and the dominant red soil (Cai 2016; Du et al. 2016; Li 2021). Samples of mixed flowers from 50 trees of T. sinensis were collected in the same way in Ziyang and Suining cities, Sichuan Province. The two grow habitats are also similar, with the annual temperature of about 17.5°C and the total annual rainfall of about 900–1100 mm, but diverse soils (dominant tide sand soil in Zijiang and dominant purple soil in Suining) (Huang 2011; Meng 2013). The four localities generally had comparable habitats. The sampled trees were located more than 100 m away from each other to reduce potentially genetic relatedness in natural forests. We identified two varieties of T. ciliata based on leaf morphological characteristics according to previous studies (Chen et al. 1997; Zhang 2018). A sample of mixed mature flowers from each tree was immediately stored at −80°C in a cryogenic refrigerator for RNA extraction.
For each sampled tree, we measured seven floral traits of mature flowers, including the flower opening width (OW), flower length (FL), flower width (FW), stamen length (or filament length, SL), pistil length (or style length, PL), stamen width (or anther length, SW), and pistil width (or stigma width, PW). Thirty mature flowers were randomly collected from each sampled tree to measure floral traits. One hundred and fifty individuals were measured using a digital caliper, with 4500 flowers phenotyped in total. Floral traits from 1500 mature flowers were measured within 3 days in each location. Means of floral traits from 30 flowers of each tree were calculated to represent the tree flower characters (50 individual samples for each taxon) for TWAS.
One hundred and fifty samples were entrusted to Beijing Biomarker Technology Co. Ltd. for RNA‐seq analysis. The technique details for RNA‐seq were provided in (Xiao 2025). Gene expression was measured in terms of FPKM (fragments per kilobase of transcript per million fragments mapped).
Identification and Structure Analysis of the MADS‐Box Genes
4.2
Hidden Markov Model (HMM) files corresponding to two protein domains, SRF‐TF (PF00319) and K‐box (PF01486), of the MADS‐box gene family were downloaded from the PFAM database (http://pfam‐legacy.xfam.org/) (Mistry et al. 2021). Using the HMMER 3.0 software (Potter et al. 2018), we searched for the protein sequences of T. ciliata var. ciliata and T. sinensis with default parameters. The MADS‐box protein sequences from A. thaliana were downloaded from the TAIR website (https://www.arabidopsis.org/), and the obtained sequences were filtered and validated using Blast 2.16.0 (McGinnis and Madden 2004) in combination with the NCBI CDD (Lu et al. 2020). The physicochemical properties of the MADS‐box proteins from T. ciliata var. ciliata and T. sinensis were analyzed using the ExPASy online tool (https://web.expasy.org/protparam/) (Duvaud et al. 2021). Additionally, the subcellular localization of these proteins was predicted using the Cell‐PLoc 2.0 website (http://www.csbio.sjtu.edu.cn/bioinf/Cell‐PLoc/).
The conserved domains of MADS‐box proteins from T. ciliata var. ciliata and T. sinensis were analyzed using the MEME 5.5.7 online tool (http://meme‐suite.org/), setting a limit of 10 conserved motifs (Bailey et al. 2009). Exon and intron information for the MADS‐box genes in T. ciliata var. ciliata and T. sinensis was extracted from the respective genomic GFF files. Conserved protein domains of the MADS‐box gene family members in T. ciliata var. ciliata and T. sinensis were analyzed using the Batch CD Search function on the NCBI website (https://www.ncbi.nlm.nih.gov/Structure/bwrpsb/bwrpsb.cgi). The conserved protein domains and gene structures of the MADS‐box gene family were then visualized using TBtools 2.210 (Chen et al. 2020).
The chromosomal distribution of MADS‐box genes in T. ciliata var. ciliata and T. sinensis was visualized using TBtools 2.210 (Chen et al. 2020), based on the gene location information from the GFF annotation files. Intra‐ and interspecies collinearity analyses of the MADS‐box gene family members from T. ciliata var. ciliata, T. sinensis , and A. thaliana were conducted using the One Step MCScanX–Super Fast tool in the TBtools package.
The upstream sequences of 2000 bp from the transcriptional start site (TSS) of MADS‐box genes in T. ciliata var. ciliata and T. sinensis were extracted using TBtools 2.210 as the promoter regions. Cis‐regulatory elements within these promoter sequences were predicted using the PlantCARE online tool (http://bioinformatics.psb.ugent.be/webtools/plantcare/html/) (Lescot et al. 2002). The results were statistically analyzed, and heatmaps and stacked bar charts were generated to visualize the distribution of these elements.
Using the protein sequences of the MADS‐box gene family in A. thaliana as a reference, protein–protein interaction (PPI) networks among the MADS‐box family members in T. ciliata var. ciliata and T. sinensis were predicted using the STRING 12.0 online database (https://cn.string‐db.org/).
Assessment of the Evolution of the MADS‐Box Gene Family
4.3
Protein sequences of T. ciliata var. ciliata and T. sinensis were aligned with those of A. thaliana using MAFFT 7.490 (Katoh and Standley 2013). The aligned sequences were then trimmed using TrimAl 1.5 with default parameters (Capella‐Gutiérrez et al. 2009). A phylogenetic tree was constructed using the IQ‐TREE 2.0.7 software (https://iqtree.github.io/), with 1000 bootstrap repetitions and automatic thread settings, while other parameters were set as defaults (Bui Quang et al. 2020). The resulting phylogenetic tree file was visualized using the iTOL V4 online tool (https://itol.embl.de/itol.cgi) (Letunic and Bork 2019). Based on the phylogenetic relationships of the MADS‐box proteins, the MADS‐box family members were classified.
The CDS sequences of MADS‐box gene pairs among T. ciliata var. ciliata, T. sinensis , and A. thaliana were prepared and aligned, then converted into axt format. The synonymous substitution rate (Ks) and nonsynonymous substitution rate (Ka) and their ratio (Ka/Ks) were calculated using the YN (Yang‐Nielsen) model with KaKs_calculator 3.0 (Zhang 2022). Density plots were generated using the ggplot2 package in R (Villanueva and Chen 2019), and violin plots were created using GraphPad Prism 8.
Spearman correlation was analyzed using SPSS 22.0 to test the relationship between the evolutionary rate (Ka/Ks) and expression levels of the MADS‐box genes in T. ciliata var. ciliata and T. sinensis . Scatter plots were generated using GraphPad Prism 8 to depict this relationship.
TWAS of the MADS‐Box Genes
4.4
FPKM values for MADS‐box genes were obtained from the RNA‐seq data of 150 samples of mixed flowers of T. ciliata var. ciliata, T. ciliata var. pubescens, and T. sinensis . Heatmaps for the expression of the MADS‐box genes in T. ciliata var. ciliata and T. sinensis were plotted using TBtools 2.210. Pearson's correlation was tested for each floral trait (inner flower width, flower width, flower length, stamen length, stamen width, pistil length, and pistil width) with the expression levels of MADS‐box genes in T. ciliata var. ciliata, T. ciliata var. pubescens, and T. sinensis . The FDR (false discovery rate) of less than 0.05 was set as a significant level.
Author Contributions
Xiao‐Han Liu: conceptualization (equal), methodology (equal), resources (equal), software (lead), visualization (lead), writing – original draft (lead). Yu Xiao: data curation (equal), resources (equal). Yan‐Wen Lv: resources (equal). Zi‐Yun Wang: resources (equal). Chao Wu: resources (equal). Hui Xie: resources (equal). Xin‐Sheng Hu: conceptualization (equal), funding acquisition (lead), writing – review and editing (lead).
Conflicts of Interest
The authors declare no conflicts of interest.
Supporting information
Table S1: Physicochemical properties of MADS‐box proteins in Toona ciliata and Toona sinensis.
Table S2: Pearson's correlations and tests between the expression levels of MADS‐box genes and measurements of seven floral traits: (A) T. ciliata var. ciliata; (B) T. ciliata var. pubescens; (C) T. sinensis .
The reference list from the paper itself. Each links out to its DOI / PubMed record.
- 1Airoldi, C. A. , and B. Davies . 2012. “Gene Duplication and the Evolution of Plant MADS‐Box Transcription Factors.” Journal of Genetics and Genomics 39, no. 4: 157–165.22546537 10.1016/j.jgg.2012.02.008 · doi ↗ · pubmed ↗
- 2Alvarez‐Buylla, E. R. , S. Pelaz , S. J. Liljegren , et al. 2000. “An Ancestral MADS‐Box Gene Duplication Occurred Before the Divergence of Plants and Animals.” Proceedings of the National Academy of Sciences 97, no. 10: 5328–5333.10.1073/pnas.97.10.5328 PMC 2582810805792 · doi ↗ · pubmed ↗
- 3Arora, R. , P. Agarwal , S. Ray , et al. 2007. “MADS‐Box Gene Family in Rice: Genome‐Wide Identification, Organization and Expression Profiling During Reproductive Development and Stress.” BMC Genomics 8: 1–21.17640358 10.1186/1471-2164-8-242PMC 1947970 · doi ↗ · pubmed ↗
- 4Bailey, T. L. , M. Boden , F. A. Buske , et al. 2009. “MEME SUITE: Tools for Motif Discovery and Searching.” Nucleic Acids Research 37, no. suppl_2: W 202–W 208.19458158 10.1093/nar/gkp 335PMC 2703892 · doi ↗ · pubmed ↗
- 5Becker, A. , and G. Theißen . 2003. “The Major Clades of MADS‐Box Genes and Their Role in the Development and Evolution of Flowering Plants.” Molecular Phylogenetics and Evolution 29, no. 3: 464–489.14615187 10.1016/s 1055-7903(03)00207-0 · doi ↗ · pubmed ↗
- 6Bowman, J. L. 1989. “Genes Directing Flower Development in Arabidopsis .” Plant Cell 1, no. 1: 37–52.2535466 10.1105/tpc.1.1.37PMC 159735 · doi ↗ · pubmed ↗
- 7Bui Quang, M. , H. A. Schmidt , C. Olga , et al. 2020. “IQ‐TREE 2: New Models and Efficient Methods for Phylogenetic Inference in the Genomic Era.” Molecular Biology and Evolution 37, no. 5: 1530–1534.32011700 10.1093/molbev/msaa 015PMC 7182206 · doi ↗ · pubmed ↗
- 8Cai, D. Y. 2016. “Study on the Classification and Zoning of Land Consolidation in Lijiang City.” Master's thesis.