Association between the triglyceride–glucose index and left atrial appendage thrombogenic milieu in patients with atrial fibrillation
Hanze Sun, Shuangzheng Hu, Rongrong Pan, Qin Zhuang, Yi Zheng

TL;DR
This study found that a higher triglyceride–glucose index is linked to a higher risk of left atrial appendage thrombogenic milieu in patients with atrial fibrillation.
Contribution
It identifies the triglyceride–glucose index as an independent predictor of left atrial appendage thrombogenic milieu in atrial fibrillation patients.
Findings
The TyG index was significantly higher in patients with LAATM compared to those without.
A TyG index cutoff of 7.01 predicted LAATM with high sensitivity and moderate specificity.
Higher TyG index was an independent predictor of LAATM development in multivariate analysis.
Abstract
The triglyceride–glucose (TyG) index is an independent predictor of atrial fibrillation (AF). The presence of left atrial appendage (LAA) thrombogenic milieu (LAATM) is associated with ischemic stroke in patients with AF. The present study aimed to explore the relationship between the TyG index and LAATM in patients with AF. Patients with nonvalvular AF who were admitted to the Department of Cardiology at Cixi People Hospital Medical Health Group for catheter ablation or LAA closure from April 2018 to January 2024 were retrospectively included. The study population was divided into two groups on the basis of the presence (LAATM group) or absence (non-LAATM group) of LAATM as determined by preprocedural transesophageal echocardiography. The relationship between the TyG index and LAATM was observed. A total of 466 patients with nonvalvular AF who underwent transesophageal…
Genes, proteins, chemicals, diseases, species, mutations and cell lines named across the full text — each resolved to its canonical identifier and authoritative record.
Click any figure to enlarge with its caption.
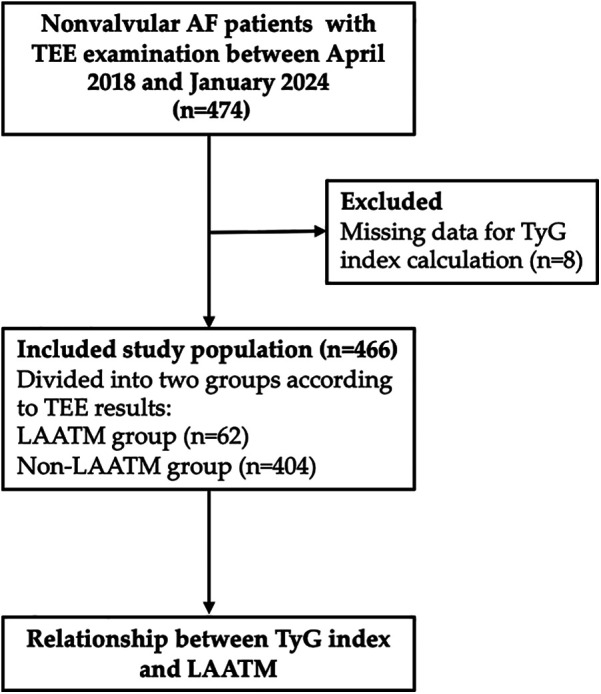 Figure 1
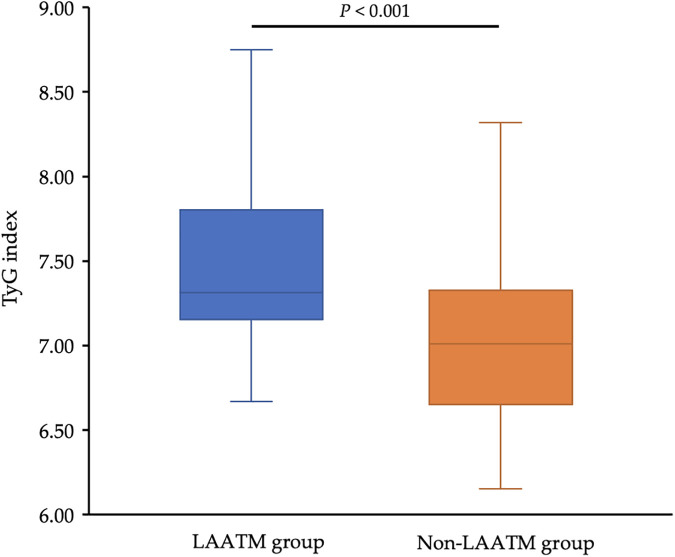 Figure 2
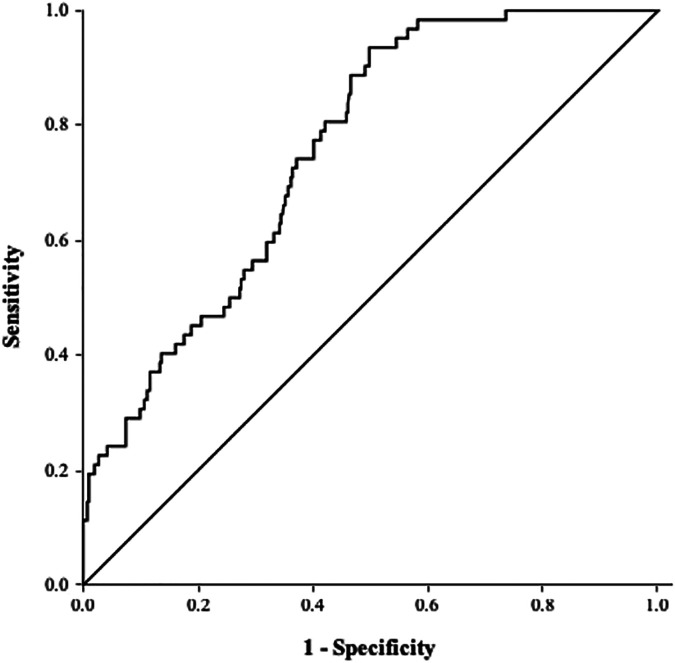 Figure 3
| Variables | Non-LAATM group | LAATM group | |
|---|---|---|---|
| Age, mean ± SD, years | 69.7 ± 8.7 | 68.2 ± 9.9 | 0.212 |
| Male sex, | 261 (64.6) | 40 (64.5) | 0.989 |
| Paroxysmal AF, | 133 (32.9) | 8 (12.9) | 0.005 |
| Body mass index, mean ± SD, kg/m2 | 24.2 ± 3.5 | 24.2 ± 3.7 | 0.969 |
| Low-dose direct oral anticoagulants, | 60 (14.9) | 8 (12.9) | 0.686 |
| Comorbid conditions | |||
| Congestive heart failure, | 54 (13.4) | 9 (14.5) | 0.805 |
| Hypertension, | 256 (63.4) | 44 (71.0) | 0.245 |
| Diabetes, | 37 (9.2) | 5 (8.1) | 0.779 |
| Coronary artery disease, | 35 (8.7) | 7 (11.3) | 0.501 |
| Previous stroke/TIA, | 42 (10.4) | 8 (12.9) | 0.553 |
| Previous bleeding, | 21 (5.2) | 3 (4.8) | 1.000 |
| Clinical scoring point | |||
| CHA2DS2-VASc score, median (IQR), points | 2 (1–3) | 2 (1–3) | 0.456 |
| HAS-BLED score, median (IQR), points | 1 (1–1) | 1 (1–1) | 0.598 |
| Echocardiographic data | |||
| LA diameter, mean ± SD, mm | 44.5 ± 7.4 | 48.0 ± 6.6 | <0.001 |
| LVEF, mean ± SD, % | 62.0 ± 6.6 | 60.9 ± 6.2 | 0.219 |
| Laboratory data | |||
| FPG, mean ± SD, mmol/L | 5.15 ± 1.00 | 5.49 ± 0.63 | <0.001 |
| TC, mean ± SD, mmol/L | 3.69 ± 1.05 | 4.01 ± 1.26 | 0.065 |
| TG median (IQR), mmol/L | 1.35 (1.00–1.74) | 1.87 (1.44–2.99) | <0.001 |
| HDL-C, mean ± SD, mmol/L | 1.15 ± 0.34 | 1.06 ± 0.21 | 0.067 |
| LDL-C, mean ± SD, mmol/L | 2.15 ± 0.76 | 2.36 ± 0.80 | 0.044 |
| TyG index, mean ± SD | 7.04 ± 0.47 | 7.56 ± 0.59 | <0.001 |
| Variables | Univariate model | Multivariate model | ||
|---|---|---|---|---|
| OR (95% CI) | OR (95% CI) | |||
| Age | 0.98 (0.95–1.01) | 0.213 | – | – |
| Male sex | 1.00 (0.57–1.74) | 0.989 | – | – |
| Paroxysmal AF |
|
| ||
| Body mass index | 1.00 (0.93–1.08) | 0.969 | – | – |
| Congestive heart failure | 1.10 (0.51–2.36) | 0.805 | – | – |
| Hypertension | 1.41 (0.79–2.54) | 0.246 | – | – |
| Diabetes | 0.87 (0.33–2.31) | 0.870 | – | – |
| Coronary artery disease | 1.34 (0.57–3.17) | 0.503 | – | – |
| Previous stroke/TIA history | 1.28 (0.57–2.87) | 0.553 | – | – |
| Previous bleeding history | 0.93 (0.27–3.21) | 0.905 | – | – |
| CHA2DS2-VASc score | 0.88 (0.70–1.11) | 0.287 | – | – |
| HAS-BLED score | 1.11 (0.75–1.63) | 0.616 | – | – |
| LA diameter | 1.04 (0.996–1.09) | 0.074 | ||
| LVEF | 0.98 (0.94–1.02) | 0.236 | – | – |
| FPG | 0.81 (0.54–1.20) | 0.285 | ||
| TC | 0.98 (0.46–2.08) | 0.949 | ||
| TG | 0.79 (0.47–1.33) | 0.383 | ||
| HDL-C | 0.78 (0.32–1.93) | 0.593 | ||
| LDL-C | 0.78 (0.27–2.28) | 0.655 | ||
| TyG index |
|
| ||
- —Public Welfare Technology Project of Ningbo Science and Technology Bureau
Peer Reviews
No public reviews on file for this paper yet. If you reviewed it on a platform where reviews are public (OpenReview, ICLR, NeurIPS, ICML), you can paste yours below so the community can read it here.
Videos
No videos yet. Explain this paper in a talk, walkthrough, or lecture? Add one.
Taxonomy
TopicsAtrial Fibrillation Management and Outcomes · Cardiac Arrhythmias and Treatments · Cardiac Imaging and Diagnostics
Introduction
Atrial fibrillation (AF) is the most prevalent type of arrhythmia in the clinic (1, 2). Patients with AF have a greater risk of ischemic stroke (3), and the majority of thrombi form in the left atrial appendage (LAA) (4). Previous investigations have demonstrated that the presence of LAA thrombogenic milieu (LAATM), which includes thrombi, sludge and spontaneous echo contrast (SEC), is significantly associated with stroke in patients with AF (5–7). Some factors that are related to the development of LAATM, including comorbidities, echocardiographic parameters and laboratory biomarkers, have been reported (8–10).
Insulin resistance (IR) has been proven to be associated with AF development and recurrence after catheter ablation (11–14). IR can cause endothelial dysfunction by decreasing nitric oxide production by endothelial cells and increasing the release of procoagulant factors that cause platelet aggregation (15). Therefore, IR may increase the risk of thrombus formation in patients with AF. However, data on the association of IR with LAATM are limited. The triglyceride-glucose (TyG) index, which is assessed on the basis of triglyceride (TG) and fasting plasma glucose (FPG) levels, is now widely used in the assessment of IR (16). In this study, we evaluated the association between the TyG index and LAATM in patients with AF.
Methods
Study population
Patients with nonvalvular AF who were admitted to the Department of Cardiology at Cixi People Hospital Medical Health Group for catheter ablation or LAA closure from April 2018 to January 2024 were retrospectively included. All patients with transesophageal echocardiography (TEE) examination were screened. Patients with missing data for TyG index calculation were excluded. Patients with mechanical valves or moderate-to-severe mitral stenosis, or uncontrolled bleeding diseases, or creatinine clearance (CrCl) < 30 ml/min were also excluded. Demographic data and comorbid conditions, including congestive heart failure, hypertension, diabetes, previous stroke or transient ischemic attack (TIA) and previous bleeding, were collected to evaluate the risk of stroke (CHA_2_DS_2_-VASc score) and bleeding (HAS-BLED score). Fasting blood samples were collected within 24 h of admission. FPG and lipid indices, including total cholesterol (TC), TG, high-density lipoprotein cholesterol (HDL-C) and low-density lipoprotein cholesterol (LDL-C) levels, were measured and recorded. The TyG index was calculated as follows: TyG index = ln [TG (mg/dl) × FPG (mg/dl)/2]. This study was conducted in compliance with the law protecting personal data and in accordance with the guidelines of the Declaration of Helsinki, and it was approved by the Ethics Committee of Cixi People Hospital Medical Health Group (2024-LP-LW001).
Echocardiographic examination
Every patient was treated with direct oral anticoagulants (DOACs) after admission to the hospital. Low-dose DOACs were used in some special subset of patients, such as patients aged ≥ 75 years, weighted < 50 kg, or with CrCl < 50 ml/min (2). Transthoracic echocardiography and TEE were performed within 48 h before the procedure. The left atrial (LA) diameter and left ventricular ejection fraction (LVEF) were measured. Signs of LAATM, including LAA thrombi, sludge, and dense SEC, were detected by transesophageal echocardiography. LAA thrombus was defined as an echodense mass with uniform tissue that was different than that of the LA endocardial wall. SEC was defined as an echogenic, swirling pattern of blood flow observed under the standard gain setting during the cardiac cycle, and it was graded according to the Fatkin classification. SEC grade of 3 or 4 was considered dense. LAA sludge was defined as a dynamic, viscid, layered echo dense finding without a discrete mass. LAA sludge is considered to represent a stage between SEC and thrombus formation (17).
Statistical analysis
The study population was divided into two groups based on the absence (non-LAATM group) or presence (LAATM group) of LAATM. Normally distributed continuous variables are expressed as the mean ± standard deviation (SD) and were compared via the t test, whereas nonnormally distributed variables are expressed as the median [interquartile range (IQR)] and were compared via the Mann–Whitney U test. Categorical variables are expressed as percentages and were compared via the chi-square test or Fisher's exact test where appropriate.
Logistic regression analyses were performed to explore the potential risk factors for LAATM development. A univariate model without adjusted factors was initially performed. The variables with a P value < 0.05 in the univariate model were included in the multivariate logistic regression analysis. Odds ratios (ORs) and 95% confidence intervals (CIs) were calculated. A receiver operating characteristic (ROC) curve was used to assess the ability of the TyG index to predict the development of LAATM. The optimal cutoff value and the area under the curve (AUC) were determined on the basis of Youden's index. All the statistical analyses were performed with SPSS 22.0 (IBM, Armonk, NY, USA), and a P value < 0.05 (2-tailed) was considered statistically significant.
Results
Baseline characteristics
A total of 466 patients with nonvalvular AF who underwent TEE examination were included for analysis after 8 patients excluded due to missing data for TyG index calculation (Figure 1). LAATM was observed in 62 (13.3%) patients (LAATM group). The baseline characteristics of the participants are shown in Table 1. The rate of patients treated with Low-dose DOACs was comparable between LAATM group and non-LAATM group (12.9% vs. 14.9%, P = 0.686). The percentage of patients with paroxysmal AF was greater in the non-LAATM group (32.9% vs. 12.9%, P = 0.005). The comorbid conditions were similar between the groups. The CHA_2_DS_2_-VASc score and HAS-BLED score were comparable between the non-LAATM group and the LAATM group. The LA diameter was greater in the LAATM group (48.0 ± 6.6 mm vs. 44.5 ± 7.4 mm, P < 0.001). The FPG (5.49 ± 0.63 mmol/L vs. 5.15 ± 1.00 mmol/L, P < 0.001) and TG [1.87 (1.44–2.99) mmol/L vs. 1.35 (1.00–1.74), P < 0.001] levels were greater in patients with LAATM.
Study flow chart. A total of 474 nonvalvular AF patients with TEE examination were screened between April 2018 and January 2024. Eight patients were excluded due to missing data for TyG index calculation. Finally, a total of 466 patients were included and further divided into LAATM group (n = 62) and non-LAATM group (n = 404) according to the TEE results. AF, atrial fibrillation; TEE, transesophageal echocardiography; TyG index, triglyceride–glucose index; LAATM, left atrial appendage thrombogenic milieu.
The TyG index and LAATM
The TyG index was higher in patients with LAATM (7.56 ± 0.59 vs. 7.04 ± 0.47, P < 0.001; Table 1 and Figure 2). Univariate logistic regression analysis revealed that paroxysmal AF and increased HDL-C levels were negatively associated with LAATM, whereas an increased LA diameter, higher FPG, TC, TG, and LDL-C levels, and an increased TyG index were positively associated with LAATM development in patients with nonvalvular AF. After multivariate analysis, a higher TyG index was an independent predictor of LAATM development (OR = 12.78, 95% CI 2.95–55.42; P < 0.001). In addition, patients with paroxysmal AF were still at lower risk compared to those with persistent AF (OR = 0.40, 95% CI 0.17–0.94; P = 0.035) (Table 2).
Comparison of the TyG index between the LAATM group and the non-LAATM group. The TyG index was higher in the LAATM group (7.56 ± 0.59; blue bar) compared with non-LAATM group (7.04 ± 0.47; orange bar) (P < 0.001). TyG index, triglyceride–glucose index; LAATM, left atrial appendage thrombogenic milieu.
ROC curve analysis revealed an AUC of 0.76 (95% CI 0.70–0.81, P < 0.001; Figure 3). The optimal cutoff value of the TyG index for predicting LAATM development was 7.01 (sensitivity 93.5%, specificity 50.2%).
ROC curve of the TyG index for predicting LAATM. The area under the curve was 0.76 (95% CI 0.70–0.81, P < 0.001). The optional cutoff value of the TyG index was 7.01 (sensitivity 93.5%, specificity 50.2%). TyG index, triglyceride–glucose index; LAATM, left atrial appendage thrombogenic milieu.
Discussion
To our knowledge, the present study is the first to report the relationship between IR and LAATM development in patients with AF. The results revealed that the TyG index was significantly greater in patients with AF and LAATM. Multivariate logistic regression analysis demonstrated that a higher TyG index was an independent predictor of LAATM development.
In patients with IR, more insulin production is needed to maintain normal blood glucose levels. The hyperinsulinemic-euglycemic clamp (HEC) method is considered the best method, but this technique is rather complicated, less practical, and quite expensive. The TyG index, which is calculated according to two low-cost and common laboratory parameters (TG and FPG levels), is now widely used for assessing IR. Therefore, the TyG index has been considered a surrogate marker of IR. A previous investigation demonstrated that the TyG index was strongly associated with HEC (AUC = 0.858), with a TyG index cutoff of 4.68 having a sensitivity of 96.5% and a specificity of 85% for estimating IR in the adult population (16). Data have shown that a higher TyG index is associated with a greater risk of cardiovascular diseases, including coronary artery disease (18–20) and heart failure (21–23). In most studies, the TyG index was calculated based on TG and FPG levels from a single point-in-time measurement at baseline, regardless of their changes over time, which may lead to potential bias. Recently, Cui et al. showed that the risk of cardiovascular diseases development increased along with the quartile of the cumulative TyG index (24). They also found that the cumulative effect of the TyG index seemed to be independent and better than the TyG index at baseline in predicting cardiovascular diseases. Therefore, evaluating the mean changes in the TyG index in cardiovascular diseases progression and follow-up is warranted in future studies.
AF is the most sustained type of arrhythmia in the clinical setting (1). The TyG index has been reported to be related to AF (11, 12). A retrospective observational study including 356 hospitalized patients revealed that an increased TyG index is an independent risk factor for AF (11). A meta-analysis demonstrated that the TyG index was higher in patients with AF than in their non-AF counterparts (12). Catheter ablation is an effective method for treating AF and maintaining sinus rhythm. Several studies have shown that a higher TyG index is associated with a higher recurrence rate after ablation (14, 25). Wang et al. (24) reported that the TyG index was independently associated with AF recurrence following de novo ablation. Similarly, Tang et al. (14) demonstrated that an elevated preablation TyG index was associated with an increased risk of late AF recurrence after ablation in non-diabetic patients.
AF significantly increases the risk of ischemic stroke (3). The most commonly used scoring system (CHA_2_DS_2_-VASc score) for assessing stroke risk in patients with AF includes diabetes (1). Previous studies have shown that an elevated TyG index is associated with ischemic stroke (26, 27). However, no data on the relationship between the TyG index and ischemic stroke in patients with AF have been reported thus far. The majority of thrombi associated with ischemic stroke originate in the LAA (4). SEC in the LAA is also strongly associated with stroke in patients with AF (5). Some comorbidities (heart failure, chronic kidney disease, previous stroke or TIA), echocardiographic parameters (LA diameter, E/e’, or LAA velocity) and laboratory biomarkers (B-type natriuretic peptide, C-reactive protein, or D-dimer) were shown to be predictors of LAATM development (8–10). Some studies have also shown that patients with diabetes have a greater risk of LAATM development (28, 29). However, no investigation has been performed to explore the association of IR with LAATM. In the present study, we found that a higher TyG index, which is a surrogate marker of IR, was an independent predictor of LAATM development. The ROC analysis indicated that the TyG index exhibited a high sensitivity (93.5%) but low specificity (50.2%), which may result in a substantial number of false positives. LAATM is significantly associated with stroke in patients with AF. As a predictor for LAATM, it should at least have a high sensitivity to screen the patients with potential high risk of LAATM to undergo TEE. Once LAATM was detected, oral anticoagulants could be prescribed to the patients on time to reduce the risk of stroke in the clinical practice.
Some potential mechanisms may explain the relationship between IR and LAATM. First, insulin fails to increase cyclic adenosine monophosphate levels within platelets in patients with IR, thus impairing its antiaggregation effects (30). IR also reduces the sensitivity of platelets to the antiaggregation effects of nitric oxide and prostaglandin I2, which in turn alters calcium influx and promotes platelet aggregation (31). Second, previous studies have reported dysfunctions in intrinsic coagulation that are associated with hyperglycemia and hyperinsulinemia (32, 33). Increased synthesis of coagulant factors (FXII, FXI and FIX) in hepatocytes along with a shorter activated partial thromboplastin time were observed in patients with impaired insulin sensitivity, and these effects are probably mediated by a low-grade inflammatory reaction that is induced by IR (34). Third, inflammation may play a role in the relationship between IR and LAATM. A cross-sectional study revealed an association between the systemic immune-inflammation index and IR (35). Previous studies have demonstrated that there is an apparent link between inflammation and thrombogenesis (36, 37).
There were several limitations of our study. First, this was a single-center, retrospective, observational study which may carry an inherent risk of selection bias. The exact causal relationship between the TyG index and LAATM development is unknown. In addition, the LAATM group comprised a small number of cases. Therefore, the results should be proved by further multicenter prospective studies with large study population. Second, the TyG index was derived from a single point-in-time measurement of TG and FPG levels after hospitalization, which does not account for intra-individual variation or reflect long-term metabolic stability; this may lead to possible bias due to measurement error. Due to the retrospective design, blood sampling and TEE examination were not performed at the same day for some patients. To our knowledge, most previous studies regarding the relationship between laboratory parameters and LAATM also had this limitation. The time interval in the present study was within 24 h in most patients. Therefore, we believe that time interval between blood sampling and TEE examination should not or only slightly affect the relationship between TyG index and LAATM. Third, the study population was limited to AF patients who were candidates for catheter ablation or LAA closure. Therefore, our results cannot be extended to all AF patients. Further investigations should be conducted to prove the findings of the present study in broader AF population.
Conclusion
The TyG index, which is an easily calculated, cost-effective, and valid surrogate marker of IR, was an independent risk factor for LAATM development in patients with AF.
The reference list from the paper itself. Each links out to its DOI / PubMed record.
- 1Joglar JA Chung MK Armbruster AL Benjamin EJ Chyou JY Cronin EM 2023 ACC/AHA/ACCP/HRS guideline for the diagnosis and management of atrial fibrillation. J Am Coll Cardiol. (2024) 83:109–279. 10.1016/j.jacc.2023.08.01738043043 PMC 11104284 · doi ↗ · pubmed ↗
- 2Hindricks G Potpara T Dagres N Arbelo E Bax JJ Blomstrom-Lundqvist C 2020 ESC guidelines for the diagnosis and management of atrial fibrillation developed in collaboration with the European Association for Cardio-Thoracic Surgery (EACTS). Eur Heart J. (2021) 42:373–498. 10.1093/eurheartj/ehaa 61232860505 · doi ↗ · pubmed ↗
- 3Wolf PA Abbott RD Kannel WB. Atrial fibrillation as an independent risk factor for stroke: the Framingham study. Stroke. (1991) 22:983–8. 10.1161/01.str.22.8.9831866765 · doi ↗ · pubmed ↗
- 4Blackshear JL Odell JA. Appendage obliteration to reduce stroke in cardiac surgical patients with atrial fibrillation. Ann Thorac Surg. (1996) 61:755–9. 10.1016/0003-4975(95)00887-X 8572814 · doi ↗ · pubmed ↗
- 5Wang H Xi S Chen J Zhao L Gan T He B. Severe left atrial spontaneous Echo contrast in nonvalvular atrial fibrillation: clinical characteristics and impact on ischemic risk postablation. Thromb Haemost. (2022) 123:522–34. 10.1055/a-1983-051636402133 · doi ↗ · pubmed ↗
- 6Stoddard MF Singh P Dawn B Longaker RA. Left atrial thrombus predicts transient ischemic attack in patients with atrial fibrillation. Am Heart J. (2003) 145:676–82. 10.1067/mhj.2003.9112679765 · doi ↗ · pubmed ↗
- 7Backhaus JF Pflaumbaum A Krogias C Kreimer FMügge A Gold R Short- and long-term outcome of patients with spontaneous echo contrast or thrombus in the left atrial appendage in the era of the direct acting anticoagulants. Clin Res Cardiol. (2021) 110:1811–21. 10.1007/s 00392-021-01926-834436659 PMC 8563546 · doi ↗ · pubmed ↗
- 8Ito T Suwa M. Left atrial spontaneous echo contrast: relationship with clinical and echocardiographic parameters. Echo Res Pract. (2019) 6:R 65–73. 10.1530/ERP-18-008330959476 PMC 6499934 · doi ↗ · pubmed ↗