Factors associated with acute clinically important postoperative nausea and vomiting in high-risk patients undergoing laparoscopic gastrointestinal surgery: a secondary analysis of the FDP-PONV trial
Yabin Huang, Jielin Zheng, Ruirui Gong, Yanwei Li, Jiaxin Han, Zhinan Zheng

TL;DR
This study identifies key factors linked to acute postoperative nausea and vomiting in high-risk patients after gastrointestinal surgery, helping clinicians improve prevention.
Contribution
The study identifies six key factors influencing acute CIPONV in high-risk surgical patients using a logistic regression model.
Findings
Triple prophylactic therapy, higher preoperative fibrinogen, and monocyte count reduce acute CIPONV risk.
Motion sickness history, higher potassium, and quinolone use increase acute CIPONV risk.
A logistic regression model with good discrimination (ROCAUC 0.714) was developed for clinical use.
Abstract
Clinically important postoperative nausea and vomiting (CIPONV) is a highly distressing experience for patients after surgery. CIPONV can occur during the acute phase (0–24 h after surgery) or the delayed phase (25–120 h after surgery), with the acute phase being the primary concern. This study aimed to elucidate the key influencing factors associated with acute CIPONV. This study is based on data from the FDP-PONV trial, which exclusively enrolled patients with 3 or 4 Apfel risk factors. Thus, the findings are specific to this high-risk subgroup. Patients participating in the FDP-PONV trial were all included in this study. Acute CIPONV was defined as the occurrence of postoperative nausea and vomiting (PONV) with a simplified PONV impact scale score of 5 or higher during 0–24 h after surgery. The least absolute shrinkage and selection operator was employed to identify the most…
Genes, proteins, chemicals, diseases, species, mutations and cell lines named across the full text — each resolved to its canonical identifier and authoritative record.
Click any figure to enlarge with its caption.
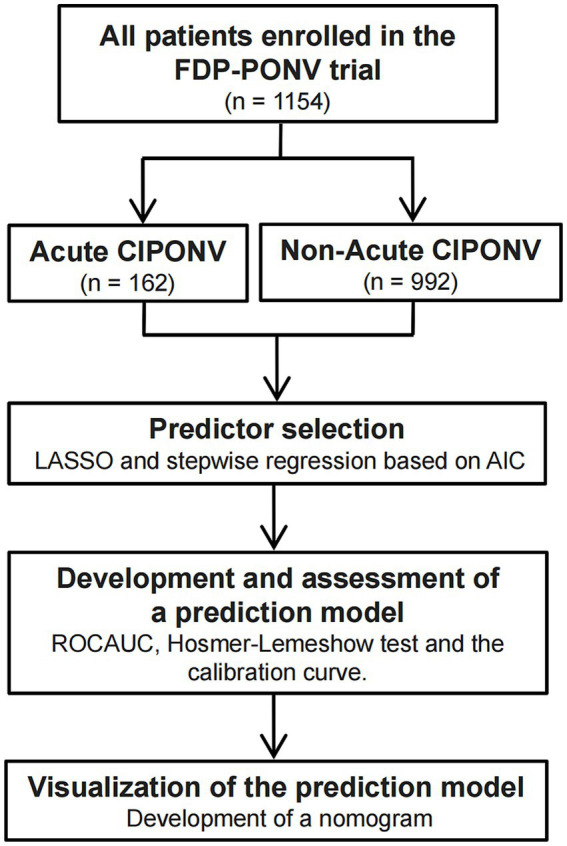 Figure 1
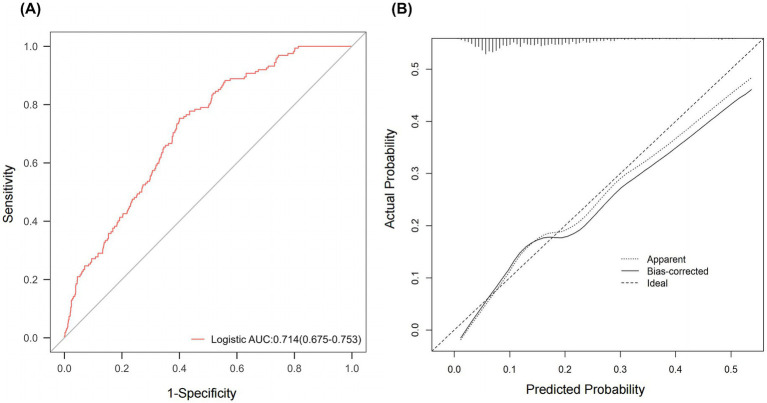 Figure 2
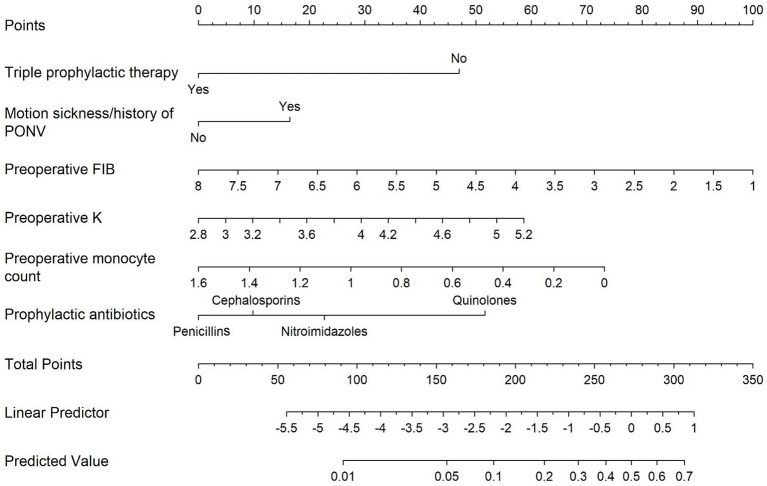 Figure 3
| Variables | Non-Acute CIPONV 992 (86%) | Acute CIPONV n = 162 (14%) | |
|---|---|---|---|
| Baseline characteristics | |||
| Sex | 0.776 | ||
| Male | 35 (3.5%) | 5 (3.1%) | |
| Female | 957 (96.5%) | 157 (96.9%) | |
| Age (year) | 56.00 (48.00, 65.00) | 54.50 (47.00, 63.75) | 0.186 |
| Body mass index (kg m−2) | 22.07 (20.03, 24.34) | 22.04 (19.91, 24.60) | 0.851 |
| Education level | 0.814 | ||
| Low | 632 (63.7%) | 99 (61.1%) | |
| Medium | 181 (18.2%) | 32 (19.8%) | |
| High | 179 (18.0%) | 31 (19.1%) | |
| Smoking | >0.999 | ||
| No | 979 (98.7%) | 160 (98.8%) | |
| Yes | 13 (1.3%) | 2 (1.2%) | |
| Passive smoking | 0.740 | ||
| No | 710 (71.6%) | 118 (72.8%) | |
| Yes | 282 (28.4%) | 44 (27.2%) | |
| Motion sickness and/or history of PONV | 0.017 | ||
| No | 436 (44.0%) | 55 (34.0%) | |
| Yes | 556 (56.0%) | 107 (66.0%) | |
| Apfel score | 0.020 | ||
| 3 | 490 (49.4%) | 64 (39.5%) | |
| 4 | 502 (50.6%) | 98 (60.5%) | |
| Migraine | 0.259 | ||
| No | 887 (89.4%) | 140 (86.4%) | |
| Yes | 105 (10.6%) | 22 (13.6%) | |
| Hypertension | 0.147 | ||
| No | 777 (78.3%) | 135 (83.3%) | |
| Yes | 215 (21.7%) | 27 (16.7%) | |
| Diabetes mellitus | 0.743 | ||
| No | 902 (90.9%) | 146 (90.1%) | |
| Yes | 90 (9.1%) | 16 (9.9%) | |
| ASA physical status | 0.375 | ||
| 1 | 36 (3.6%) | 3 (1.9%) | |
| 2 | 906 (91.3%) | 153 (94.4%) | |
| 3 | 50 (5.0%) | 6 (3.7%) | |
| Preoperative conditions | |||
| Preoperative chemotherapy | 0.237 | ||
| No | 715 (72.1%) | 124 (76.5%) | |
| Yes | 277 (27.9%) | 38 (23.5%) | |
| Number of preoperative chemotherapy cycles | 0.00 (0.00, 2.00) | 0.00 (0.00, 0.00) | 0.388 |
| Preoperative SAS score (standardized) | 31.00 (29.00, 35.00) | 32.00 (29.00, 35.75) | 0.589 |
| APAIS score | 10.00 (6.00, 16.00) | 11.00 (6.00, 18.00) | 0.126 |
| Preoperative sleeping time (hour) | 5 (3, 6) | 5 (3, 6) | 0.751 |
| Preoperative laboratory test | |||
| Fasting blood glucose (mmol L−1) | 4.97 (4.56, 5.55) | 5.00 (4.60, 5.65) | 0.496 |
| Plasma fibrinogen (g L−1) | 3.10 (2.70, 3.50) | 3.00 (2.60, 3.30) | 0.033 |
| Serum albumin (g L−1) | 38.01 (35.85, 40.16) | 38.00 (35.56, 40.44) | 0.898 |
| FAR | 0.08 (0.07, 0.09) | 0.08 (0.07, 0.09) | 0.070 |
| Serum ALT (U L−1) | 14.18 (10.34, 21.90) | 13.46 (11.10, 20.14) | 0.999 |
| Serum AST (U L−1) | 18.44 (15.18, 24.25) | 18.45 (15.59, 23.81) | 0.871 |
| Hemoglobin (g L−1) | 117.00 (103.00, 128.00) | 118.00 (104.00, 126.00) | 0.541 |
| Serum Na (mmol L−1) | 141.03 (139.49, 142.45) | 141.32 (140.05, 142.72) | 0.180 |
| Serum K (mmol L−1) | 3.85 ± 0.34 | 3.93 ± 0.34 | 0.009 |
| Serum Ca (mmol L−1) | 2.25 (2.18, 2.33) | 2.25 (2.18, 2.33) | 0.774 |
| Lymphocyte count (×109 L−1) | 1.61 (1.22, 2.03) | 1.57 (1.25, 2.04) | 0.864 |
| Monocyte count (×109 L−1) | 0.45 (0.37, 0.57) | 0.43 (0.35, 0.52) | 0.017 |
| Neutrophil count (×109 L−1) | 3.37 (2.54, 4.35) | 3.13 (2.48, 4.21) | 0.176 |
| Serum inorganic phosphate (mmol L−1) | 1.23 (1.11, 1.35) | 1.25 (1.14, 1.38) | 0.203 |
| WBC count (×109 L−1) | 5.77 (4.62, 6.93) | 5.37 (4.58, 6.87) | 0.099 |
| RBC count (×109 L−1) | 4.12 (3.72, 4.46) | 4.20 (3.83, 4.50) | 0.083 |
| Platelet count (×109 L−1) | 258.00 (207.00, 321.25) | 260.00 (212.75, 310.75) | 0.924 |
| NLR | 2.01 (1.51, 2.99) | 2.14 (1.48, 2.71) | 0.555 |
| PLR | 162.46 (120.00, 213.58) | 167.37 (128.28, 214.03) | 0.501 |
| Serum creatinine (μmol L−1) | 59.54 (52.97, 67.00) | 59.15 (53.61, 67.13) | 0.964 |
| eGFR [ml (min 1.73m2)−1] | 98.08 (84.52, 112.35) | 96.87 (85.12, 112.53) | 0.961 |
| Intraoperative information | |||
| Triple prophylactic therapy for PONV | <0.001 | ||
| No | 460 (46.4%) | 117 (72.2%) | |
| Yes | 532 (53.6%) | 45 (27.8%) | |
| Types of surgery | 0.230 | ||
| Gastrectomy or small intestinal resection | 124 (12.5%) | 19 (11.7%) | |
| Colon resection | 437 (44.1%) | 85 (52.5%) | |
| Rectum resection | 420 (42.3%) | 56 (34.6%) | |
| Surgery on other site | 11 (1.1%) | 2 (1.2%) | |
| Surgery duration (min) | 184.00 (145.00, 240.25) | 188.00 (141.75, 244.50) | 0.944 |
| Inhaled oxygen concentration during mechanical ventilation (%) | 45.00 (40.00, 50.00) | 45.00 (40.00, 50.00) | 0.866 |
| Intraoperative propofol dosage (mg) | 1368.00 (1,078.75, 1772.50) | 1400.00 (1052.50, 1780.00) | 0.641 |
| Intraoperative remifentanil dosage (ug) | 1500.0 (1100.0, 2000.0) | 1500.0 (1080.0, 2015.0) | 0.668 |
| Intraoperative hydromorphone dosage (mg) | 1.5 (1.2, 1.5) | 1.5 (1.2, 1.5) | 0.318 |
| Intraoperative use of neostigmine | 0.375 | ||
| No | 362 (36.5%) | 65 (40.1%) | |
| Yes | 630 (63.5%) | 97 (59.9%) | |
| Installation of nasogastric tube | 0.003 | ||
| No | 875 (88.2%) | 129 (79.6%) | |
| Yes | 117 (11.8%) | 33 (20.4%) | |
| Intraoperative hypertension | 0.284 | ||
| No | 553 (55.7%) | 83 (51.2%) | |
| Yes | 439 (44.3%) | 79 (48.8%) | |
| Intraoperative hypotension | 0.541 | ||
| No | 643 (64.8%) | 109 (67.3%) | |
| Yes | 349 (35.2%) | 53 (32.7%) | |
| Intravenous infusion fluid volume (mL) | 2,450 (2,250, 2,850) | 2,450 (2,250, 2,950) | 0.820 |
| Blood loss (mL) | 50.00 (30.00, 100.00) | 50.00 (50.00, 100.00) | 0.206 |
| Urine output (mL) | 500.00 (300, 800) | 500 (250, 800) | 0.994 |
| Types of antibiotic prophylaxis | <0.001 | ||
| Cephalosporins | 642 (64.7%) | 94 (58.0%) | |
| Penicillins | 212 (21.4%) | 23 (14.2%) | |
| Nitroimidazoles | 49 (4.9%) | 11 (6.8%) | |
| Quinolones | 89 (9.0%) | 34 (21.0%) | |
| Intraoperative infusion of albumin | 0.912 | ||
| No | 951 (95.9%) | 155 (95.7%) | |
| Yes | 41 (4.1%) | 7 (4.3%) | |
| Intraoperative albumin dosage (g) | 0 (0, 0) | 0 (0, 0) | 0.923 |
| Variables | Coefficient | Lambda. min |
|---|---|---|
| (Intercept) | −2.3032 | 0.011691062 |
| Triple prophylactic therapy for PONV | −0.9208 | |
| ASA physical status II | 0.0450 | |
| Motion sickness and/or history of PONV | 0.2169 | |
| History of hypertension | −0.0014 | |
| APAIS score | 0.0075 | |
| Preoperative plasma fibrinogen level | −0.1859 | |
| Preoperative serum AST level | 0.0034 | |
| Preoperative serum K level | 0.2691 | |
| Preoperative monocyte count | −0.5229 | |
| Preoperative WBC count | −0.0036 | |
| Preoperative RBC count | 0.0310 | |
| Preoperative NLR | −0.0033 | |
| Colon resection | 0.1908 | |
| Installation of a nasogastric tube | 0.2188 | |
| Types of antibiotic prophylaxis | ||
| Penicillins | −0.0164 | |
| Quinolones | 0.7812 |
| Variables | OR | SE | Z-value | 95% CI | |
|---|---|---|---|---|---|
| Triple prophylactic therapy for PONV | <0.001 | ||||
| No | — | — | — | — | |
| Yes | 0.305 | 0.193 | −6.137 | 0.209, 0.446 | <0.001 |
| Motion sickness and/or history of PONV | 0.025 | ||||
| No | — | — | — | — | |
| Yes | 1.515 | 0.185 | 2.248 | 1.055, 2.177 | 0.025 |
| Preoperative plasma fibrinogen level | 0.697* | 0.148 | −2.441 | 0.522, 0.931 | 0.015 |
| Preoperative serum K level | 1.854* | 0.262 | 2.356 | 1.109, 3.100 | 0.018 |
| Preoperative monocyte count | 0.315* | 0.582 | −1.986 | 0.101, 0.985 | 0.047 |
| Types of antibiotic prophylaxis | <0.001 | ||||
| Cephalosporins | — | — | — | — | |
| Penicillins | 0.781 | 0.252 | −0.982 | 0.476, 1.280 | 0.326 |
| Nitroimidazoles | 1.385 | 0.366 | 0.889 | 0.676, 2.840 | 0.374 |
| Quinolones | 2.877 | 0.243 | 4.341 | 1.786, 4.636 | <0.001 |
| Model | Cut off | ROCAUC (95% CI) | ROCAUC | Accuracy (95% CI) | Sensitivity (95% CI) | Specificity (95% CI) | Pos pred value (95% CI) | Neg pred value (95% CI) | HL | HL |
|---|---|---|---|---|---|---|---|---|---|---|
| Logistic | 0.134 | 0.714 (0.675, 0.753) | <0.001 | 0.621 (0.621, 0.622) | 0.753 (0.687, 0.819) | 0.600 (0.569, 0.630) | 0.235 (0.199, 0.272) | 0.937 (0.918, 0.956) | 12.951 | 0.114 |
Peer Reviews
No public reviews on file for this paper yet. If you reviewed it on a platform where reviews are public (OpenReview, ICLR, NeurIPS, ICML), you can paste yours below so the community can read it here.
Videos
No videos yet. Explain this paper in a talk, walkthrough, or lecture? Add one.
Taxonomy
TopicsNausea and vomiting management · Anesthesia and Pain Management · Cardiac, Anesthesia and Surgical Outcomes
Introduction
1
In recent years, there has been a growing emphasis on prioritizing patients in healthcare research and evaluation, leading to increased use of patient-reported outcome (PRO) measures that elevate patients’ voices (1). PRO refers to information provided directly by patients about their health status, symptoms, quality of life, or functional abilities without clinician interpretation (1–3). Clinically important postoperative nausea and vomiting (CIPONV) is a crucial PRO proposed by Myles et al. (4), assessing the impact of postoperative nausea and vomiting (PONV) on measuring nausea severity and vomiting episodes using a PONV impact scale. This research indicates that CIPONV affects about 20% of patients experiencing PONV, posing significant concerns in postoperative care (4). It causes discomfort, delayed recovery, longer stays in the post-anesthesia care unit, and increased healthcare costs (5–9). Patients with CIPONV demonstrate lower quality of recovery and a higher likelihood of adverse outcomes compared to those with milder PONV (4).
Furthermore, PONV can manifest within the first 24 h post-surgery (the acute phase) or between 25 to 120 h post-surgery (the delayed phase) (10). Given the complexities of chemotherapy-induced nausea and vomiting, it is evident that the mechanisms at play during the acute phase may differ significantly from those in the delayed phase (11). Consequently, it is imperative to conduct separate analyses for acute and delayed CIPONV to fully understand the distinct pathophysiological processes involved (12). However, the acute phase has traditionally been the focus of concern, with numerous prior studies designating postoperative nausea and vomiting within the first 24 h as the primary endpoint (13–15). Consistent with this approach, The current study also concentrates exclusively on acute CIPONV.
To manage and prevent CIPONV effectively, it is essential to identify the contributing factors. The Apfel score, a prevalent tool for gauging susceptibility to PONV, includes four risk factors: female gender, non-smoking status, a history of PONV or motion sickness, and postoperative opioid use (16). While useful, the Apfel score was developed in 1999 when prophylactic treatments were not standard. Its predictive accuracy, with an area under the receiver operating characteristic curve (ROCAUC) of approximately 0.68, is somewhat limited (17). Factors influencing CIPONV remain poorly defined and require further investigation.
Therefore, the objective of this study was to conduct an analysis of the influencing factors and to develop a predictive model for acute CIPONV, taking into account preoperative conditions and intraoperative data from patients undergoing laparoscopic gastrointestinal surgery. This analysis focuses on patients with 3 or 4 Apfel risk factors from the FDP-PONV trial, aiming to identify determinants of acute CIPONV in this high-risk cohort.
Materials and methods
2
Study cohort
2.1
The study protocol was approved by the Ethics Committee of the Sixth Affiliated Hospital of Sun Yat-sen University (2024ZSLYEC-201, Chairperson Prof Lin Yao) on April 22, 2024. Given that the study’s retrospective nature relied on existing anonymous data and posed minimal risk to participants, informed consent was formally waived.
This study was a secondary analysis of the data collected in the FDP-PONV trial. The FDP-PONV trial was a randomized, controlled, double-blind clinical study conducted at the Sixth Affiliated Hospital of Sun Yat-sen University from April 2021 to October 2022. The trial was a randomized, double-blind, placebo-controlled study evaluating the efficacy of triple antiemetic prophylaxis (fosaprepitant + dexamethasone + palonosetron) vs. dual prophylaxis (placebo + dexamethasone + palonosetron) (18). This study analyzing the influencing factors for acute CIPONV was conducted from May 30, 2024, to June 15, 2024. The inclusion and exclusion criteria were clearly defined in the published article and represented here. In brief, inclusive criteria were as follows: (a) aged 18–75 years, (b) 3 or 4 Apfel risk factors and (c) scheduled for laparoscopic gastrointestinal surgical procedures under general anesthesia. Exclusion criteria were as follows: (a) American Society of anesthesiologists (ASA) physical status > 3, (b) severe hepatic dysfunction, (c) contraindications to fosaprepitant, 5-HT3 receptor antagonist or dexamethasone, (d) preoperative use of medications with known antiemetic properties, (e) mental disorders or inability to communicate and (f) pregnant women or nursing mothers. All patients participating in the FDP-PONV trial were eligible for this retrospective study, with no further exclusions made to minimize selection bias.
Preoperative medication and anesthetic management
2.2
Before the initiation of anesthesia, participants underwent a 30-min intravenous infusion of either fosaprepitant or a placebo solution. During anesthesia induction, all participants received intravenous dexamethasone 5 mg and palonosetron 0.075 mg.
During the administration of general anesthesia, the participants’ vital signs and depth of anesthesia were continuously monitored through electrocardiography, pulse oximetry, capnography, blood pressure measurements, and bispectral index monitoring. The anesthesia was induced and sustained using a method known as total intravenous anesthesia. This involved the controlled infusion of propofol (2–6 μg/mL, Schnider model) and remifentanil (2–6 ng/mL, Minto model) to targeted effect-site concentrations. The adjustment of these concentrations was based on real-time monitoring of the bispectral index and blood pressure. Additionally, muscle relaxation was ensured throughout the procedure with the use of cisatracurium to maintain optimal conditions for anesthesia administration. Upon the conclusion of the surgical procedure, the participants underwent a localized infiltration at the surgical site with 0.5% ropivacaine. The reversal of neuromuscular blockade with neostigmine was determined by the attending anesthesiologist based on clinical assessment of neuromuscular recovery and patient-specific factors. Subsequently, an intravenous patient-controlled analgesia pump, which included hydromorphone, was connected to provide postoperative pain management.
Variables’ definitions
2.3
Fifty-five commonly used perioperative clinical features, including baseline characteristics, preoperative conditions, and intraoperative information, were identified as potential predictive factors. These features were collected through an electronic medical record system and case report forms from the FDP-PONV trial. Baseline characteristics and preoperative conditions included age, gender, medical history, ASA physical status classification, the status of anxiety, preoperative laboratory findings, and additional factors. Among these factors, the education level was categorized into three groups: no education or primary school only (low), secondary school (medium), and professional education or university (high) (19). Preoperative sleeping time denoted the total duration of sleep on the night before the surgery. The Fibrinogen Albumin Ratio (FAR) was calculated as plasma fibrinogen concentration (g/L) divided by serum albumin concentration (g/L) (20). Neutrophil-to-Lymphocyte Ratio (NLR) was determined by dividing neutrophil count by lymphocyte count, and Platelet-to-Lymphocyte Ratio (PLR) was calculated by dividing platelet count by lymphocyte count (21). The estimated glomerular filtration rate (eGFR) was derived using the Modification of Diet in Renal Disease (MDRD) equation (22):
Intraoperative information included information such as types of surgery, duration of surgery, concentration of oxygen inhalation during mechanical ventilation, intraoperative anesthetic and analgesic drug dosage, intraoperative use of neostigmine, installation of nasogastric tube, intraoperative hypertension and hypotension, intraoperative fluid balance, types of antibiotic prophylaxis, intraoperative infusion of albumin and the dosage. The duration of pneumoperitoneum referred to the total time of pneumoperitoneum during surgery. Intraoperative hypertension was defined as a mean arterial pressure > 110 mmHg for at least 1 min, while intraoperative hypotension was defined as a mean arterial pressure < 65 mmHg for at least 1 min (18).
Outcome
2.4
All patients were classified into either the acute CIPONV group or the non-acute CIPONV group. The simplified PONV impact scale was used to define CIPONV. In the simplified PONV impact scale, nausea intensity or impact was quantified using an ordinal score from 0 to 3, where 0 represents no nausea and 3 represents severe nausea. Vomiting intensity was quantified by the number of vomiting episodes, scored as 0–2 vomits, or 3 if there were three or more vomits. The nausea score and vomiting score were added together to obtain a simplified PONV impact scale score. CIPONV was defined as the occurrence of PONV with the simplified PONV impact scale score of 5 or more (4). The acute phase was defined as the period from 0 to 24 h after surgery, with the starting point specified as the end of surgery.
Statistical analysis
2.5
The sample size for a predictive model was calculated using the website https://mvansmeden.shinyapps.io/BeyondEPV/. By setting the number of candidate predictors to 6, the events fraction to 0.14, and the criterion value for rMPSE to 0.03, we determined that a minimum total sample size of 1,080 is required, with a minimally expected event per variable of 25.1 (23).
As the data completeness was 100% for the incidence of PONV within the first 24 h after surgery in the FDP-PONV trial, there was no missing data in this study. Continuous variables following a normal distribution with equal variance were presented as the mean ± standard deviation, with between-group comparisons conducted using the Two Sample t-test. Non-normally distributed continuous variables, variables lacking equal variances, and ranked variables were described using the median (interquartile ranges), with between-group comparisons performed using the Mann–Whitney U test. Categorical variables were depicted using numbers (percentage), and between-group comparisons were carried out using the Pearson Chi-square test or Fisher’s exact test.
In the quest to uncover potential predictive factors associated with CIPONV, we employed the least absolute shrinkage and selection operator (LASSO) to sift through clinically significant variables. Subsequently, stepwise regression was utilized based on the Akaike Information Criterion (AIC) to further refine the selection of the ultimate predictors. We performed 1,000 bootstrap resamples using Bias-Corrected and Accelerated (BCa) confidence intervals to estimate the stability of the results.
Finally, a logistic regression model was developed using the selected factors associated with CIPONV. Model discrimination was assessed via the area under the receiver operating characteristic curve (ROCAUC), while goodness-of-fit was evaluated using the Hosmer-Lemeshow test and calibration plots. To assess the stability of the ROCAUC, 1,000 bootstrap resamples were performed. A nomogram based on the logistic regression model output was developed as a tool for clinical application.
All statistical tests were two-sided, with significance denoted by p < 0.05. All analyses were performed using R version 4.2.2. The imputation process was conducted using the “mice” package (version 3.16.0). LASSO was performed using the glmnet package (version 4.1.7). The ROCAUC were produced using the pROC package (version 1.18.5). The nomogram production were conducted using the rms package (version 6.7.1).
Results
3
Population clinical characteristics
3.1
Figure 1 illustrated the enrollment of all 1,154 patients in the FDP-PONV trial, with no further exclusions. Among them, 162 patients (14.04%) experienced acute CIPONV. A comparison of baseline characteristics and exposure between patients with acute CIPONV and those with non-acute CIPONV is presented in Table 1.
A flow diagram of the study design. CIPONV, clinically important PONV; PONV: postoperative nausea and vomiting; LASSO, least absolute shrinkage and selection operator; AIC, Akaike Information Criterion; ROCAUC, area under the receiver operating characteristic curve.
Screening of predictive variables
3.2
The LASSO regression was employed to identify the most relevant variables among an initial set of 55 candidate variables. Using the optimal lambda value (λ = 0.011691062), the model shrank coefficients of non-informative variables to zero, retaining 16 potential predictive factors with non-zero coefficients (Table 2; Supplementary Figure 1). These 16 variables were then subjected to stepwise regression based on the AIC. Six variables ultimately stood out as independent predictors for acute CIPONV. As shown in Table 3, triple prophylactic therapy for PONV, preoperative plasma fibrinogen level, and preoperative monocyte count were protective factors for acute CIPONV; meanwhile, motion sickness and/or history of PONV, preoperative serum potassium level, and quinolone antibiotic prophylaxis were associated with an increased risk of acute CIPONV. The stability of predictors for acute CIPONV (1,000 bootstrap resamples) is presented in Supplementary Table 1.
Development of a logistic regression model
3.3
Based on the identified independent influencing factors, a logistic regression model was formulated based on the factors affecting acute CIPONV in patients undergoing laparoscopic gastrointestinal surgery. This model showed an ROCAUC of 0.714 (95% confidence interval, 0.675–0.753, Figure 2A) and an accuracy of 0.621 (95% confidence interval, 0.621–0.622, Table 4). To validate the stability of the ROCAUC, 1,000 bootstrap resamples were performed, which confirmed consistent discriminative performance with a mean ROCAUC of 0.714 (95% bias-corrected and accelerated confidence interval, 0.649–0.739). The Hosmer-Lemeshow test was not statistically significant, indicating the model fits the data well (Table 4). Subsequently, calibration curve analyses were conducted and illustrated a close alignment between the predicted and actual probabilities of occurrence (Figure 2B).
Assessment of the logistic regression prediction model. (A) ROC curve. (B) Calibration curves. ROC, receiver operating characteristic; AUC, area under the ROC curve; Logistic, logistic regression.
In order to make the logistic regression model more applicable in clinical situations, a nomogram was developed to aid its practical implementation (Figure 3). The resulting nomogram serves as a visual tool for estimating the likelihood of acute CIPONV based on the aforementioned factors.
Nomogram for the prediction of acute CIPONV. Each variable axis represents a single node value, and a line is drawn upwards to indicate the corresponding number of points. These numbers are then added up and positioned on the total point axis. Subsequently, a line is drawn downwards to assess the risk of acute CIPONV. CIPONV, clinically important PONV; PONV, postoperative nausea and vomiting; Triple prophylactic therapy, triple prophylactic therapy for PONV; Motion sickness/history of PONV, motion sickness and/or history of PONV; Preoperative FIB, preoperative plasma fibrinogen level; Preoperative K, preoperative serum potassium level.
Discussion
4
The present study identified six key independent factors influencing acute CIPONV in high-risk patients undergoing laparoscopic gastrointestinal surgery—including triple antiemetic prophylaxis, preoperative plasma fibrinogen level, monocyte count, motion sickness/PONV history, serum potassium level, and quinolone use—and developed a predictive model to assess their risk. These findings optimize prophylactic strategies for this specific population (e.g., individualized antibiotic selection and perioperative electrolyte management) and reveal correlations between blood factors (fibrinogen, monocytes, potassium) and CIPONV, providing insights for translational research into PONV pathogenesis and targeted prophylaxis.
PONV is a highly prevalent surgical complication, affecting 30–80% of patients depending on risk factors (16). However, not all PONV episodes are equally impactful from the patient’s perspective. PROs are critical in modern healthcare, ensuring that patient experiences are central to treatment evaluation and intervention design. Among PONV-related PROs, CIPONV is particularly significant, as it quantifies the severity of nausea and vomiting and their functional impact on patients’ daily lives using validated scales (4).
Our analysis identified six predictors of acute CIPONV. When compared with traditional PONV assessment systems, such as the Apfel score and Koivuranta score (16, 24), motion sickness and/or prior PONV history emerged as overlapping risk factors, suggesting shared underlying mechanisms—likely including genetic predispositions that enhance susceptibility to both conditions (25). Notably, the Koivuranta score identifies longer surgical duration as a PONV risk factor, a relationship often attributed to the dose-dependent emetogenic effects of anesthetic agents (26). In contrast, surgical duration and anesthetic factors were not selected as predictors of acute CIPONV in our study. This discrepancy may be explained by the broader physiological perturbations induced by surgical stress, which disrupts the release of inflammatory cytokines (e.g., IFN-γ, interleukins 6 and 8) implicated in PONV pathogenesis (27–29).
Female gender and non-smoking status are well-established PONV risk factors in traditional models (16). However, due to the inclusion criteria of the FDP-PONV trial (requiring 3–4 Apfel risk factors), our cohort exhibited a marked predominance of female patients (96.5%) and non-smokers (98.7%), which limited our ability to detect these factors as significant predictors of acute CIPONV. Future research should expand the sample to include more diverse gender and smoking status distributions to comprehensively validate these established risk factors.
Beyond traditional models, this study found several novel predictors: triple prophylactic therapy for PONV, quinolone-based antibiotic prophylaxis, and preoperative blood markers (plasma fibrinogen level, monocyte count, serum potassium level). These factors were not included in the Apfel or Koivuranta scores, indicating that integrating biochemical and surgery-specific variables could enhance the accuracy of CIPONV prediction.
One of the key revelations from this study was the effectiveness of a multimodal prophylactic approach. All participants in this study had an Apfel score of 3–4, and the antiemetic regimen was designed to evaluate triple vs. dual prophylaxis. This design aligned with previous studies that advocate for multimodal antiemetic strategies to improve patient outcomes (30, 31); consistent with this, our analysis identified triple prophylaxis as an independent protective factor for acute CIPONV. For patients who develop acute CIPONV despite prophylactic measures, management should prioritize evidence-based rescue strategies. Key principles include selecting antiemetic agents from pharmacological classes distinct from those used in prophylaxis, such as butyrophenones and benzodiazepines, among others. Future research could explore additional regimens based on triple prophylaxis, for instance, the inclusion of olanzapine.
Fluoroquinolones are generally not considered preferred agents for perioperative prophylaxis in gastrointestinal surgery due to concerns about rising bacterial resistance and potential adverse effects. In our cohort, fluoroquinolones accounted for 10.7% of prophylactic regimens. Notably, among patients who developed CIPONV, 21% had received fluoroquinolones. Although fluoroquinolones are not commonly used in clinical practice, their potential impact on CIPONV cannot be ignored, so we still included them in the variable analysis. Among the four perioperative antibiotic types evaluated (cephalosporins, penicillins, nitroimidazoles, quinolones), multivariate logistic regression showed that quinolones were independently linked to a 2.88-fold increased risk of acute CIPONV. This specificity may stem from quinolones’ unique mechanisms, including gut microbiota disruption, intestinal inflammatory responses, and reduced short-chain fatty acids, which collectively enhance emetogenic susceptibility (32–35). To address potential confounding by infection risk, we included preoperative white blood cell count as a surrogate for baseline inflammatory status. Additionally, our focus on preoperative/intraoperative factors aligns with the acute CIPONV timeline (0–24 h post-surgery), preceding most postoperative infections. However, residual confounding cannot be fully excluded, and future studies should incorporate detailed infection risk stratification (e.g., intraoperative cultures, surgical site infection criteria) to validate this association.
Preoperative blood markers also provided critical insights. Fibrinogen, an acute-phase reactant, has been shown to be elevated in inflammatory states (e.g., acute appendicitis, inflammatory bowel disease) (36, 37). The inverse association between preoperative fibrinogen levels and CIPONV risk, while statistically significant, requires cautious interpretation. Fibrinogen’s role in inflammation and hemostasis suggests potential links to PONV pathophysiology, but direct biological mechanisms remain unclear and warrant further investigation.
Notably, this study is the first to report a statistical association between higher preoperative monocyte counts and reduced acute CIPONV risk. While this finding is novel, its biological basis remains speculative. Monocytes may contribute to immune regulation or gut mucosal homeostasis (38–40), but further preclinical and translational studies are required to validate potential mechanisms.
Preoperative serum potassium level was identified as an independent risk factor for acute CIPONV, with mildly elevated potassium levels within the normal physiological range associated with increased risk, a finding that breaks the traditional perception that “normal range equals safety”: conventional clinical practice focuses only on whether serum potassium is outside the normal range (typically 3.5–5.5 mmol/L), whereas this study suggests that subclinical fluctuations within the normal range may be associated with CIPONV risk, which is particularly important for high-risk populations such as those undergoing laparoscopic gastrointestinal surgery, indicating that preoperative electrolyte assessment needs to be more refined rather than merely satisfying “within the normal range”; serum potassium, a key ion for maintaining cell membrane potential, showed that preoperative hyperkalemia correlated with increased CIPONV risk, consistent with prior reports of electrolyte imbalance-related gastrointestinal dysfunction (41–43), and the mild increase in extracellular potassium concentration may align with the mechanism reported in the literature regarding “hyperkalemia”; however, as an observational study, this study did not verify the causal relationship between potassium ions and CIPONV through animal models or cellular experiments, with mechanistic explanations still relying on inferences based on existing physiological knowledge.
Collectively, these biomarkers illustrate systemic inflammation and metabolic perturbations that modulate susceptibility to CIPONV.
A logistic regression model incorporating these predictors demonstrated moderate discriminative ability (ROCAUC: 0.714), comparable to the Apfel score (ROCAUC: 0.68) and within the 0.60–0.80 range reported for PONV models (14, 15, 17, 44, 45). This performance is reasonable given the multifactorial nature of PONV, where biological heterogeneity (e.g., genetic predispositions, inflammatory responses) and overlapping pathophysiological mechanisms inherently limit model accuracy. Notably, Shim et al. who developed a machine learning model for PONV prediction in patients with intravenous patient-controlled analgesia, reported an ROCAUC of ~0.70, further supporting that our results align with contemporary standards in the field (15). Beyond discriminative ability, the model exhibited good calibration, with a non-significant Hosmer-Lemeshow test and close alignment between predicted and observed probabilities in calibration plots, ensuring reliable risk estimation in clinical practice. To facilitate clinical use, a nomogram was developed: clinicians can input patient-specific data (e.g., antibiotic type, fibrinogen level) to calculate individual risk scores, guiding targeted prophylaxis.
This study has several limitations. First, the cohort was derived from the FDP-PONV trial, which strictly included patients with 3 or 4 Apfel risk factors, resulting in extreme demographics (96.5% female, 98.7% non-smokers). Consequently, the model is validated only for this high-risk subgroup and may not generalize to the broader surgical population. Second, the single-center design limits external validity, necessitating multicenter validation in future studies that should also expand sample sizes, include diverse surgical populations, and design mechanistic experiments to validate these associations. Third, the current study relied solely on the simplified PONV impact scale to define CIPONV, which, while validated for quantifying patient-reported symptom severity, remains a subjective measure. Objective clinical outcomes such as rescue antiemetic usage, unplanned hospital readmissions, or post-anesthesia care unit length of stay were not systematically collected in the original FDP-PONV trial design. Integrating such objective metrics in future studies would strengthen the clinical relevance of CIPONV by bridging subjective symptom burden with tangible healthcare resource utilization or intervention requirements.
Six factors were identified as key influences on acute CIPONV in high-risk patients undergoing laparoscopic gastrointestinal surgery. These findings provide both a foundation for optimizing prophylactic strategies in this specific population and a robust basis for translational studies to advance PONV risk stratification and targeted prophylaxis, though further validation in diverse surgical cohorts is required.
The reference list from the paper itself. Each links out to its DOI / PubMed record.
- 1Weldring T Smith SM. Patient-reported outcomes (PR Os) and patient-reported outcome measures (PRO Ms). Health Serv Insights. (2013) 6:61–8. doi: 10.4137/HSI.S 11093, PMID: 25114561 PMC 4089835 · doi ↗ · pubmed ↗
- 2Black N. Patient reported outcome measures could help transform healthcare. BMJ. (2013) 346:f 167. doi: 10.1136/bmj.f 167, PMID: 23358487 · doi ↗ · pubmed ↗
- 3Aiyegbusi OLA Rivera SCR Roydhouse J Kamudoni P Alder Y Anderson N. Recommendations to address respondent burden associated with patient-reported outcome assessment. Nat Med. (2024) 30:650–9. doi: 10.1038/s 41591-024-02827-938424214 · doi ↗ · pubmed ↗
- 4Myles PS Wengritzky R. Simplified postoperative nausea and vomiting impact scale for audit and post-discharge review. Br J Anaesth. (2012) 108:423–9. doi: 10.1093/bja/aer 505, PMID: 22290456 · doi ↗ · pubmed ↗
- 5Eberhart LHJ Mauch M Morin AM Wulf H Geldner G. Impact of a multimodal anti-emetic prophylaxis on patient satisfaction in high-risk patients for postoperative nausea and vomiting. Anaesthesia. (2002) 57:1022–7. doi: 10.1046/j.1365-2044.2002.02822.x, PMID: 12358962 · doi ↗ · pubmed ↗
- 6Myles PS Williams DL Hendrata M Anderson H Weeks AM. Patient satisfaction after anaesthesia and surgery: results of a prospective survey of 10,811 patients. Br J Anaesth. (2000) 84:6–10. doi: 10.1093/oxfordjournals.bja.a 013383, PMID: 10740539 · doi ↗ · pubmed ↗
- 7Shaikh SI Nagarekha D Hegade G Marutheesh M. Postoperative nausea and vomiting: a simple yet complex problem. Anesth Essays Res. (2016) 10:388–96. doi: 10.4103/0259-1162.179310, PMID: 27746521 PMC 5062207 · doi ↗ · pubmed ↗
- 8Habib AS Chen YT Taguchi A Hu XH Gan TJ. Postoperative nausea and vomiting following inpatient surgeries in a teaching hospital: a retrospective database analysis. Curr Med Res Opin. (2006) 22:1093–9. doi: 10.1185/030079906 X 104830, PMID: 16846542 · doi ↗ · pubmed ↗