Normalization of the percentage of signal recovery derived from dynamic susceptibility contrast perfusion MRI in brain tumors
Francesco Sanvito, Jingwen Yao, Nicholas S. Cho, Donatello Telesca, Noriko Salamon, Timothy F. Cloughesy, Benjamin M. Ellingson

TL;DR
This paper proposes a normalization method for signal recovery metrics in brain tumor MRI scans to improve consistency across patients and studies.
Contribution
The novel contribution is the use of logarithmic normalization with normal-appearing white matter to reduce variability in PSR values.
Findings
Logarithmic normalization using NAWM reduced inter-patient variability in PSR values.
nPSRln outperformed no normalization and linear normalization in maintaining consistency under varied acquisition parameters.
The method improves comparability of PSR values across different studies.
Abstract
The universalizability of the metric percentage of signal recovery (PSR) derived from dynamic susceptibility contrast (DSC) perfusion MRI is limited by its dependency of acquisition parameters. In this technical assessment, we tested different reference tissues for PSR normalization and found the normal-appearing white matter (NAWM) to have the least inter-patient variability when using a fixed PSR-optimized protocol. A logarithmic normalization using NAWM improved the consistency of PSR values when a cohort of brain tumor patients was analyzed by synthetically changing acquisition parameters (while keeping the protocol uniform within the cohort). Additionally, the NAWM logarithmic normalization was better than no normalization and linear normalization at maintaining the consistency of both values and ranks within the cohort while a synthetic random variation of the acquisition…
Genes, proteins, chemicals, diseases, species, mutations and cell lines named across the full text — each resolved to its canonical identifier and authoritative record.
Click any figure to enlarge with its caption.
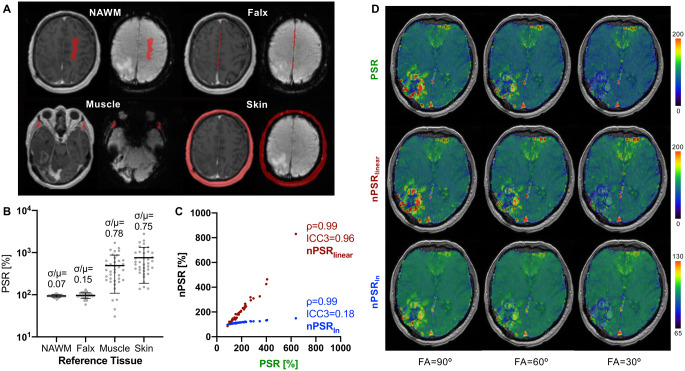 Figure 1
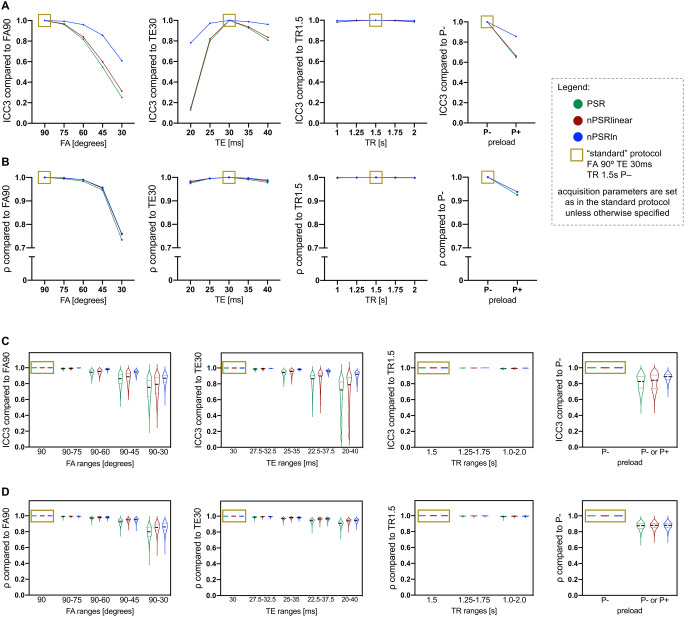 Figure 2
- —http://dx.doi.org/10.13039/100000005U.S. Department of Defense
- —http://dx.doi.org/10.13039/100000009Foundation for the National Institutes of Health
Peer Reviews
No public reviews on file for this paper yet. If you reviewed it on a platform where reviews are public (OpenReview, ICLR, NeurIPS, ICML), you can paste yours below so the community can read it here.
Videos
No videos yet. Explain this paper in a talk, walkthrough, or lecture? Add one.
Taxonomy
TopicsAdvanced MRI Techniques and Applications · MRI in cancer diagnosis · Advanced Neuroimaging Techniques and Applications
Introduction
The percentage of signal recovery (PSR) is a metric derived from dynamic susceptibility contrast (DSC) perfusion MRI that can be useful for differential diagnosis [1, 2, 3], molecular profiling [4], and treatment response assessment [5, 6] in brain tumors. However, the universalizability of PSR values is limited by their dependency on acquisition parameters [7, 8]. Normalizing the values of other MRI biomarkers, such as perfusion and diffusion metrics, using reference tissues is a well-established practice to limit the impact of acquisition heterogeneity [9]. In this study, we propose to normalize brain tumor PSR values using the PSR value of a reference tissue. We hypothesize that this will improve the consistency of PSR ranks and values across different protocols, and within cohorts with heterogenous protocols.
Methods
Patient cohort and image analysis
For this technical assessment, new analyses were performed on a previously reported cohort of 38 newly-diagnosed and recurrent contrast-enhancing gliomas [8]. Perfusion imaging was performed with dynamic spin-and-gradient echo-planar imaging (dynamic SAGE-EPI) and the two gradient echoes were used to generate multiple synthetic DSC datasets with desired synthetic acquisition parameters, as previously shown [8]. Synthetic DSC can compute DSC acquisitions with any desired combination of pulse sequence parameters and/or simulated preload administration [8]. Tumor segmentations including the contrast-enhancing tumor tissue were obtained using T_1_-subtraction maps [10], and then registered to the perfusion space.
Four reference tissue regions of interest (ROI’s) were evaluated: contralateral normal-appearing white matter (NAWM), cerebral falx, masticatory muscles, extracranial skin. The NAWM ROI (at least 2 cc) was drawn in the centrum semiovale according to a previously described “planar” method [9]. The cerebral falx ROI (at least 0.5 cc) included voxels appearing as contrast-enhancing and T_2_-hypointense, not including vascular structures, drawn on two adjacent axial slices. The masticatory muscles ROI (at least 1 cc) was drawn on three adjacent slices bilaterally, excluding fat tissue, bone, and EPI susceptibility artifacts (e.g., areas of artifactual low T_2_ signal due to air-tissue interfaces). The extracranial skin ROI was obtained on a single slice, with a semi-automated method: the background voxels outside the skull were excluded via intensity thresholding, and the intracranial voxels were excluded by subtracting a brain mask obtained with automated skull stripping (fsl bet). All ROI’s were manually drawn by an expert neuroradiologist (reader 1, FS), using the pre-bolus baseline of dynamic SAGE-EPI and the post-contrast T_1_w registered to the perfusion space. The reader was blinded to the perfusion time-intensity curves to avoid any bias. Since PSR values bear a non-linear relation to some pulse sequence parameters [8], normalized PSR (nPSR) was generated not only with a linear (nPSR_linear_), but also with a logarithmic normalization (nPSR_ln_) that may adjust for this non-linear relationship when comparing protocols with heterogeneous pulse sequence parameters. nPSR_linear_ and nPSR_ln_ were calculated as follows:
\documentclass[12pt]{minimal} \usepackage{amsmath} \usepackage{wasysym} \usepackage{amsfonts} \usepackage{amssymb} \usepackage{amsbsy} \usepackage{mathrsfs} \usepackage{upgreek} \setlength{\oddsidemargin}{-69pt} \begin{document}$$\:{nPSR}_{linear}=\:\frac{{PSR}_{tumor}}{{PSR}_{reference}}\times\:100\%$$\end{document} \documentclass[12pt]{minimal} \usepackage{amsmath} \usepackage{wasysym} \usepackage{amsfonts} \usepackage{amssymb} \usepackage{amsbsy} \usepackage{mathrsfs} \usepackage{upgreek} \setlength{\oddsidemargin}{-69pt} \begin{document}$$\:{nPSR}_{ln}=\:\frac{\text{l}\text{n}\left({PSR}_{tumor}\right)}{\text{l}\text{n}\left({PSR}_{reference}\right)}\times\:100\%$$\end{document}Statistical analyses
The ROI with the lowest PSR coefficient of variation (σ/µ) across patients was selected as the reference ROI of choice. The intra-reader agreement of the ROI of choice was calculated on the “standard” synthetic PSR-optimized protocol (FA 90° TE 30ms TR 1.5s P–) with a two-way mixed effects intraclass correlation coefficient for a single rater (ICC3) after the ROI drawing was repeated after a wash-out period of 3 months by reader 1 (FS). The inter-reader agreement with a reader 2 (JY) was calculated with a two-way random effects ICC for agreement (ICC2), as proposed in a previous study [9]. The agreement of PSR and nPSR values across different protocols (with a single reader) was calculated with ICC3, while the consistency of their ranks within the cohort was evaluated with a Spearman’s correlation coefficient (ρ) [8]. In other words, ICC3 measures whether two methods agree on the actual value of the measurement (e.g., whether a certain tumor exhibits PSR = 100% with both protocol A and protocol B), while ρ measures whether two methods agree on the ranks of the measurement (e.g., whether a certain tumor exhibits the highest PSR in the cohort with both protocol A and protocol B, regardless of changes in the actual value). First, the changes in values and ranks introduced by the normalization were quantified by computing ICC3 and ρ between tumor PSR and nPSR, using a single “standard” synthetic PSR-optimized protocol (FA 90° TE 30ms TR 1.5s P–) [8]. Second, PSR and nPSR were computed with different synthetic protocols, and the ICC3 and ρ were computed between the standard protocol and other protocols (with a uniform synthetic protocol for the whole cohort). This tested whether the normalization can improve the universalizability of PSR across cohorts acquired with different protocols. Third, ICC3 and ρ were calculated on PSR and nPSR obtained from bootstrapped cohorts while assigning to each subject a random acquisition parameter within a certain range (i.e., with heterogeneous synthetic protocols within each bootstrapped cohort). For each predetermined range of each acquisition parameter, the analysis was repeated for 1000 iterations to generate distributions of ICC3 and ρ to assess PSR inconsistencies within cohorts with heterogenous protocols.
Results
Selection of the reference tissue
Median (interquartile range) size values of the reference ROI’s were as follows: NAWM 2.5 cc (2.2–3.9), Falx 1.0 cc (0.9–1.3), Muscle 2.8 cc (2.3–3.4), Skin 21 cc (18–24). Among the four candidate reference tissues (Fig. 1A), NAWM demonstrated the least inter-patient variability in PSR measurements when the experimental conditions were kept stable for all subjects (i.e., with a “standard” PSR-optimized synthetic protocol: FA 90°, TE 30 ms, TR 1.5 s, no preload simulation) [2, 8]. Since an ideal reference tissue aimed at correcting technical inconsistencies should have minimal inter-patient variability when the experimental conditions are uniform, NAWM was selected as reference tissue of choice for subsequent analyses (Fig. 1B). NAWM normalization showed a near-perfect inter-reader (nPSR_linear_: ICC2 0.995, nPSR_ln_: ICC2 0.997) and intra-reader (nPSR_linear_: ICC3 0.988, nPSR_ln_: ICC3 0.995) agreement (Table 1). The NAWM normalization, either linear (nPSR_linear_) or logarithmic (nPSR_ln_), did not introduce significant rank changes (ρ = 0.99, Fig. 1C) compared to PSR, using the default PSR-optimized protocol. However, nPSR values should not be compared to non-normalized values, since the agreement between PSR and nPSR is low, especially for the logarithmic normalization (ICC3 = 0.96 nPSR_linear_ and ICC3 = 0.18 nPSR_ln_, Fig. 1C). Visual evaluations of the normalized voxel-wise maps suggest that nPSR_ln_ can better mitigate the effect of protocol changes, compared to both nPSR_linear_ and PSR (Fig. 1D).
Fig. 1. Preliminary analyses on normalization methods. Among the candidate reference tissues (A), the white matter (NAWM) showed the lowest variability across patients (B) and demonstrated to maintain the differences among tumors (C). A visual evaluation (D is a randomly-selected case) showed that a logarithmic normalization can mitigate the differences in PSR introduced by acquisition parameter variations (variations in FA, while the other parameters are maintained stable: TE 30 ms, TR 1.5 s, P–)
Table 1. Inter- and intra-reader agreement of normalized PSR measurementsAgreement type(Statistical test)Linear normalizationnPSR_linear_Logarithmic normalizationnPSR_ln_Inter-reader agreement(ICC2)0.9950.997Intra-reader agreement(ICC3)0.9880.995
Usefulness of PSR normalization
A logarithmic PSR normalization using NAWM as a reference tissue was found to outperform no normalization and linear normalization in terms of value consistency and rank consistency in presence of protocol variations.
When analyzing the cohort with different uniform protocols, nPSR_ln_ granted a better agreement of values obtained with different protocols: the blue line in Fig. 2A represents a higher ICC3 of nPSR_ln_ compared to nPSR (green) and nPSR_linear_ (red). The rank consistency was comparable among PSR, nPSR_linear_ and nPSR_ln_ (similar ρ in Fig. 2B) in this experiment. This means that the logarithmic normalization yields values that are more comparable across cohorts studied with different protocols and does not attenuate the differences among different tumors.
Fig. 2. Assessment of white matter (NAWM) linear and logarithmic normalization. When uniformly varying acquisition parameters in the studied cohort, a logarithmic normalization (blue) improved the consistency of PSR values across protocols (A), while maintaining similar ranks (B), compared to the “standard” protocol (golden box). When varying acquisition protocols within each bootstrapped sample to obtain cohorts with heterogeneous protocols, a logarithmic normalization (blue violin plots) improved the consistency of both PSR values (C) and ranks (D) compared to the reference “standard” protocol (golden box)
When analyzing bootstrapped cohorts with heterogeneous protocols, nPSR_ln_ achieved a better agreement among values calculated with varying ranges of acquisition parameters: the blue violin plots in Fig. 2C show distributions with higher ICC3 for nPSR_ln_ compared to nPSR (green violin plots) and nPSR_linear_ (red violin plots). Additionally, nPSR_ln_ also achieved a better rank consistency with heterogeneous protocols: the blue violin plots in Fig. 2D show distributions with higher ρ for nPSR_ln_ compared to nPSR (green violin plots) and nPSR_linear_ (red violin plots). This means that the logarithmic normalization better preserves the differences in PSR contrast when a certain cohort includes tumors studied with heterogeneous acquisition parameters.
Discussion
This is the first report systematically testing several reference tissues and also the first one proposing a logarithmic normalization. NAWM logarithmic normalization should be preferred, as it mitigates the dependency of PSR values on acquisition protocols, while maintaining the differences and ranks among different tumors. Maintaining consistent values across protocols would benefit the universalizability of PSR values across different institutions adopting different acquisition protocols, allowing for a more consistent interpretation of such values in any given experimental condition. A linear normalization using NAWM as reference was used in prior studies [1, 2], although never validated for the purpose of across-protocol comparisons. Using NAWM as a PSR reference tissue may appear counterintuitive, since no contrast agent leakage happens in this tissue which can bear information about the post-bolus T_1_- to T_2_- balance of the applied protocol. However, T_1_- and T_2_- post-bolus effects are also seen in non-enhancing tissue, as a result of the leftover contrast agent in the vasculature [4], which can explain the usefulness of NAWM for PSR normalization. The cerebral falx might also be a reference tissue of interest to capture the information about the T_1_- to T_2_*- balance, given the peculiar post-bolus effects in the dura. However, the falx showed a higher inter-subject variability, probably linked to partial volumes effects due to the thinness of this anatomical structure. Importantly, the proposed method for NAWM ROI drawing showed excellent inter- and intra-reader agreement in the present study, and in a previous CBV study [9]. This study has some limitations: the design is retrospective, the sample size is relatively small, and the “synthetic” DSC methodology relies on some assumptions, as discussed in the original article [8]. Additionally, the study design tested the usefulness of NAWM normalization only as a strategy to mitigate technical inconsistencies, while it did not test whether it mitigates also potential non-tumoral biological heterogeneities (e.g., related to the cardiovascular system) across patients.
Conclusions
A white matter normalization of PSR values, specifically with a logarithmic approach, may improve the consistency of both values and ranks across different DSC protocols. Future studies may report the values of both PSR and nPSR_ln_, to improve the universalizability of the reported values. Thresholds of nPSR_ln_ for clinical applications may be more reliably comparable across studies adopting different acquisition protocols and within cohorts imaged with heterogeneous protocols.