Development and validation of a Comprehensive Hematological Scoring System for predicting overall survival in patients with soft tissue sarcomas: a comparison with NLR and PLR
Ying Qiu, Jiquan Liu, Shuang Chai, Lili Liu, Longqing Li, Yan Zhang

TL;DR
Researchers developed a new scoring system to predict survival in soft tissue sarcoma patients, which outperforms existing blood-based biomarkers.
Contribution
A novel Composite Hematological Scoring System (CHSS) was developed and validated for improved survival prediction in soft tissue sarcomas.
Findings
CHSS outperformed NLR and PLR in predicting overall survival at all timepoints.
High CHSS scores were strongly associated with worse survival (HR=6.197, P<0.001).
The CHSS-based nomogram achieved a C-index of 0.79 for 3- and 5-year survival prediction.
Abstract
Soft tissue sarcomas (STS) are rare malignancies with high relapse/metastasis risks and limited treatment efficacy. Current biomarkers like neutrophil-to-lymphocyte ratio (NLR) and platelet-to-lymphocyte ratio (PLR) lack comprehensive prognostic value due to their reliance on limited hematological parameters. This retrospective study analyzed 206 STS patients (2016–2023) to develop a Composite Hematological Scoring System (CHSS) integrating 19 pretreatment markers. LASSO regression selected key variables (glucose, CRP, LDL-C, HDL-C, albumin, platelets, hemoglobin, lymphocytes), weighted by coefficients. CHSS’s prognostic performance was compared to NLR/PLR via Kaplan-Meier, time-dependent ROC, and Cox regression analyses. A nomogram combining CHSS with clinical variables was validated using C-index, calibration, and decision curves. CHSS outperformed NLR/PLR in predicting overall…
Genes, proteins, chemicals, diseases, species, mutations and cell lines named across the full text — each resolved to its canonical identifier and authoritative record.
Click any figure to enlarge with its caption.
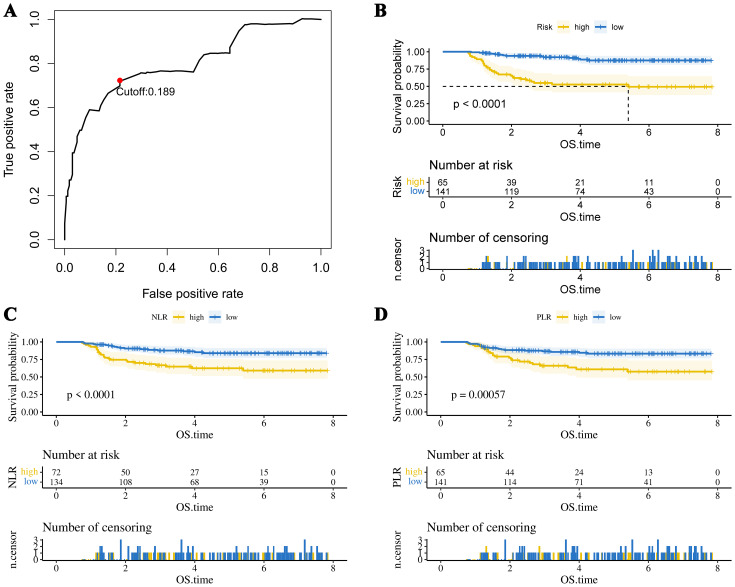 Figure 1
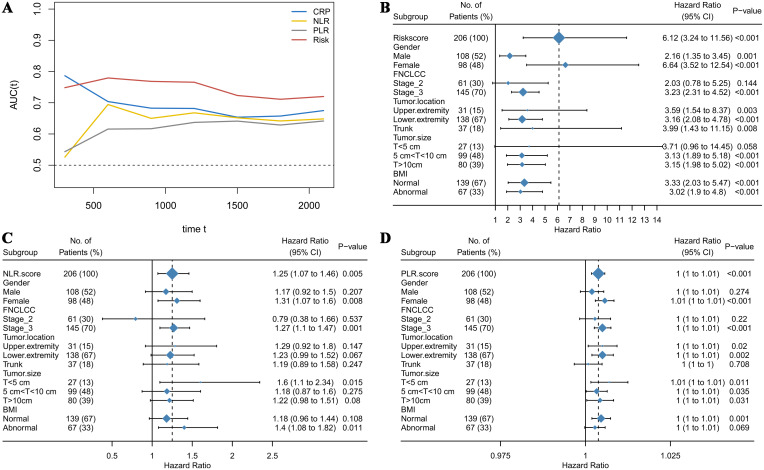 Figure 2
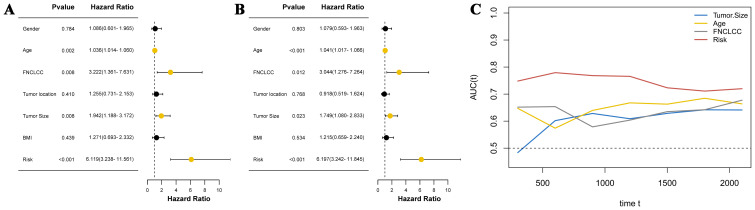 Figure 3
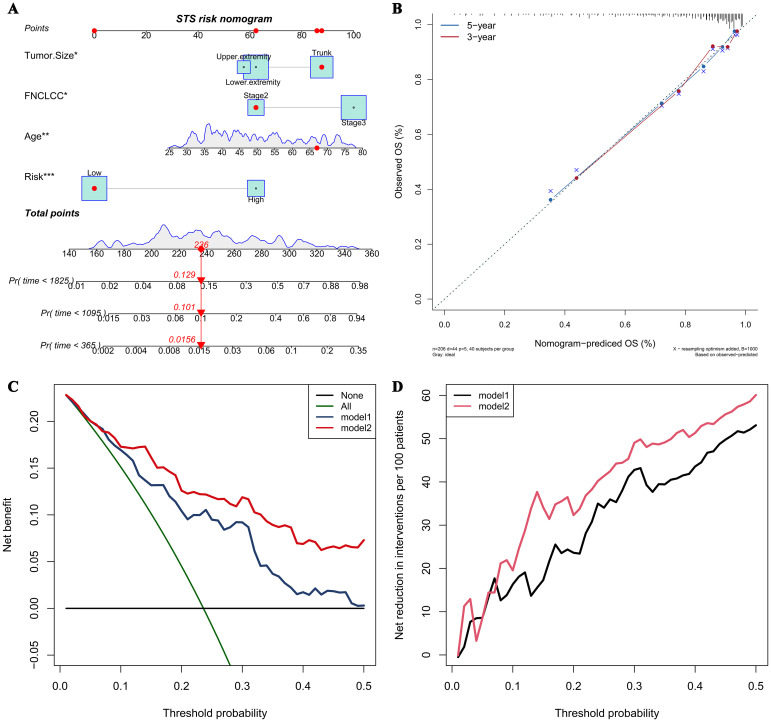 Figure 4
| Variable | CHSS Low Risk (N = 141) | CHSS High Risk (N = 65) | P-value |
|---|---|---|---|
| Overall survival | |||
| Mean (SD) | 1600 (734) | 1180 (812) | < 0.001 |
| Gender | |||
| Female | 66 (46.8%) | 32 (49.2%) | 0.862 |
| Male | 75 (53.2%) | 33 (50.8%) | |
| Age | |||
| Mean (SD) | 49.4 (13.7) | 50.2 (12.3) | 0.665 |
| FNCLCC | |||
| Stage 2 | 33 (23.4%) | 8 (12.3%) | 0.0957 |
| Stage 3 | 108 (76.6%) | 57 (87.7%) | |
| TumorLocation | |||
| Upper extremity | 22 (15.6%) | 9 (13.8%) | 0.429 |
| Lower extremity | 97 (68.8%) | 41 (63.1%) | |
| Trunk | 22 (15.6%) | 15 (23.1%) | |
| TumorSize | |||
| T<5 cm | 17 (12.1%) | 10 (15.4%) | 0.593 |
| 5 cm<T<10 cm | 71 (50.4%) | 28 (43.1%) | |
| T>10cm | 53 (37.6%) | 27 (41.5%) | |
| BMI | |||
| Abnormal | 45 (31.9%) | 22 (33.8%) | 0.908 |
| Normal | 96 (68.1%) | 43 (66.2%) | |
| Variable | Auc | Cutoff | Logistic.Pvalue | Logistic.OR |
|---|---|---|---|---|
| NLR | 0.605 | 2.851 | <0.001 | 3.643 |
| PLR | 0.633 | 148.792 | 0.001 | 3.129 |
| LMR | 0.538 | 4.448 | 0.121 | 0.560 |
| PLT | 0.601 | 213 | 0.019 | 2.252 |
| Neutrophil | 0.525 | 4.01 | 0.183 | 1.577 |
| Lymphocyte | 0.589 | 2.08 | 0.032 | 0.364 |
| Monocytes | 0.516 | 0.44 | 0.265 | 0.684 |
| RBC | 0.543 | 3.98 | 0.082 | 0.551 |
| HB | 0.527 | 95 | 0.022 | 0.339 |
| Albumin | 0.578 | 41.3 | 0.018 | 0.428 |
| RDW | 0.548 | 13.7 | 0.086 | 1.840 |
| Globulin | 0.584 | 23.6 | 0.058 | 2.029 |
| Glucose | 0.568 | 5.93 | 0.001 | 3.733 |
| Triglycerides | 0.528 | 1.78 | 0.057 | 0.238 |
| Cholesterol | 0.555 | 4.71 | 0.052 | 0.134 |
| HDL-C | 0.573 | 1.35 | 0.014 | 0.316 |
| LDL-C | 0.612 | 1.97 | 0.009 | 2.667 |
| APTT | 0.554 | 30.4 | 0.081 | 1.826 |
| PT | 0.565 | 11.3 | 0.09 | 1.861 |
| TT | 0.515 | 17.2 | 0.154 | 1.839 |
| FIB | 0.528 | 4.04 | 0.114 | 1.845 |
| CRP | 0.629 | 9.1 | 0.004 | 3.080 |
| Variable | Coef |
|---|---|
| PLT | 0.567091 |
| Lymphocyte | -0.47881 |
| HB | -0.5132 |
| Albumin | -0.78245 |
| Glucose | 0.708249 |
| HDL-C | -0.60477 |
| LDL-C | 0.498902 |
| CRP | 0.971148 |
Peer Reviews
No public reviews on file for this paper yet. If you reviewed it on a platform where reviews are public (OpenReview, ICLR, NeurIPS, ICML), you can paste yours below so the community can read it here.
Videos
No videos yet. Explain this paper in a talk, walkthrough, or lecture? Add one.
Taxonomy
TopicsSarcoma Diagnosis and Treatment · Vascular Tumors and Angiosarcomas · Angiogenesis and VEGF in Cancer
Introduction
1
Soft tissue sarcomas (STS) are rare solid cancers originating from mesenchymal tissues —including muscle, adipose, bone, and fibrous tissues—comprising approximately 1% of adult malignancies and exhibiting an annual incidence of 4–5 per 100,000 individuals (1). Liposarcoma (LPS), leiomyosarcoma (LMS), and undifferentiated pleomorphic sarcoma (UPS) represent the most prevalent subtypes, although the WHO classification system recognizes over 70 distinct histopathologic subtypes (2–4). A critical clinical challenge lies in the high rates of local recurrence and distant metastasis, occurring in 25–50% of patients, with risk stratification dependent on tumor stage and histologic subtype (5). For locally advanced and metastatic STS, first-line chemotherapies such as doxorubicin and ifosfamide remain standard-of-care, yet demonstrate limited efficacy, yielding a median overall survival (OS) of merely 10–15 months in metastatic cases (6, 7). Over the past decade, therapeutic paradigms have evolved from uniform protocols to histology-driven algorithms, incorporating tumor subtype- and stage-adjusted surgical and multimodal interventions (8).
Advances in tumor biology have established that systemic inflammation, metabolic dysregulation, and nutritional status are intrinsically linked to tumor aggressiveness and clinical outcomes (9–11). This understanding has catalyzed the emergence of prognostic biomarkers, including the neutrophil-to-lymphocyte ratio (NLR), platelet-to-lymphocyte ratio (PLR), prognostic nutritional index (PNI), and Controlling Nutritional Status Score (CONUT) (12–15). While these hematologic indices reflect inflammatory or nutritional derangements and enable partial prediction of oncologic prognosis and therapeutic responses, most rely on limited parameter combinations—for instance, NLR is derived solely from absolute neutrophil and lymphocyte counts—thereby limiting their ability to fully exploit hematologic data (16). It is reasonable to speculate that a multidimensional scoring system integrating comprehensive laboratory parameters may offer superior prognostic predictive capacity.
In this study, we retrospectively analyzed 19 pretreatment hematologic parameters spanning inflammation, nutrition, metabolism, and coagulation, constructing a composite prognostic score via Least Absolute Shrinkage and Selection Operator (LASSO) COX proportional hazards regression analysis. This novel scoring system was benchmarked against two conventional hematologic markers (NLR and PLR) to evaluate the comparative prognostic utility of multidimensional versus simplified biomarker approaches.
Patients and methods
2
Patients
2.1
This retrospective cohort study analyzed the clinical data of patients with STS treated at the Musculoskeletal Tumor Center of Zhengzhou University First Affiliated Hospital from June 2016 to June 2023. The inclusion criteria for patients were as follows: 1. Histopathologically confirmed STS; 2. Complete pretreatment hematologic profiles; 3. receipt of institutionally approved standard therapies. The exclusion criteria: 1. Postsurgical recurrence; 2. Concurrent hematologic disorders; 3. Secondary malignancies. All enrolled patients underwent surgical treatment and were followed up regularly until death or June 2023. The ethics committee of Zhengzhou University First Affiliated Hospital approved this study, and each participant signed a written informed consent form.
Data collection and analysis
2.2
Nineteen pretreatment laboratory parameters were collected: neutrophils, lymphocytes, monocytes, red blood cells, red cell distribution width, platelets, hemoglobin, albumin, globulin, glucose, triglycerides, high-density lipoprotein (HDL), low-density lipoprotein (LDL), activated partial thromboplastin time (APTT), prothrombin time (PT), fibrinogen, thrombin time (TT), and C-reactive protein (CRP). The optimal cutoff values for each indicator were calculated using receiver operating characteristic (ROC) curves, converting all indicators into binary variables. Clinical variables including age, gender, body mass index (BMI), tumor size, tumor location, and the French Federation Nationale des Centres de Lutte Contre le Cancer sarcoma grade (FNCLCC) were extracted from electronic medical records. Overall survival (OS) was defined as the interval from diagnosis to death or last follow-up.
Comparison of prognostic value of NLR/PLR/CHSS in STS patients
2.3
NLR = Neutrophil/Lymphocyte; PLR = Platelet/Lymphocyte. The construction method of the CHSS score is as follows: first, variables with prognostic value in STS patients were screened using logistic regression (P<0.05). Subsequently, LASSO regression analysis was performed to reduce dimensionality of the selected variables and assign a coefficient to each variable. The CHSS score is the sum of all variables multiplied by their respective coefficients. The optimal cutoff value for the CHSS score was calculated using ROC analysis. Kaplan-Meier survival curves were plotted to evaluate the prognostic value of the three biomarkers in predicting overall survival in STS patients. The predictive capabilities of the three biomarkers were compared using time-dependent ROC curves. Subgroup analyses were conducted to compare the stability of the predictive abilities of the three biomarkers.
Construction and evaluation of the CHSS-based nomogram for STS
2.4
CHSS was integrated with clinical covariates to identify independent OS predictors via multivariable Cox regression. A prognostic nomogram was constructed using significant predictors, with discriminative performance evaluated by Harrell’s concordance index (C-index) and calibration curves. Decision curve analysis (DCA) and clinical impact curves quantified clinical net benefit.
Statistical analysis
2.5
The Kolmogorov-Smirnov test was used to determine whether continuous variables follow a normal distribution. Based on the normality, either the t-test or the Mann-Whitney U test was used to assess differences between continuous variables. The chi-squared test or Fisher’s exact test was used to evaluate differences in categorical variables, depending on the sample size in each group. All statistical analyses were performed using R software version 4.4.0 (Vienna Institute of Statistics and Mathematics, Austria). A P value of < 0.05 was considered statistically significant.
Results
3
Patient characteristics
3.1
The cohort comprised 206 STS patients (108 males, 98 females) with a mean age of 49.7 ± 13.2 years (range: 26–77). FNCLCC grading classified 145 patients (70.4%) as grade 3 and 61 (29.6%) as grade 2. Tumor distribution included upper limbs (n=31, 15.0%), lower limbs (n=138, 67.0%), and trunk (n=37, 18.0%). Tumor size stratification revealed 27 patients (13.1%) with lesions <5 cm, 99 (48.1%) with 5–10 cm tumors, and 80 (38.8%) with tumors >10 cm. At final follow-up (June 2023), 44 deaths (21.4%) were recorded (Table 1).
Comparison of prognostic value of NLR/PLR/CHSS in STS patients
3.2
The optimal cutoff values for 19 test results in STS patients are shown in Table 2. Eight parameters—glucose, CRP, LDL-C, HDL-C, albumin, platelet count (PLT), hemoglobin (HB), and lymphocyte count—were significantly associated with prognosis and incorporated into CHSS. Table 3 presents the coefficients of the aforementioned test results in the CHSS score. The CHSS cutoff (0.189) stratified patients into high- versus low-risk groups (Figure 1A), with significantly worse OS in high-CHSS patients (log-rank P < 0.001). Similarly, patients in the high NLR group and high PLR group had lower overall survival than their respective controls (P < 0.001) (Figures 1B–D). The time-dependent ROC curve results indicated that the predictive ability of CHSS was superior to that of NLR/PLR at all time points, and in most instances, it outperformed the constituent indicator CRP (Figure 2A). Subgroup analysis results showed that CHSS demonstrated significant predictive ability in the majority of subgroups, whereas NLR/PLR showed limited generalizability (Figures 2B–D).
(A) The optimal cutoff value of the CHSS score. The KM survival curves show overall survival in patients grouped by (B) CHSS, (C) NLR, and (D) PLR.
(A) The time-dependent ROC curves demonstrate the predictive abilities of different biomarkers; (B) The forest plot illustrates the predictive ability of CHSS across different subgroups; (C) The forest plot illustrates the predictive ability of NLR across different subgroups; (D) The forest plot illustrates the predictive ability of PLR across different subgroups.
Univariate analysis and multivariate analysis
3.3
Cox regression analysis was used to explore independent prognostic factors in STS patients. Univariate analysis revealed that age (hazard ratio (HR) = 1.036 (95% confidence interval (CI) 1.014–1.060), P = 0.002), FNCLCC (HR = 3.222 (1.361–7.631), P = 0.008), tumor size (HR = 1.942 (1.188–3.172), P = 0.008), and CHSS (HR = 6.119 (3.238–11.561), P < 0.001) were associated with OS in STS patients (Figure 3A). The results of the multivariate analysis indicated that age (HR = 1.041 (1.017–1.066), P < 0.001), FNCLCC (HR = 3.044 (1.276–7.264), P = 0.012), tumor size (HR = 1.749 (1.080–2.833), P = 0.023), and CHSS (HR = 6.197 (3.242–11.845), P < 0.001) were all independent prognostic factors for STS patients (Figure 3B). CHSS consistently outperformed other variables in time-dependent ROC comparisons (Figure 3C).
(A) The forest plot shows the univariate analysis results of CHSS and clinical variables; (B) The forest plot shows the multivariate analysis results of CHSS and clinical variables; (C) The time-dependent ROC curve demonstrates the predictive ability of independent prognostic factors.
Construction and validation of CHSS-based nomogram
3.4
A prognostic nomogram integrating four independent predictors (CHSS, age, FNCLCC grade, tumor size) was developed (Figure 4A). The model demonstrated excellent discrimination (C-index=0.79) and calibration accuracy for 3-/5-year OS predictions (Figure 4B). Decision curve analysis revealed greater net clinical benefit for Model 2 (CHSS + clinical variables) versus Model 1 (clinical variables alone) across threshold probabilities (Figures 4C, D).
(A) The nomogram predicting overall survival in soft tissue sarcoma patients based on independent risk factors; (B) The calibration curve of the nomogram; (C) The net benefit curve of the nomogram; (D) The net reduction curve of the nomogram.
Discussion
4
This single-center retrospective study evaluated two biomarker development paradigms in 206 STS patients. While both conventional biomarkers (NLR/PLR) and the CHSS demonstrated prognostic utility, time-dependent ROC analyses revealed CHSS’s superior predictive accuracy and stability across follow-up intervals. CHSS was identified as an independent prognostic factor for STS patients, and the nomogram based on CHSS could reliably predict 3-year and 5-year overall survival in STS patients.
In the past decade, accumulating evidence has validated the prognostic value of NLR and PLR in various cancers, including lung cancer, breast cancer, thyroid cancer, and liver cancer (17–22). Furthermore, these inflammatory makers demonstrate prognostic relevance in STS subtypes, particularly liposarcoma (23–28). Emerging evidence further highlights their potential in predicting therapeutic responses, as exemplified by trabectedin outcomes in STS patients (29). NLR’s role as a marker for predicting cancer patient survival may be attributed to its reflection of the balance between the body’s inflammatory and immune status (30). Neutrophils are key effector cells in the inflammatory response and are often elevated in cancer patients, indicating a significant inflammatory reaction. Neutrophils promote tumor progression by releasing cytokines and growth factors, which enhance tumor angiogenesis, suppress immune surveillance, and promote the growth and invasiveness of tumor cells (31, 32). On the other hand, lymphocytes are crucial cells in the immune system responsible for anti-tumor responses (33). A decrease in lymphocytes usually reflects a state of immunosuppression, indicating impaired immune surveillance (34, 35). This immunosuppressive state hinders the body’s ability to effectively eliminate tumor cells, increasing the risk of tumor recurrence and metastasis. A high NLR reflects a combination of increased neutrophils and decreased lymphocytes, indicating a state of both heightened inflammation and weakened anti-tumor immunity. Additionally, experimental tumor therapies that reduce neutrophil counts have further solidified the association between elevated neutrophils and poor prognosis in cancer patients (36, 37).
Similar to NLR, a high PLR also reflects an imbalance between tumor-promoting factors and anti-tumor immune responses (23, 38). For example, platelets can release pro-angiogenic factors such as vascular endothelial growth factor to promote tumor growth (39, 40). However, these biomarkers only incorporate a very limited portion of the hematological test results, making it difficult to fully capture the true value of these tests. In our study, we collected up to 19 blood test results, including neutrophil count, lymphocyte count, monocyte count, and C-reactive protein, which are related to inflammation and immunity; glucose, albumin, triglycerides, HDL-C, LDL-C, and other indicators associated with nutritional status and metabolism; as well as APTT, PT, TT, which are related to coagulation status. Through dimensionality reduction of these results, we constructed the CHSS prognostic score to comprehensively reflect the value of the patients’ blood test results. As we predicted, CHSS demonstrated superior predictive ability and stability compared to NLR and PLR. CHSS is composed of CRP, lymphocytes, HB, albumin, glucose, HDL-C, LDL-C, and PLT, and it comprehensively reflects the patient’s inflammatory, immune, nutritional and metabolic status. The response of CHSS to the body’s inflammation and immune balance primarily comes from CRP, PLT and lymphocyte count. CRP is an acute-phase reactive protein synthesized by the liver when stimulated by inflammatory factors. Elevated CRP indicates the presence of a persistent inflammatory state, which can promote tumor growth and metastasis by enhancing angiogenesis, supporting tumor cell survival, and increasing invasiveness (41, 42).
Beyond inflammation, CHSS can also reflect the body’s lipid metabolism balance. The coefficients of LDL-C and HDL-C in CHSS are 0.498 and -0.605, respectively, with elevated LDL-C and reduced HDL-C associated with poor prognosis in STS patients. LDL-C is the lipoprotein primarily responsible for distributing cholesterol to extrahepatic tissues and body cells, while HDL-C is the smallest and densest lipoprotein in the blood, functioning to clear excess cholesterol through reverse transport (43, 44). Abnormally elevated LDL-C and reduced HDL-C may indicate an abnormal lipid metabolism, where tumor cells uptake and synthesize more cholesterol and fatty acids to support their growth and proliferation (45). Similarly, the glucose coefficient in CHSS is 0.708, suggesting that elevated blood glucose is associated with a worse prognosis in STS patients. This aligns with previous research showing that elevated blood glucose, even below the diagnostic threshold for diabetes, is related to poor outcomes in cancer patients (46). This may be due to the high-glucose environment upregulating the pathways related to the Warburg effect in tumor cells, promoting tumor growth and metastasis. Additionally, glucose can activate various signaling pathways involved in tumor cell proliferation, metastasis, and therapy resistance, promoting malignant phenotypes (47). Experimental results show that cancer cells exposed to supraphysiological glucose concentrations become more aggressive, further confirming this (46, 48).
Lastly, CHSS may also reflect the body’s nutritional status. The nutritional status of patients is also closely related to the prognosis of tumor patients (49). The coefficients for albumin and hemoglobin (HB) in CHSS are -0.513 and -0.782, respectively. Albumin is a chronic-phase protein commonly used to assess a patient’s nutritional status and the body’s protein synthesis capacity (15). An abnormal decrease in albumin indicates poor nutritional status and may weaken the body’s antitumor immune function and response to treatment (50). HB is the primary carrier responsible for transporting oxygen from the lungs to tissues throughout the body. Anemia may reflect a state of insufficient oxygen supply to tissues, and in a hypoxic environment, tumor tissues adapt by activating a series of survival-promoting mechanisms, such as inducing angiogenesis, which in turn promotes further tumor growth and metastasis (51, 52). Additionally, a decrease in HB may also indicate systemic malnutrition and cachexia in cancer patients.
In conclusion, we believe that CHSS utilizes the patient’s test results more comprehensively, reflecting the overall status of the body, and thus has a stronger predictive capability for patient prognosis. However, it must be acknowledged that our study has certain limitations. First, our study is a single-center retrospective study, which may introduce some selection bias. Secondly, although the CHSS exhibits stronger predictive capabilities, its computational complexity exceeds that of NLR and PLR, and the optimal coefficients for individual markers may vary across different cohorts, potentially limiting its clinical applicability. However, the enhanced stability of CHSS predictions provides a novel direction for developing next-generation biomarkers: integrating comprehensive indicators reflecting systemic inflammatory, immune, and nutritional statuses can circumvent the risk of prediction failure inherent to single-marker reliance. Future studies should focus on identifying the optimal balance between computational complexity and predictive performance in multicenter, large-scale cohorts. Furthermore, the development of standardized assays analogous to Oncotype DX is critical to advancing the clinical translation of CHSS (53). Lastly, our study only included the most common laboratory test results, and some novel test results with prognostic value, such as cytokines test, may have been overlooked.
Conclusion
5
The CHSS, composed of multiple test results, demonstrates superior predictive ability and stability for overall survival in STS patients compared to NLR/PLR. CHSS is an independent risk factor for OS in STS patients. The nomogram based on CHSS aids in the personalized management of patients.
The reference list from the paper itself. Each links out to its DOI / PubMed record.
- 1Hoefkens F Dehandschutter C Somville J Meijnders P Van Gestel D. Soft tissue sarcoma of the extremities: pending questions on surgery and radiotherapy. Radiat Oncol (London England). (2016) 11:136. doi: 10.1186/s 13014-016-0668-9, PMID: 27733179 PMC 5062836 · doi ↗ · pubmed ↗
- 2Siegel RL Miller KD Wagle NS Jemal A. Cancer statistics, 2023. CA: A Cancer J clinicians. (2023) 73:17–48. doi: 10.3322/caac.21763, PMID: 36633525 · doi ↗ · pubmed ↗
- 3Fornaciari G. Histology of ancient soft tissue tumors: A review. Int J paleopathology. (2018) 21:64–76. doi: 10.1016/j.ijpp.2017.02.007, PMID: 29776878 · doi ↗ · pubmed ↗
- 4Mastrangelo G Coindre JM Ducimetière F Dei Tos AP Fadda E Blay JY. Incidence of soft tissue sarcoma and beyond: a population-based prospective study in 3 European regions. Cancer. (2012) 118:5339–48. doi: 10.1002/cncr.27555, PMID: 22517534 · doi ↗ · pubmed ↗
- 5Lindberg RD Martin RG Romsdahl MM Barkley HT Jr. Conservative surgery and postoperative radiotherapy in 300 adults with soft-tissue sarcomas. Cancer. (1981) 47:2391–7. doi: 10.1002/1097-0142(19810515)47:10<2391::AID-CNCR 2820471012>3.0.CO;2-B, PMID: 7272893 · doi ↗ · pubmed ↗
- 6Judson I Verweij J Gelderblom H Hartmann JT Schöffski P Blay JY. Doxorubicin alone versus intensified doxorubicin plus ifosfamide for first-line treatment of advanced or metastatic soft-tissue sarcoma: a randomised controlled phase 3 trial. Lancet Oncology. (2014) 15:415–23. doi: 10.1016/s 1470-2045(14)70063-4, PMID: 24618336 · doi ↗ · pubmed ↗
- 7Italiano A Mathoulin-Pelissier S Cesne AL Terrier P Bonvalot S Collin F. Trends in survival for patients with metastatic soft-tissue sarcoma. Cancer. (2011) 117:1049–54. doi: 10.1002/cncr.25538, PMID: 20945333 · doi ↗ · pubmed ↗
- 8Gamboa AC Gronchi A Cardona K. Soft-tissue sarcoma in adults: An update on the current state of histiotype-specific management in an era of personalized medicine. CA: A Cancer J clinicians. (2020) 70:200–29. doi: 10.3322/caac.21605, PMID: 32275330 · doi ↗ · pubmed ↗