Colorimetry characteristics and color clustering of natural gem-quality spinel from Myanmar (Burma)
Jun Tang, Wenfang Zhu, Kaichao Liu, Ying Guo

TL;DR
This study analyzes the color properties of gem-quality spinel from Myanmar to understand how lighting and background affect their appearance and how to classify them effectively.
Contribution
The paper introduces a color grading system for spinel using color clustering and equations based on lighting and background luminance.
Findings
Orange spinel chroma and hue are influenced by red tones under both daylight and incandescent lighting.
Purple spinel chroma correlates with a* values, while blue spinel chroma is controlled by green tones.
K-means clustering effectively categorizes spinel colors into three groups for grading purposes.
Abstract
Color is the most critical factor in determining the value of gem-quality spinel. This paper examines the color mechanism and the colorimetric characteristics of spinel crystals under D65 and A light sources against nine neutral backgrounds. It also explores color clustering for over 400 spinel crystals in yellow, red, purple, and blue hues. Various analytical techniques were employed, including optical absorption spectroscopy, Energy-Dispersive X-ray Fluorescence analysis, a benchtop sphere spectrophotometer, the Munsell neutral value gray scale chart, and a standard illumination box. The study reveals distinct optical absorption peaks corresponding to different spinel colors, with these peaks being assigned to specific mechanisms based on previous research. Color analysis demonstrates that the chroma and hue of orange spinel crystals are primarily influenced by the red tone under both…
Genes, proteins, chemicals, diseases, species, mutations and cell lines named across the full text — each resolved to its canonical identifier and authoritative record.
Click any figure to enlarge with its caption.
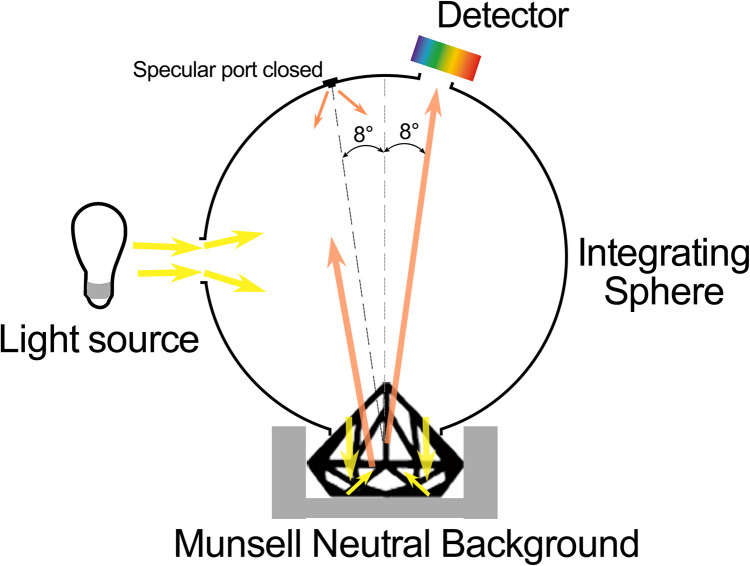 Fig 1
Fig 1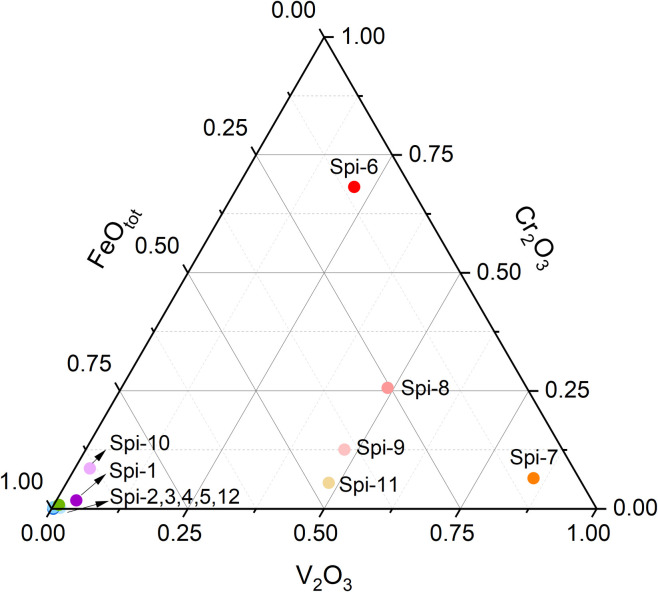 Fig 2
Fig 2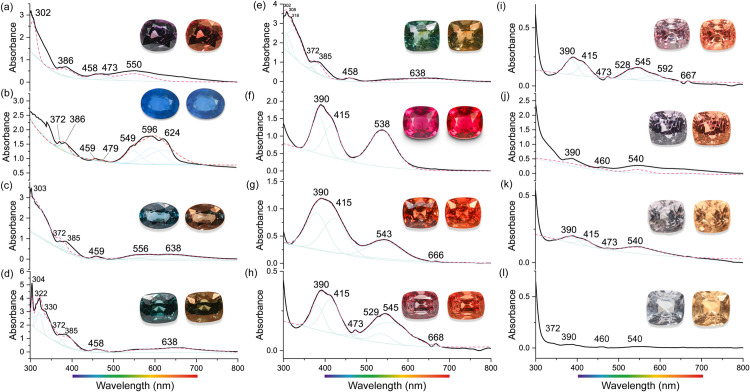 Fig 3
Fig 3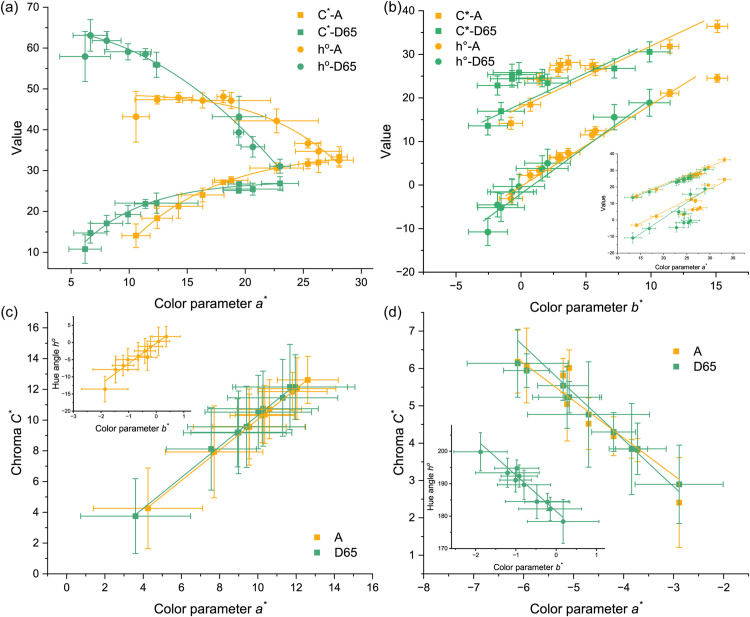 Fig 4
Fig 4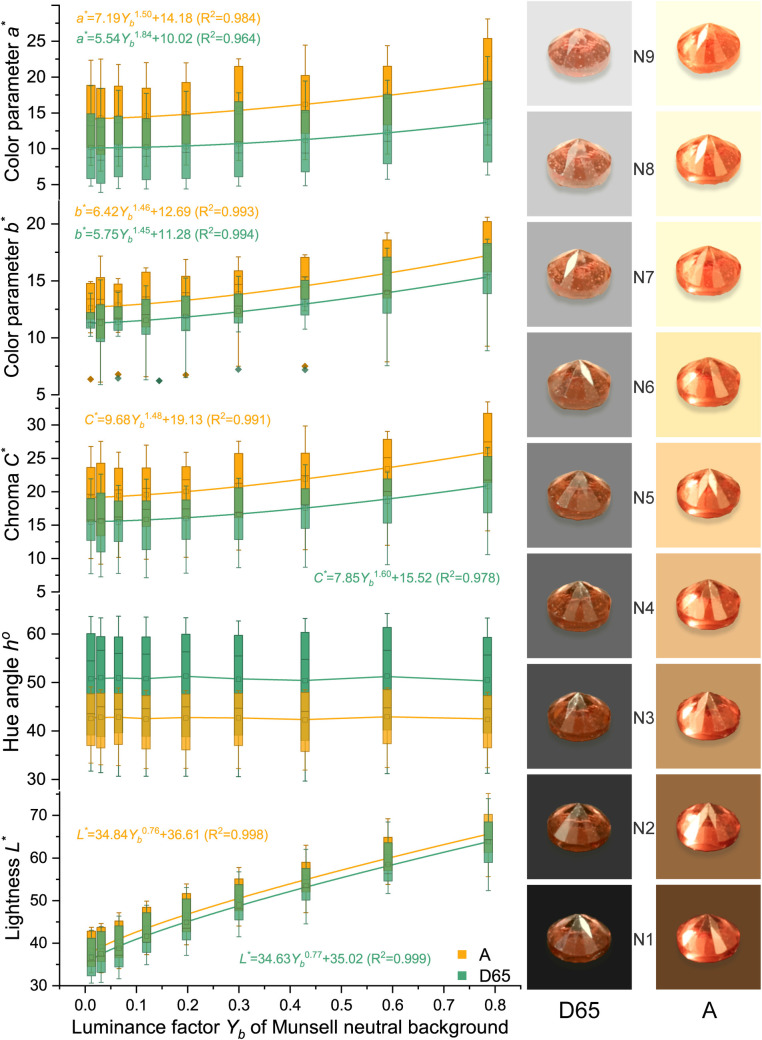 Fig 5
Fig 5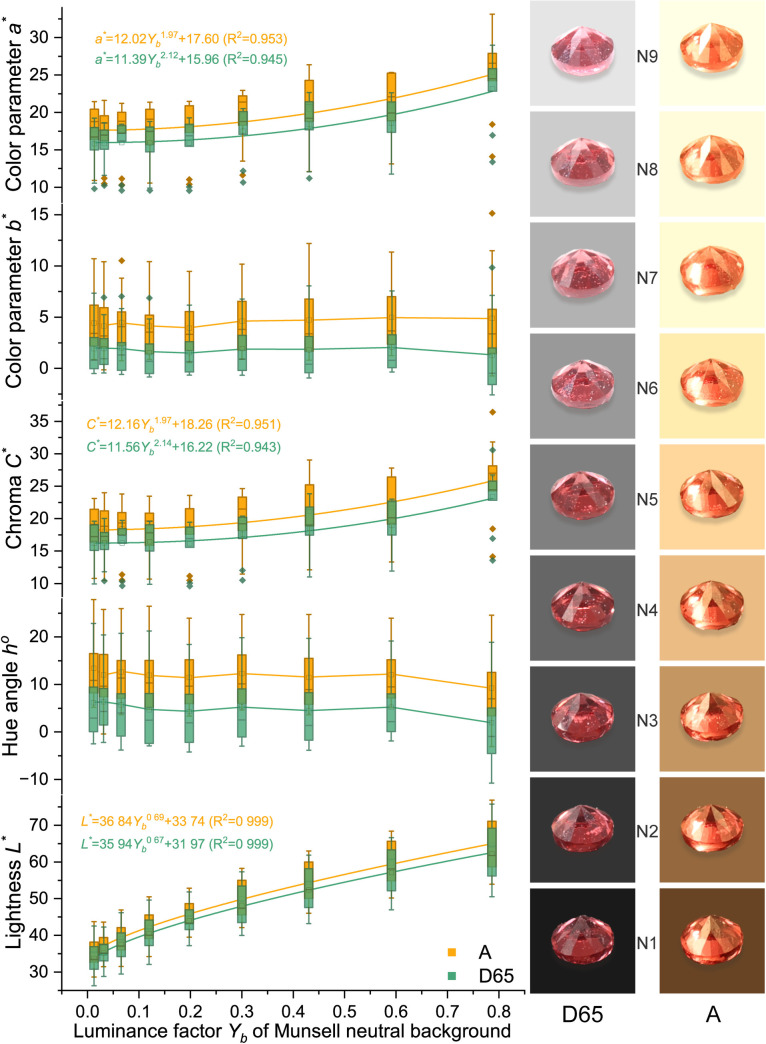 Fig 6
Fig 6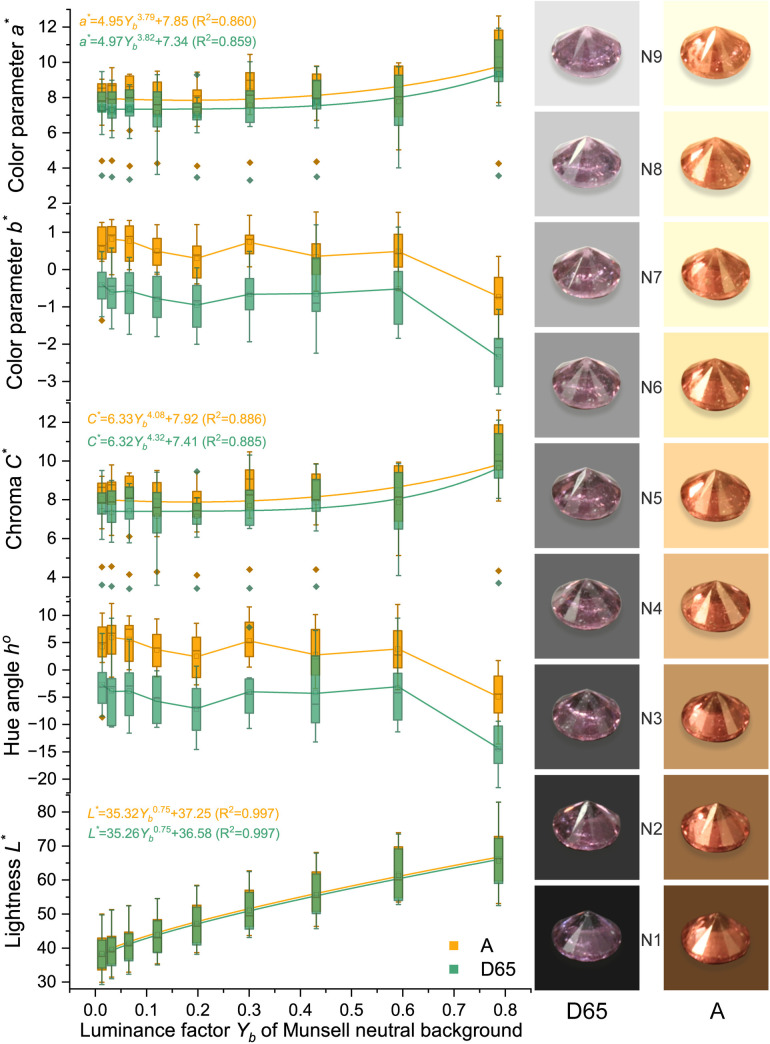 Fig 7
Fig 7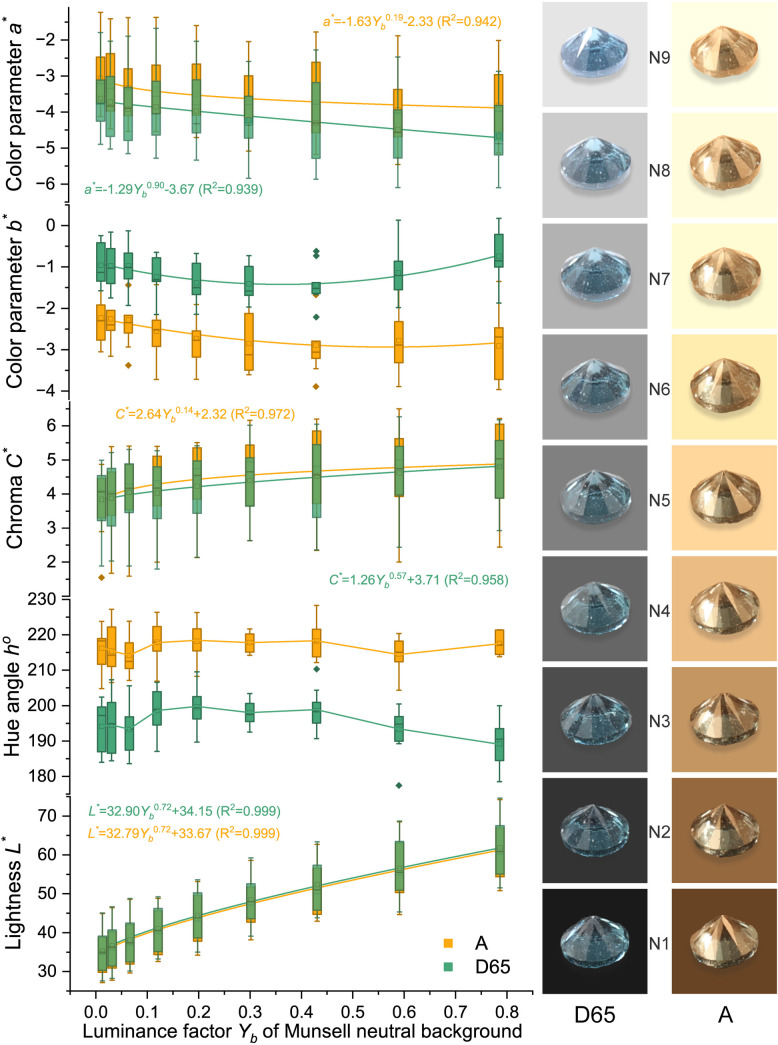 Fig 8
Fig 8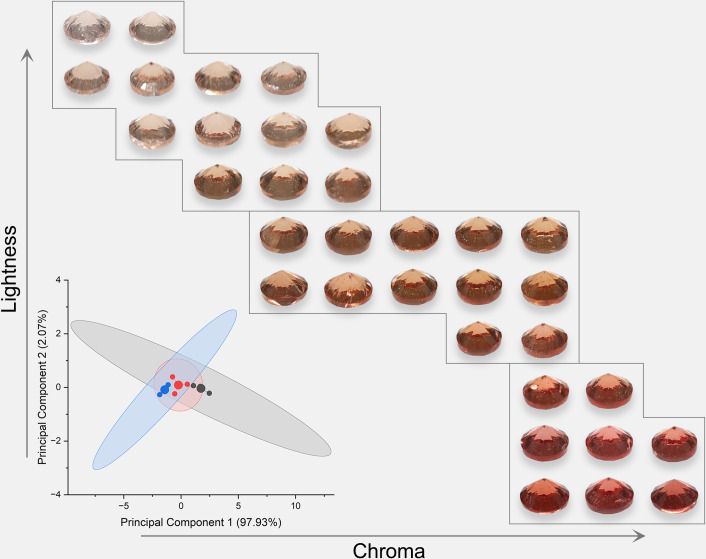 Fig 9
Fig 9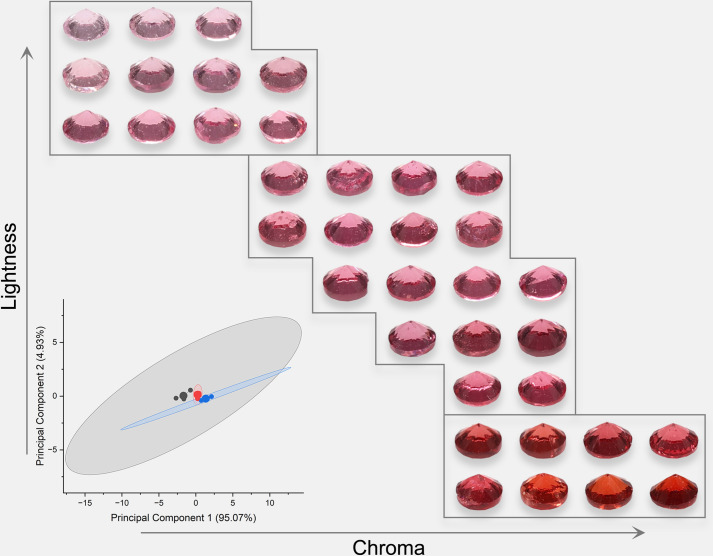 Fig 10
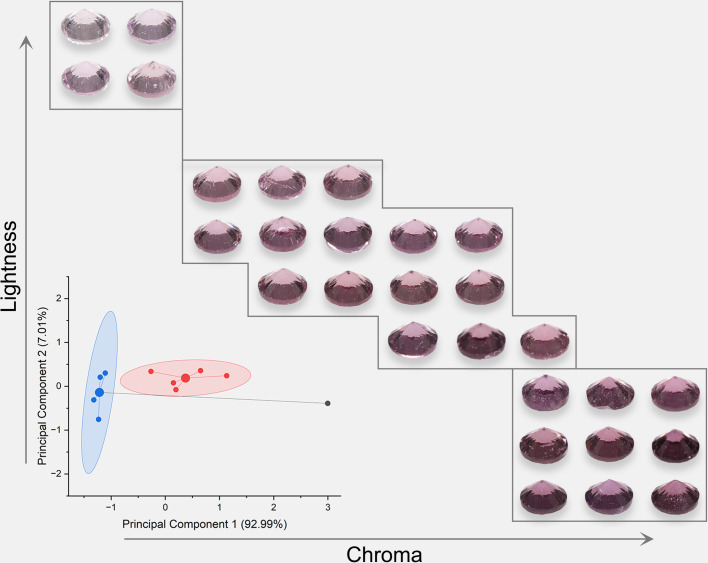 Fig 11
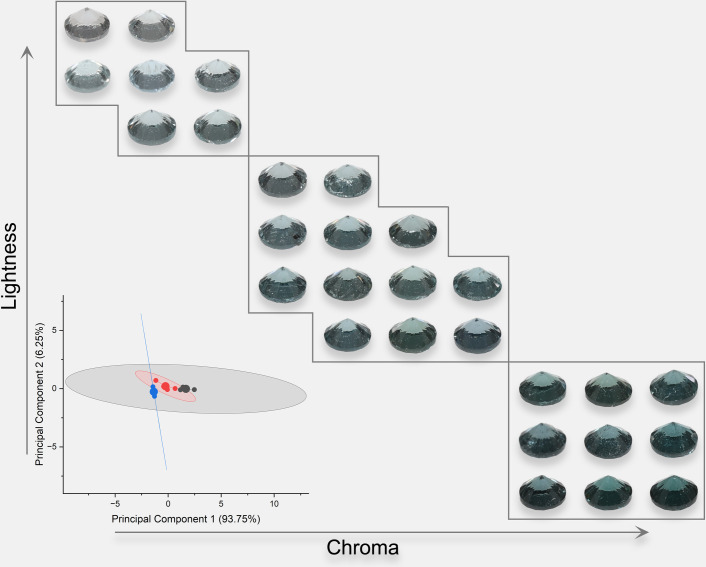 Fig 12
Peer Reviews
No public reviews on file for this paper yet. If you reviewed it on a platform where reviews are public (OpenReview, ICLR, NeurIPS, ICML), you can paste yours below so the community can read it here.
Videos
No videos yet. Explain this paper in a talk, walkthrough, or lecture? Add one.
Taxonomy
TopicsMineralogy and Gemology Studies · Geological and Geochemical Analysis · Geochemistry and Geologic Mapping
Introduction
Color is a visual perception based on the electromagnetic spectrum. There are two primary concepts related to color: body color and color appearance. Body color results from the reflection and selective absorption of certain wavelengths of light by the colored substance [1]. Color appearance is more about how humans perceive color under various conditions such as light source, background, and illumination level [2]. Understanding color is vital, as it significantly influences material value and is a fundamental physical property often used in material identification [3].
Spinel oxides, with the general formula AB_2_O_4_ (where A atoms are tetrahedrally coordinated and B atoms are octahedrally coordinated), constitute a large group of minerals. These minerals are frequently used as gemstones or ceramic pigments due to their diverse and intense colors [4]. High-quality natural spinels are found worldwide, including in Myanmar (both the Mogok Valley and the Namya area) [5–7], Madagascar, Vietnam (Luc Yen District) [8–9], Afghanistan [9], Sri Lanka, Tajikistan, and Tanzania (Mahenge, Uluguru Mountains, and Tunduru) [7,10]. The spinel from Myanmar is particularly renowned for its vivid color, high quality, and historical significance.
The color of gem-quality spinel is the most critical factor determining its value. Spinels exhibit a broad spectrum of colors due to the presence of transition metal elements [11]. Common spinel colors include orange, red, purple, blue, and pink, while colorless, green, and yellow spinels are less frequently encountered. The body color of spinel is influenced by the combined effects of multiple transition metals, such as Cr^3+^, Fe^2+^, Fe^3+^, Mn^2+^, Co^2+^, Cu^2+^, and V^3+^. There are fifteen color mechanisms in nature have been identified by Nassau [12], involving fundamental processes like physical optics, geometrical considerations, molecular orbitals, energy bands, vibrations, simple excitations, and ligand-field effects. Thirteen of those occur in the area of mineralogy, for example, vibrations and rotations (ice), transition metal compounds (turquoise), transition metal impurities (ruby, emerald…), organic compounds (amber), charge transfer (blue sapphire), metals (gold), pure semiconductors (diamond), doped or activated semiconductors (yellow diamond), color center (amethyst), dispersive refraction and polarization (“fire” in gemstones), scattering (moonstone), interference (tarnish of minerals), and diffraction (opal). Except for the 13 causes of color mentioned above, there are more color mechanisms were studied in recent years. For example, a complex color mechanism involves structural relaxation around Cr^3+^, which affects light absorption in spinel [13]. In spinel, color mechanisms generally include electronic transitions within the d orbitals of transition metal cations and charge transfer between oxygen and ligands [14].
It is important to note that the perceived color appearance of a transparent mineral is a composite effect influenced by its selective absorption of light, thickness, light path length (according to the Beer-Lambert law), light sources [15], background colors [16], and human vision [17]. A material with specific selective absorption properties may appear different under varying light sources due to differences in the spectral power distribution. Additionally, metamerism can occur, where two light sources with different energy distributions can appear the same color (illuminant metamerism), or the same light can produce different color perceptions in different observers (observer metamerism). Background color also plays a crucial role; light reflected from a background can significantly alter the color of a transparent mineral. Fluorescence effects, such as those observed in pinkish-red spinel from Myanmar, can further influence color perception under daylight. Despite the use of color matching functions to predict color perception, the impact of surrounding factors is challenging to quantify precisely. This limitation has led to the development of color appearance models (CAMs). The CIECAM02 model, introduced by the Commission Internationale de l’Éclairage (CIE), was the first widely adopted model for describing perceptual color aspects [18–20]. The CAM16 model followed, building upon years of research. These models account for various perceptual factors when studying the color appearance of transparent minerals.
For precise color analysis of spinels, a modern color system such as the CIE1976 L^^a^^b^^ uniform color space system is essential. This system has been widely used in mineralogical colorimetry [21–23]. Although the CIE1931 color space system enjoyed widespread popularity in past decades, the geometric distances it represents between colors fail to closely mirror human visual perception. In contrast, despite its own limitations, the CIE1976 system offers a more favorable alternative, as it aligns more closely with how humans perceive color differences, such as distortions in the a^^-b^^ diagram and uneven hue angles. While various alternative color systems have been proposed, the CIE1976 L^^a^^b^^ system remains the standard due to its applicability and universality.
In this study, the colors of orange, red, purple, and blue spinel were analyzed under D65 and A light sources against nine Munsell neutral backgrounds. The color mechanisms of colored spinel and the effects of light sources and backgrounds on color perception were discussed. Color evaluation systems for colored spinel were established using Energy-Dispersive X-ray Fluorescence (ED-XRF), optical spectroscopy (UV-Vis-NIR), and spectrophotometry.
Materials and methods
Samples
In this research, 412 facet spinel crystals from Myanmar (Burma) were analyzed. There are 12 colored spinel crystals (from Spi-1 to Spi-12, each one weighs more than two carats) for color genesis study and chemical analysis. Besides, 100 purple, red, orange, and blue spinel crystals each for color testing (each one weighs more than one carat). All spinel crystals are in high transparency and clarity. The spinel samples were commercially obtained in 2021 from Fire Stone Jewelry Co., Ltd. in China. This study was conducted under the academic supervision and approval of Dean of the School of Gemmology, China University of Geosciences (Beijing). The research protocol was reviewed and approved by the supervisor, ensuring compliance with the laboratory safety regulations and academic ethics guidelines of the university. All experimental procedures and sample analyses were carried out in the laboratories of the School of Gemmology, with the use of facilities authorized by the supervisor.
Optical absorption spectroscopy
Optical absorption spectra were measured in the 300–800 nm range using a UV-3600 UV-Vis-NIR spectrophotometer at room temperature and a 0.5 nm spectral resolution at a scan speed of 100 nm/min. The detector conversion wavelength is 850 nm and the grating conversion wavelength is 900 nm with S/R shift.
ED-XRF analysis
The chemical composition of spinel was analyzed by Thermo Fisher Quant’X EDXRF. The conditions are as follow: 2 mm collimator; Low Za with 4 kV for 100 seconds; Low Zc with 12 kV and Al filter for 100 seconds; Mid Za with 16 kV and Pd thin filter for 100 seconds; Mid Zb with 20 kV Pd medium filter for 100 seconds.
CIE1976 Lab* uniform color space system
The color system is composed of colorimetric coordinates a^^, b^^, and lightness L^^. Thereinto, + a^^ represents red while –a^^ represents green, and +b^^ represents yellow while –b^^ represents blue. Chroma C_ab_^^ and hue angle hab^°^ should be calculated by a^^ and b^^:
To calculate the color difference of spinels, CIE DE2000 (ΔE00) formula which was recommended by CIE was applied. Compared with the CIE LAB (ΔEab^^) formula which lacks visual uniformity [24], ΔE_00_ calculates color difference more precisely in the green area, it’s an improved version of ΔE_ab_^^. The formula is as follows:
ΔL^’^, ΔC^’,^ and ΔH^’^ are lightness difference, chroma difference, and hue angle difference of a pair of color data, respectively. RT is a function to reduce the interaction between chroma and hue in the blue area. SL, SC, and SH are functions to calibrate the absence of visual uniformity of the CIE LAB formula. KL, KC, and KH are correction parameters of the environment. There are two widely used combinations of (KL, KC, and KH): CIE DE2000 (1:1:1) [25] and CIE DE2000 (2:1:1) [26]. CIE DE2000 (1:1:1) was applied in this study because it has a better perceptibility when evaluating color differences.
Colorimetric analysis
The spinel colors were acquired by an X-Rite Ci-7800 sphere benchtop spectrophotometer, measuring from 360 nm to 780 nm in a 5 nm wavelength interval in transmission mode with a 4 mm aperture. It measured for 4 seconds and used pulsed-xenon D65 calibrated lamp as illumination. The software X-Rite Color iQC was utilized to analyze and output color data. Munsell neutral value gray scales chart is a grayscale fan deck with values of 0.5/ to 9.5/, in quarter-step intervals. It is frequently used for instrumental calibration, imaging testing, or as reflection standards. Nine Munsell neutral value gray scales (glossy edition) with different gray scales or luminance factors (Yb) including N1 (Yb = 1.210%), N2 (Yb = 3.126%), N3 (Yb = 6.555%), N4 (Yb = 12.000%), N5 (Yb = 19.770%), N6 (Yb = 30.050%), N7 (Yb = 43.060%), N8 (Yb = 59.100%), and N9 (Yb = 78.660%) were utilized as backgrounds in this experiment. A standard illumination box was adopted in the experiment. Different light source has different correlated color temperature (CCT) and relative spectral power distribution. Two standard light sources including A (CCT 2856K) and D65 (CCT 6504K) were used in this research. When measuring the colors of the spinel samples, each sample was encircled by various gray scale neutral backgrounds. As light penetrated through the table (top facet) of the spinel, the majority of it escaped from the pavilion of the stone and was then reflected back by the surrounding background. Subsequently, this reflected light was reabsorbed by the spinel and redirected into the integrating sphere, which allowed for our comprehensive color measurement and analysis (Fig 1).
Color measurement experiment.
Results and discussions
Chemical analysis
Twelve chemically isotropic colored spinel crystals were analyzed using Energy-Dispersive X-ray Fluorescence (ED-XRF) (see Table 1, and S1 File). All the spinel samples are primarily composed of MgAl_2_O_4_, with the exception of one blue spinel containing a small amount of Zn (Spi-2). As an allochromatic mineral, spinel’s color cannot be solely attributed to its major elements [27–28]. Trace element analysis identified three main groups of spinel crystals: those containing Cr with minor Fe, those dominated by Fe, and those dominated by V. The key trace elements responsible for color in the investigated spinels include Fe (up to 3.30 wt% FeO_tot_), Cr (up to 1.56 wt% Cr_2_O_3_), V (up to 1.05 wt% V_2_O_3_), Co (up to 0.01 wt% Co_3_O_4_), and Mn (up to 0.09 wt% MnO), among others. According to the chemical composition plot (Fig 2), red spinel is primarily influenced by Cr, while orange color may be controlled by V. Purple, green, and blue hues in spinel are largely affected by Fe, though blue coloration may also be influenced by Co. Additionally, pink spinel may result from a combination of Fe, V, Cr, and other elements. The detailed color genesis of spinel will be further explored through UV-Vis-NIR analysis.
Table 1: EDXRF chemical compositions of investigated spinel crystals (wt%).
Normalized concentrations of FeOtot, Cr2O3, and V2O3 for the investigated spinel crystals.
Optical absorption spectroscopy
The UV-Vis-NIR spectra of the 12 investigated spinel crystals (S2 Table) were measured in the range of 300–800 nm (Fig 3). The observed absorption peaks (Table 2) are consistent with previous studies [29–33].
Table 2: Optical absorption peaks (nm) of the investigated spinel crystals.
UV-Vis-NIR spectra of investigated spinel crystals. The pictures of spinel crystals illuminated by D65 (left) and A (right) standard lamp are displayed next to the spectrum.
Iron-bearing spinel crystals, which exhibit colors such as purple, blue, and green, show similar absorption features in their spectra. Peaks around ~372 nm, and ~385 nm (labeled a and b, respectively) are attributed to spin-forbidden transitions ^5^E → ^3^E of ^T^Fe^2^, and ^5^E → ^3^T_2_ with ^3^T_1_ of ^T^Fe^2+^, respectively. Sharp peaks at ~458 nm or ~473 nm (labeled d) could be assigned to spin-forbidden ^6^A_1g_ → ^4^A_1g_, ^4^E_g_ transition of isolated ^M^Fe^3+^ ions. The peak at 596 nm (labeled g) can be assigned to either spin-forbidden ^5^E → ^3^T_1_ of ^T^Fe^2+^ or spin-allowed ^4^A_2_(F) → ^4^T_1_(P) of ^T^Co^2+^, which may also generate peaks around ~624 nm or 638 nm (labeled h) simultaneously.
In chromium-bearing spinel crystals (typically red) and vanadium-bearing spinel crystals (typically orange), which contain only trace amounts of Fe, a peak around 390 nm is observed in their optical absorption spectra. Additionally, three of the investigated orange spinel crystals (Spi-7, 8, and 9) exhibit absorption peaks around ~667 nm (labeled i). This peak is assigned to intervalence charge transfer of ^M^Fe^2+^ ↔ ^M^Fe^3+^, as well as exchange coupled pair of ^T^Fe^2+^ ↔ ^M^Fe^3+^, in line with previous research [33]. The absorption peak at 415 nm (labeled c) is attributed to spin-allowed ^4^A_2g_ → ^4^T_1g_(F) of ^M^Cr^3+^, while the peak around ~540 nm (labeled e) is assigned to the spin-allowed ^4^A_2g_ → ^4^T_2g_(F) of ^M^Cr^3+^. Finally, the absorption peak at ~550 nm (labeled f) is attributed to spin-allowed ^3^T_1_(F) → ^3^T_2_(F) of ^M^V^3+^.
Color analysis
Gem crystals can be categorized into isotropic and anisotropic types based on their crystallization structures [34]. Understanding crystallization is crucial when measuring crystal colors, as anisotropic crystals exhibit pleochroism, meaning they absorb light differently depending on the direction of observation. In contrast, isotropic crystals absorb light uniformly in all directions. Furthermore, gem crystals are typically cut and polished into facet stones to enhance their vivid colors, brilliance, and clarity. The facets of a gemstone refract and reflect light, creating a vibrant appearance that intensifies its color.
While there is research on calculating color from the table of anisotropic gemstones, such as chrysoberyl [35], measuring color from gemstone tables presents challenges due to the variability in cutting styles. This paper focuses on spinel, an isotropic crystal that does not exhibit pleochroism. To avoid uncertainties introduced by facets, we measured and observed the colors from the pavilion of faceted spinel crystals—a method long used in the evaluation of near-colorless diamonds [36].
Different light sources have distinct correlated color temperatures (CCT) and relative spectral power distributions (RSPD). Standard light sources include A (2856K), F12 (3000K), F11 (4000K), F2 (4230K), D50 (5003K), D65 (6504K), and D75 (7500K), among others. The A light source, an incandescent lamp commonly used in homes and stores, predominantly emits light in the yellow and red wavelengths. In contrast, D65 light sources simulate average daylight in the Northern Hemisphere [37] and are widely used in color evaluation across various industries. Since A and D65 are common in daily settings and bright fields are preferable for assessing gemstone colors, this study examines the color effects of A and D65 light sources on spinel crystals against a Munsell N9 neutral background (luminance factor = 0.78660, lightness = 91.08).
The colors of 400 investigated spinel crystals were measured using a spectrophotometer (see Table 3, and S3 Table). Illumination with a D65 light source revealed the following color metrics:
Table 3: Colors of spinel crystals under D65 and A standard light source.
Orange Spinel Crystals: Lightness ranged from 52.01 to 73.57, with an average of 62.50. Chroma ranged from 10.80 to 26.85, averaging 20.43. Hue angles varied from 31.07° to 63.10°, with an average of 47.84°.
Red Spinel Crystals: Lightness ranged from 50.50 to 75.69, with an average of 62.16. Chroma ranged from 13.58 to 30.55, averaging 23.13. Hue angles ranged from −10.78° (349.22°) to 18.89°, with an average of 3.31°.
Purple Spinel Crystals: Lightness ranged from 52.19 to 82.55, with an average of 65.31. Chroma ranged from 3.76 to 12.15, averaging 9.66. Hue angles ranged from −21.45° (338.55°) to −9.30° (350.70°), with an average of −14.03° (345.97°).
Blue Spinel Crystals: Lightness ranged from 51.27 to 74.36, with an average of 61.60. Chroma ranged from 2.90 to 6.14, averaging 4.74. Hue angles ranged from −1.64° (358.36°) to 19.84°, with an average of 9.07°.
Under A light source, the color metrics were as follows
Orange Spinel Crystals: Lightness ranged from 55.15 to 74.71, with an average of 65.16. Chroma ranged from 14.07 to 33.34, averaging 25.87. Hue angles ranged from 32.53° to 48.11°, with an average of 41.74°.
Red Spinel Crystals: Lightness ranged from 54.09 to 76.92, with an average of 64.66. Chroma ranged from 14.15 to 36.42, averaging 25.86. Hue angles ranged from −3.12° (356.88°) to 24.51°, with an average of 10.86°.
Purple Spinel Crystals: Lightness ranged from 53.04 to 82.84, with an average of 66.14. Chroma ranged from 4.33 to 12.61, averaging 9.90. Hue angles ranged from −13.56° (346.44°) to 1.71°, with an average of −4.18° (355.82°).
Blue Spinel Crystals: Lightness ranged from 50.65 to 74.03, with an average of 61.05. Chroma ranged from 2.41 to 5.18, averaging 4.47. Hue angles ranged from 19.82° to 41.23°, with an average of 32.80°.
Significant color differences between the four types of spinel crystals were observed when illuminated by D65 versus A light sources, corresponding to visible changes perceived by the naked eye. Notably, the color differences were significant for orange and red spinel crystals but less so for purple and blue spinel crystals.
When illuminated by both D65 and A light sources, the chroma of orange spinel crystals showed a positive correlation with the color parameter a^***^, while the hue angle exhibited a negative correlation (Fig 4a). This suggests that the chroma and hue of orange spinel are influenced by the red tone under both daylight and incandescent lighting conditions.
Correlations between color parameters (lightness L, chroma C*, hue angle ho, color parameter a* and b*) of orange (a), red (b), purple (c), and blue (d) spinel crystals under standard D65 and A lamps.*
For red spinel crystals, both chroma and hue angle positively correlated with the color parameters a^^ and b^^ (Fig 4b). This indicates that red and yellow tones significantly enhance the color of red spinel.
In the case of purple spinel, chroma exhibited a linear positive correlation with a^^ under both D65 and A light sources, while the hue angle showed a positive correlation with -b^^ (Fig 4c). This strongly suggests that chroma is significantly influenced by a^***^ in purple spinel, and its hue is more readily affected by the blue tone.
Blue spinel crystals displayed distinct trends in the relationship between color parameters. The chroma of blue spinel negatively correlated with -a^^, and the hue negatively correlated with -b^^ (Fig 4d). This indicates that the chroma of blue spinel is influenced by the green tone, while its hue is affected by the blue tone, which is consistent with expectations.
The light source is not the sole factor affecting the color of spinel crystals; background color also plays a significant role due to the high transparency of spinel. Therefore, considering the background color is crucial during color analysis and research. In this study, we analyzed and discussed the colorimetric characteristics of spinel under D65 and A light sources across nine Munsell neutral background colors.
The Munsell neutral value gray scales, also known as a Munsell gray scale or neutral color chart is a gray scale fan deck. Its lightness Lb^**^ has a power function relationship with its luminance factor Y_b*_, which is as follows:
Due to the high grade of transparency of spinel, spinel colors should have a similar power function when the background color changes as Munsell gray scales. The colors were analyzed and presented in Fig 5 (orange), Fig 6 (red), Fig 7 (purple), and Fig 8 (blue). The lightness and chroma of all spinel colors increase significantly with the luminance factor of Munsell neutral background in power function relationship with different rate. However, the hue angle has no significant changes in the same process because gray could hardly affect other hue. The color parameters of some of the investigated spinel crystals show the similar trend with chroma because they have strong relation with each other for some specific color.
The color characteristic of orange spinel crystals on the nine Munsell neutral backgrounds under D65 and A standard light sources.
The color characteristic of red spinel crystals on the nine Munsell neutral backgrounds under D65 and A standard light sources.
The color characteristic of purple spinel crystals on the nine Munsell neutral backgrounds under D65 and A standard light sources.
The color characteristic of blue spinel crystals on the nine Munsell neutral backgrounds under D65 and A standard light sources.
For yellow, red, purple, and blue spinel crystals, the power function relations between lightness and background luminance factor under two light sources are as follow:
There are similar relationships between chroma and background luminance factor:
The colors of spinel crystals could be easily predicted by the equations above by the luminance factor of the background under different light source.
Color clustering
Clustering is an explorative data analysis technique used for investigating the underlying structure in the data. It described as the grouping of objects, where the objects share similar characteristics [38]. The classic K-means clustering algorithm finds cluster centroids that minimize the distance between data points and the nearest centroid [39]. K-means clustering analysis is effective and it has been applied in gemstone color research for the latest five years [40–41].
In this study, the K-means clustering method was utilized to categorize and classify the colors of four types of spinel crystals based on their lightness and chroma, using the Munsell color system. To ensure objectivity and universality, color clustering was performed on spinel crystals illuminated by the D65 standard light source against a Munsell N9 neutral background.
The analysis was conducted using OriginPro software (version 2024b). The clustering results were notably improved when each type of spinel color was divided into three groups (Table 4). The color differences between these three groups for each type of spinel are sufficiently large to be perceptible to the human eye, surpassing the minimum color tolerance threshold [42]. For instance, the clustering analysis for orange spinel crystals yielded a P-value of 0.00139, indicating a significant result. This finding suggests that orange spinel colors can be effectively grouped into three distinct categories based on variations in lightness and chroma (Fig 9). Similarly, significant P-values of 0.01661, < 0.001, and 0.01135 were obtained for red (Fig 10), purple (Fig 11), and blue (Fig 12) spinel crystals, respectively. These results demonstrate the effectiveness of the clustering approach in distinguishing between different spinel colors and underscore its importance in developing a reliable color grading system for spinel.
Table 4: K-means clustering analysis of four types of spinel crystals.
The color clustering of orange spinel crystals according to lightness and chroma.
The color clustering of red spinel crystals according to lightness and chroma.
The color clustering of purple spinel crystals according to lightness and chroma.
The color clustering of blue spinel crystals according to lightness and chroma.
Conclusions
Both the chroma and hue of orange spinel crystals are influenced by the red tone under both daylight and incandescent lighting conditions. In contrast, red and yellow tones significantly enhance the color of red spinel crystals. For purple spinel, chroma shows a strong correlation with the a^***^ parameter under both D65 and A light sources, while the hue is readily affected by blue tones. Blue spinel, on the other hand, has its chroma controlled by green tones and its hue influenced by blue tones.
The lightness and chroma of all spinel colors increase significantly with the luminance factor of the Munsell neutral background, following a power function relationship at different rates. However, the hue angle remains relatively unchanged during this process, as gray backgrounds have minimal impact on hue. The colors of spinel crystals can be effectively predicted using calculated equations based on the luminance factor of the background under various light sources. Additionally, employing the K-means clustering method to separate each spinel color into three groups proves effective in classifying the colors.
Supporting information
S1 FileChemical compositions of the spinels.(DOCX)
S2 TableUV-Vis spectra of the spinels.(XLSX)
S3 TableColor data of the spinels.(XLSX)
S4Inclusivity-in-global-research-questionnaire.(DOCX)
The reference list from the paper itself. Each links out to its DOI / PubMed record.
- 1Cuthill IC, Allen WL, Arbuckle K, Caspers B, Chaplin G, Hauber ME, et al. The biology of color. Science. 2017;357(6350):eaan 0221. doi: 10.1126/science.aan 0221 28774901 · doi ↗ · pubmed ↗
- 2Conway BR, Malik-Moraleda S, Gibson E. Color appearance and the end of Hering’s Opponent-Colors Theory. Trends Cogn Sci. 2023;27(9):791–804. doi: 10.1016/j.tics.2023.06.003 37394292 PMC 10527909 · doi ↗ · pubmed ↗
- 3Halenius U, Bosi F. Color of Mn-bearing gahnite: A first example of electronic transitions in heterovalent exchange coupled IV Mn 2+-VI Mn 3+ pairs in minerals. American Mineralogist. 2014;99(2–3):261–6. doi: 10.2138/am.2014.4670 · doi ↗
- 4Zhao Q, Yan Z, Chen C, Chen J. Spinels: Controlled Preparation, Oxygen Reduction/Evolution Reaction Application, and Beyond. Chem Rev. 2017;117(15):10121–211. doi: 10.1021/acs.chemrev.7b 00051 28745484 · doi ↗ · pubmed ↗
- 5Wang M, Wang M, Qi Y, Xue Y, Shi G. Chemical Composition and Spectral Characteristics of Different Colored Spinel Varieties from Myanmar. Minerals. 2024;14(11):1124. doi: 10.3390/min 14111124 · doi ↗
- 6Pardieu V. Hunting for “Jedi” Spinels in Mogok. G&G. 2014;50(1):46–57. doi: 10.5741/gems.50.1.46 · doi ↗
- 7Wu J, Sun X, Ma H, Ning P, Tang N, Ding T, et al. Purple-Violet Gem Spinel from Tanzania and Myanmar: Inclusion, Spectroscopy, Chemistry, and Color. Minerals. 2023;13(2):226. doi: 10.3390/min 13020226 · doi ↗
- 8Chauvire B, Rondeau B, Fritsch E, Ressigeac P, Devidal J-L. Blue Spinel from the Luc Yen District of Vietnam. G&G. 2015;51(1):2–17. doi: 10.5741/gems.51.1.2 · doi ↗