HIV-1 Nef synergizes with APOL1-G1 to induce nephrocyte cell death in HIV-related kidney diseases
Jun-yi Zhu, Yulong Fu, Joyce van de Leemput, Jing Yu, Jinliang Li, Patricio E. Ray, Zhe Han

TL;DR
Researchers found that HIV-1 Nef and APOL1-G1 work together to cause kidney cell death through ER stress, offering a new treatment target for HIV-related kidney diseases.
Contribution
This study identifies endoplasmic reticulum stress as a novel converging mechanism for the synergy between HIV-1 Nef and APOL1-G1 in inducing nephrocyte cell death.
Findings
HIV-1 Nef synergizes with APOL1-G1 to cause nephrocyte structural and functional defects.
ER stress is a key driver of nephrocyte dysfunction and cell death in this synergy.
ER stress is proposed as a new therapeutic target for HIV- and APOL1-related kidney diseases.
Abstract
People carrying two APOL1 risk alleles (RA) – G1 or G2 – are at greater risk of developing human immunodeficiency virus (HIV)-associated nephropathy (HIVAN). However, it remains unclear whether the encoded protein(s) (APOL1-RA) and HIV-1 Nef interact to induce podocyte cell death. Here, we generated transgenic flies that express APOL1-G1 (derived from a child with HIVAN) and HIV-1 nef specifically in the nephrocytes, the fly equivalent of mammalian podocytes, and assessed their individual and combined effects on the nephrocyte filtration structure and function. We found that HIV-1 Nef acts in synergy with APOL1-G1, resulting in nephrocyte structural and functional defects, and that Nef exacerbates the organelle acidification defects and autophagy reduction induced by APOL1-G1. The synergy between HIV-1 Nef and APOL1-G1 is built on their joint effects on elevating endoplasmic reticulum…
Genes, proteins, chemicals, diseases, species, mutations and cell lines named across the full text — each resolved to its canonical identifier and authoritative record.
Click any figure to enlarge with its caption.
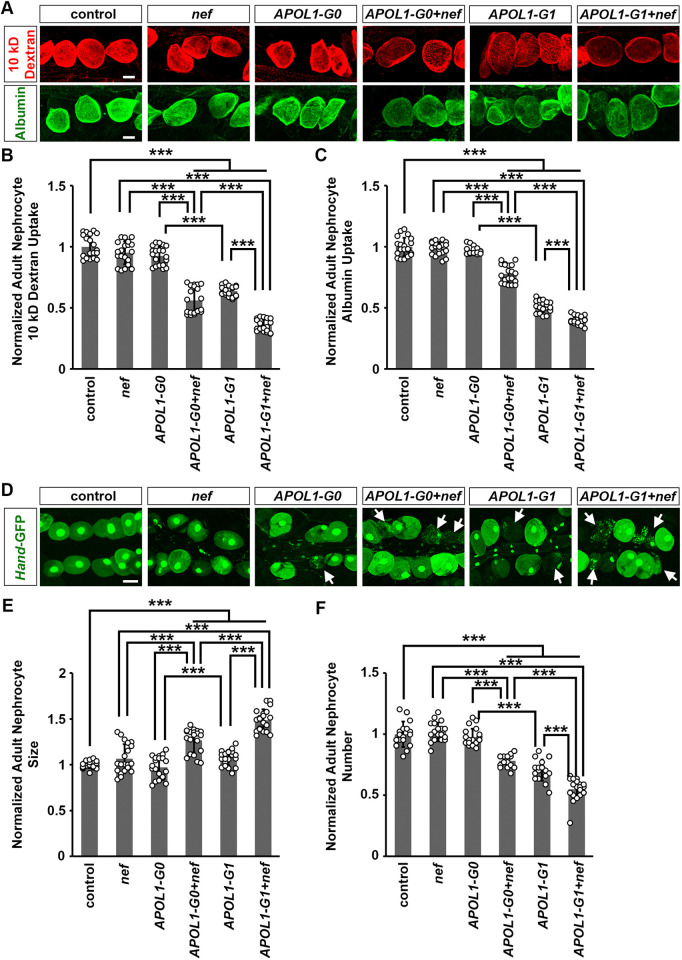 Fig. 1
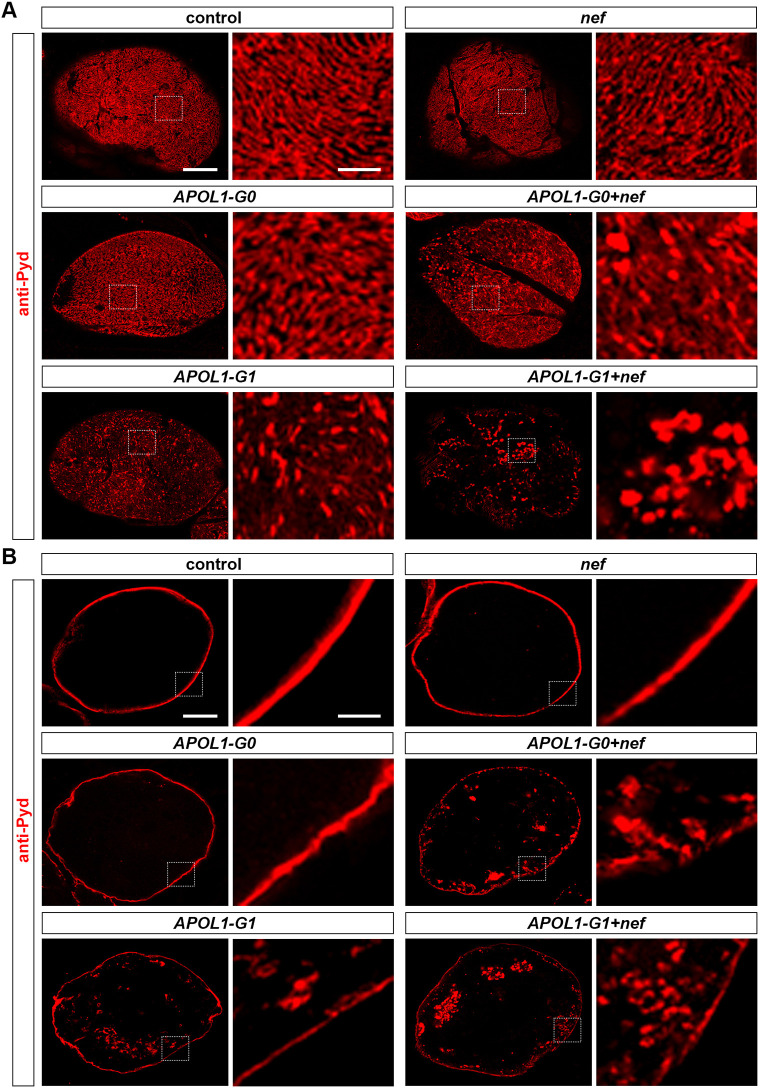 Fig. 2
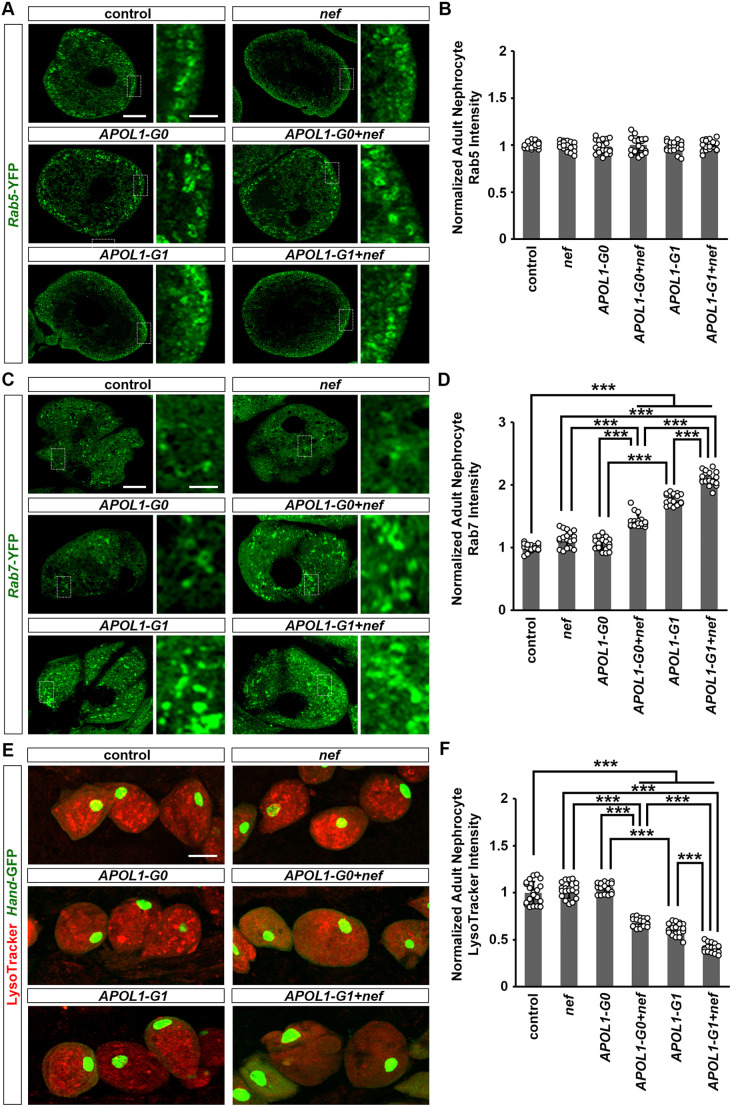 Fig. 3
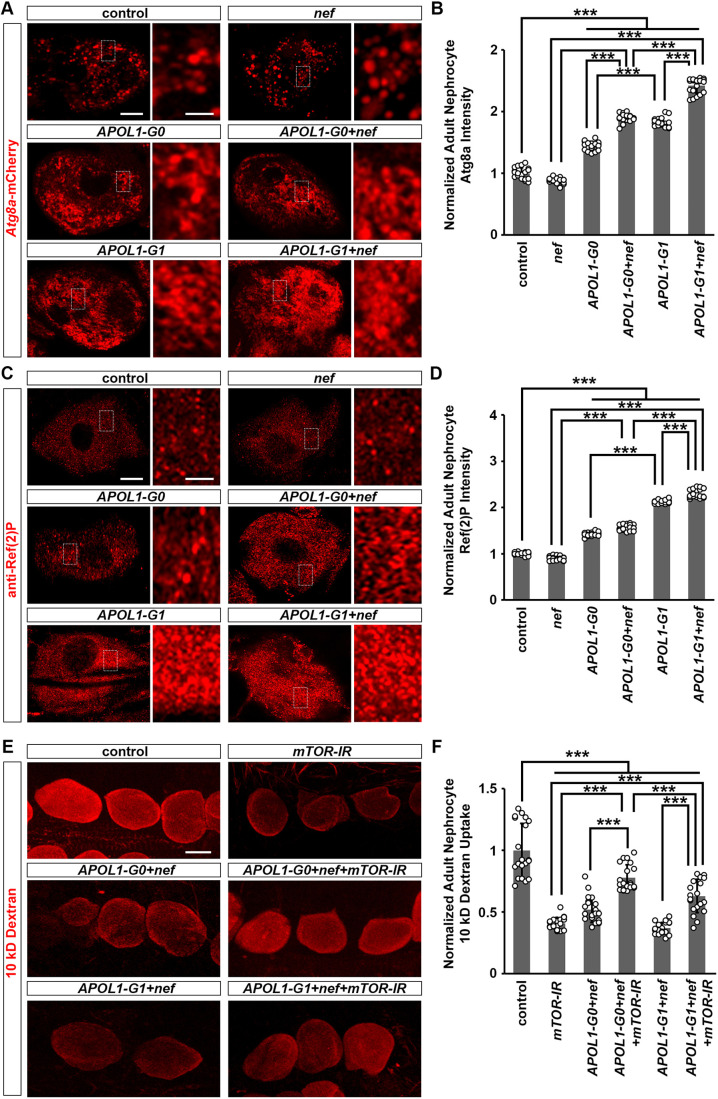 Fig. 4
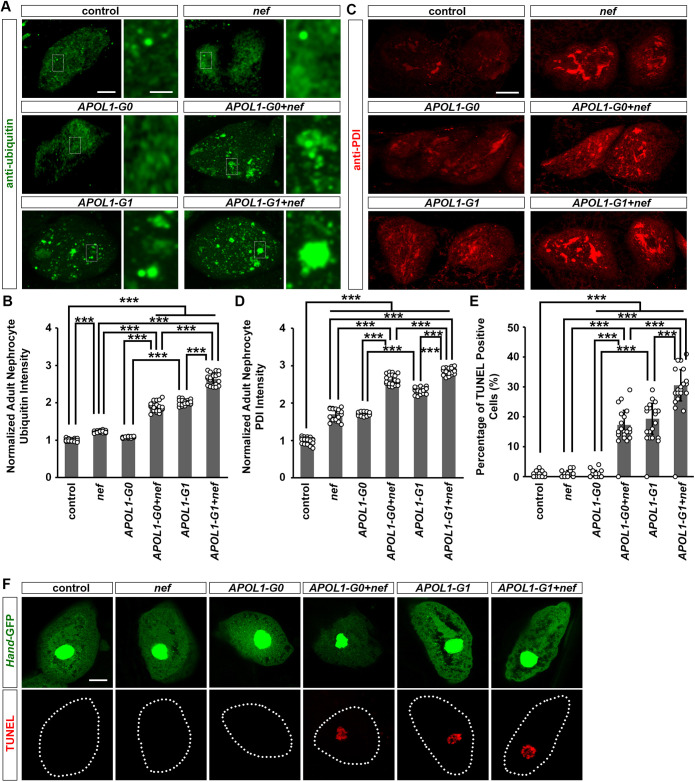 Fig. 5
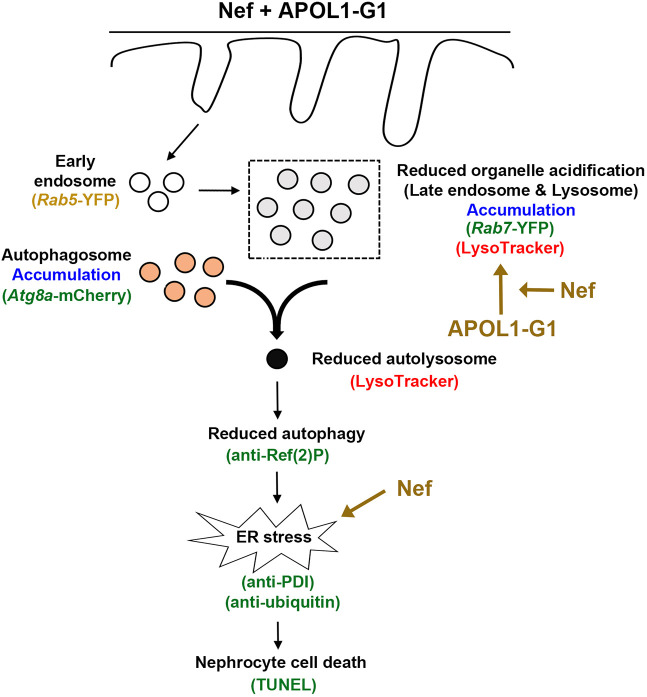 Fig. 6
- —National Institute of Diabetes and Digestive and Kidney Diseaseshttp://dx.doi.org/10.13039/100000062
- —School of Medicine, University of Marylandhttp://dx.doi.org/10.13039/100017046
Peer Reviews
No public reviews on file for this paper yet. If you reviewed it on a platform where reviews are public (OpenReview, ICLR, NeurIPS, ICML), you can paste yours below so the community can read it here.
Videos
No videos yet. Explain this paper in a talk, walkthrough, or lecture? Add one.
Taxonomy
TopicsRenal Diseases and Glomerulopathies · Chronic Kidney Disease and Diabetes · Genetic and Kidney Cyst Diseases
INTRODUCTION
Human immunodeficiency virus (HIV)-associated nephropathy (HIVAN) is a kidney disease characterized by heavy proteinuria and rapid progression to chronic kidney failure (Ross, 2014; Swanepoel et al., 2018). HIVAN renal histology shows collapsing glomerulopathy, de-differentiation and proliferation of podocytes and glomerular parietal epithelial cells, development of focal and segmental glomerulosclerosis (FSGS), and microcystic dilatation of renal tubules, leading to kidney enlargement (Ross, 2014; Swanepoel et al., 2018). People of African descent are at increased risk of developing HIVAN. Their risk to develop HIVAN or another chronic kidney disease is strongly associated with two apolipoprotein L1 (APOL1) risk alleles (APOL1-RA), G1 and G2 (Kopp et al., 2011; Kasembeli et al., 2015). People living with HIV-1 that carry two copies of the APOL1-RA have a ∼50% lifetime risk of developing HIVAN (Kopp et al., 2011; Kasembeli et al., 2015; Rednor and Ross, 2018), and poorly controlled HIV-1 infection is the most powerful factor known to contribute to APOL1-associated kidney diseases (Kasembeli et al., 2015). However, to date, the basic mechanisms through which the APOL1-RA interact with HIV-1 to cause HIVAN remain unclear.
Mice and rats do not have an APOL1 ortholog, nor can they be infected with HIV-1 (Keppler et al., 2002; Baumann et al., 2004). Nonetheless, transgenic (Tg) rodent models have been used to characterize the molecular mechanism through which the APOL1-RA and HIV-1 genes induce renal diseases (Li et al., 2017; Yoshida et al., 2023). HIV-Tg26 mice and rats carrying a replication-defective HIV-1 construct (driven by HIV long terminal repeat, lacking a 3 kb sequence with the gag and pol genes, which are essential for viral replication), showed that the expression of HIV genes in podocytes and tubular epithelial cells plays a critical role in inducing HIVAN in rodents (Kajiyama et al., 2000; Ray et al., 2003; Zuo et al., 2006; Lu et al., 2008; Xie et al., 2014; Hu et al., 2023). In addition, several HIV-Tg mouse models showed that the HIV accessory protein negative factor (Nef), is a key determinant of HIVAN pathogenesis (Kajiyama et al., 2000; Ray et al., 2003; Zuo et al., 2006; Lu et al., 2008; Xie et al., 2014; Hu et al., 2023). Studies in cultured kidney cells and APOL1 Tg mice found that the expression levels and localization of APOL1 are crucial in determining its cytotoxicity (Fu et al., 2017a; O'Toole et al., 2018; McCarthy et al., 2021; Bruggeman et al., 2019). Notably, different dual APOL1-HIV-Tg26 mouse models have generated conflicting results, supporting either toxicity or protection (Fu et al., 2017a; Zhang et al., 2013). Thus, it remains unclear whether HIV-1 Nef and APOL1-RA interact directly to induce HIVAN, underlining the need for new animal models.
Drosophila is an established model for kidney diseases and development (O'Toole et al., 2018; Fu et al., 2017b; Hermle et al., 2017; Kruzel-Davila et al., 2017; Gerstner et al., 2022; Rani and Gautam, 2018; Weavers et al., 2009). The fly nephrocyte is equivalent to the mammalian podocyte, with a highly conserved filtration structure called the slit diaphragm (Zhuang et al., 2009; Wang et al., 2021; Lang et al., 2022; Zhu et al., 2023). They also share many other similarities in endocytosis and exocytosis for the formation and maintenance of the filtration structure (Zhuang et al., 2009; Wang et al., 2021; Lang et al., 2022; Zhu et al., 2023). A majority of genes associated with kidney diseases have functional homologs in flies that are required for nephrocyte function (Hermle et al., 2017; Weavers et al., 2009). The Drosophila nephrocyte has been well established to study the pathogenesis of APOL1-associated nephropathies (O'Toole et al., 2018; Gerstner et al., 2022; Rani and Gautam, 2018; Lee et al., 2023; Han and Olson, 2005). Here, we generated Tg flies that express HIV-1 nef and APOL1-G1, the most frequent risk variant, specifically in nephrocytes. Our findings indicate that Nef and APOL1-G1 act synergistically to induce nephrocyte cell death through the endoplasmic reticulum (ER) stress pathway, providing a potential therapeutic target for HIV-1- and APOL1-associated nephropathies.
RESULTS
HIV-1 Nef exacerbates APOL1-G1-induced nephrocyte dysfunction
We previously generated Tg Drosophila lines with nephrocyte-specific expression of APOL1-G0 or the APOL1-G1 risk allele derived from a child with HIVAN (O'Toole et al., 2018). Here, we generated Tg flies with nephrocyte-specific expression of HIV-1 nef to explore how it alone or combined with APOL1 affects the structure and function of nephrocytes. In our previous studies (Fu et al., 2017a; Lee et al., 2023), we used female flies to demonstrate that APOL1 toxicity is dose dependent. At 22°C, APOL1-G0 flies showed no detectable phenotype at days 1 and 20, whereas APOL1-G1 flies exhibited significant toxicity as early as day 1, which became even more pronounced by day 20. Based on these findings, we selected 20-day-old female flies for this study to maintain consistency with our previous results.
We determined the capacity of dissected nephrocytes to filter and endocytose 10 kDa dextran or larger FITC-albumin particles. Neither HIV-1 nef- nor APOL1-G0-expressing nephrocytes showed a reduction in uptake of dextran or FITC-albumin (Fig. 1A-C). Nephrocytes expressing APOL1-G0+nef or APOL1-G1+nef showed significantly decreased uptake of dextran and FITC-albumin compared to those expressing nef, APOL1-G0 or APOL1-G1, with the greatest reduction in APOL1-G1+nef-expressing nephrocytes (Fig. 1A-C), reflecting the higher toxicity of the APOL1-G1 risk allele. These results show that HIV-1 Nef exacerbates APOL1-induced nephrocyte dysfunction.
*Expression of HIV-1 protein Nef facilitated nephrocyte function reduction, hypertrophy and cell death due to APOL1-G1. Flies used (20-day-old adult females): control (Dot>w1118); nef [Dot>nef-overexpression (OE)]; APOL1-G0 (Dot>APOL1-G0-OE); APOL1-G1 (Dot>APOL1-G1-OE); APOL1-G0+nef (Dot>APOL1-G0-OE+nef-OE); APOL1-G1+nef (Dot>APOL1-G1-OE+nef-OE). (A) Top: 10 kDa fluorescent dextran particle uptake (red) by nephrocytes using the nephrocyte-specific driver Dot-Gal4 to express HIV-1 nef alone or together with APOL1-G0 and APOL1-G1 at 22°C. Bottom: FITC-albumin particle uptake (green) by nephrocytes using the nephrocyte-specific driver Dot-Gal4 to express HIV-1 nef alone or together with APOL1-G0 and APOL1-G1 at 22°C. Scale bars: 15 µm. (B) Quantitation of 10 kDa dextran uptake, relative to uptake in control flies. n=20 flies, per group. (C) Quantitation of FITC-albumin uptake, relative to uptake in control flies. n=20 flies, per group. (D) Representative images of nephrocytes using the nephrocyte-specific driver Dot-Gal4 to express HIV-1 nef alone or together with APOL1-G0 and APOL1-G1 at 22°C. Scale bar: 25 µm. (E) Quantitation of adult nephrocyte size, relative to size in control flies. n=20 flies, per group. (F) Quantitation of adult nephrocyte number, relative to cell number in control flies. n=20 flies, per group. Results are presented as mean±s.d., normalized to the control group. Kruskal–Wallis H-test followed by a Dunn's test; **P<0.001.
Combined HIV-1 Nef and APOL1 cause nephrocyte hypertrophy and cell death
Previously, we showed that APOL1-G1 induces progressive hypertrophy and accelerated cell death in nephrocytes (O'Toole et al., 2018). Hypertrophy was validated here in 20-day-old fly nephrocytes expressing APOL-G1 (Fig. 1D,E). Nephrocytes expressing HIV-1 nef or APOL1-G0 did not show a significant change in size, whereas those expressing APOL1-G0+nef or APOL1-G1+nef were significantly larger, with APOL1G1+nef nephrocytes the largest (Fig. 1E).
We observed reduced nephrocyte numbers in 20-day-old APOL1-G1 Tg flies (Fig. 1D,F). However, we did not observe significant changes in nephrocyte numbers in flies expressing HIV-1 nef or APOL1-G0 (Fig. 1F). In contrast, flies expressing APOL1-G0+nef or APOL1-G1+nef showed a significant reduction in nephrocyte number compared to those expressing APOL1-G0 or APOL1-G1, with numbers lowest in flies expressing APOL1-G1+nef (Fig. 1F). These results show that HIV-1 Nef combined with APOL1-G1 exacerbates the damage to and loss of nephrocytes.
HIV-1 Nef and APOL1-G1 combined disrupt the slit diaphragm filtration structure
The Drosophila slit diaphragm is a highly organized structure critical for nephrocyte filtration (Zhuang et al., 2009). Thus, we assessed the localization of the slit diaphragm protein Polychaetoid [Pyd; homolog of human tight junction protein ZO-1 (also known as TJP1)] (Lang et al., 2022). Control nephrocytes showed the typical fingerprint-like localization pattern of Pyd on the cell surface (Fig. 2A) and the characteristic continuous circular ring in the optical medial view (Fig. 2B). Notably, nephrocytes expressing nef or APOL1-G0 did not show visible disruption of Pyd (Fig. 2A,B). However, nephrocytes expressing APOL1-G0+nef or APOL1-G1+nef showed highly disorganized Pyd localization, more so than for those expressing either APOL1 risk variant alone. Moreover, mislocalized Pyd was most evident in nephrocytes that expressed APOL1-G1+nef (Fig. 2A,B), consistent with the altered uptake observed in nephrocytes expressing nef and APOL1-G1 (Fig. 1), which indicates a disrupted slit diaphragm filtration structure.
Expression of HIV-1 protein Nef in nephrocytes facilitated disruption of the slit diaphragm due to APOL1-G1. Flies used (20-day-old adult females): control (Dot>w1118); nef (Dot>nef-OE); APOL1-G0 (Dot>APOL1-G0-OE); APOL1-G1 (Dot>APOL1-G1-OE); APOL1-G0+nef (Dot>APOL1-G0-OE+nef-OE); APOL1-G1+nef (Dot>APOL1-G1-OE+nef-OE). (A,B) Localization of the slit diaphragm protein Polychaetoid (Pyd; red) in surface (A) and medial (B) optical sections in nephrocytes using the nephrocyte-specific driver Dot-Gal4 to express HIV-1 nef alone or together with APOL1-G0 and APOL1-G1 at 22°C. Boxed areas are shown magnified next to each image. Scale bars: 5 μm; 1 μm (magnified).
Combined HIV-1 Nef and APOL1-G1 exert detrimental effects on nephrocyte endocytosis
We previously showed that HIV-1 can infect cultured human podocytes via dynamin-dependent endocytosis in a process facilitated by transmembrane TNF-α (also known as TNF) (Li et al., 2017). Here, we assayed the expression of early (Rab5) and late (Rab7) endosomal markers in Drosophila nephrocytes. In Drosophila nephrocytes, Rab7 puncta can appear as circles in normal conditions. Neither expression of nef, APOL1-G0 or APOL1-G1, nor their combination, induced changes in the expression level or localization of Rab5 (Fig. 3A,B). In contrast, Rab7 protein levels were significantly increased in nephrocytes expressing APOL1-G1, but not in those expressing nef or APOL1-G0 (Fig. 3C,D). Nephrocytes expressing APOL1-G0+nef or APOL1-G1+nef had significantly higher Rab7 protein levels, with the highest expression levels in APOL1-G1+nef nephrocytes (Fig. 3C,D).
*Expression of HIV-1 protein Nef in nephrocytes facilitated the disruption in endocytic membrane trafficking due to APOL1-G1. (A,B) Flies used (20-day-old adult females): control (Dot>Rab5-YFP); nef (Dot>Rab5-YFP +nef-OE); APOL1-G0 (Dot>Rab5-YFP+APOL1-G0-OE); APOL1-G1 (Dot>Rab5-YFP+APOL1-G1-OE); APOL1-G0+nef (Dot>Rab5-YFP+APOL1-G0-OE+nef-OE); APOL1-G1+nef (Dot>Rab5-YFP+APOL1-G1-OE+nef-OE). (C,D) Flies used (20-day-old adult females): control (Dot>Rab7-YFP); nef (Dot>Rab7-YFP +nef-OE); APOL1-G0 (Dot>Rab7-YFP+APOL1-G0-OE); APOL1-G1 (Dot>Rab7-YFP+APOL1-G1-OE); APOL1-G0+nef (Dot>Rab7-YFP+APOL1-G0-OE+nef-OE); APOL1-G1+nef (Dot>Rab7-YFP+APOL1-G1-OE+nef-OE). (E,F) Flies used (20-day-old adult females): control (Hand-GFP, Dot>GFP+w1118); nef (Hand-GFP, Dot>nef-OE); APOL1-G0 (Hand-GFP, Dot>APOL1-G0-OE); APOL1-G1 (Hand-GFP, Dot>APOL1-G1-OE); APOL1-G0+nef (Hand-GFP, Dot>APOL1-G0-OE+nef-OE); APOL1-G1+nef (Hand-GFP, Dot>APOL1-G1-OE+nef-OE). (A) Expression of endocytosis-related protein Rab5 (green, early endosome) in nephrocytes using the nephrocyte-specific driver Dot-Gal4 to express HIV-1 nef alone or together with APOL1-G0 and APOL1-G1 at 22°C. Boxed areas are shown magnified next to each image. Scale bars: 5 μm; 1 μm (magnified). (B) Quantitation of Rab5 fluorescence intensity, relative to fluorescence in control nephrocytes. n=20 flies, per group. None of the comparisons between groups were significant. (C) Expression of endocytosis-related protein Rab7 (green, late endosome) in nephrocytes using the nephrocyte-specific driver Dot-Gal4 to express HIV-1 nef alone or together with APOL1-G0 and APOL1-G1 at 22°C. Boxed areas are shown magnified next to each image. Scale bars: 5 μm; 1 μm (magnified). (D) Quantitation of Rab7 fluorescence intensity, relative to fluorescence in control nephrocytes. n=20 flies, per group. (E) LysoTracker dye fluorescence level (red) in nephrocytes using the nephrocyte-specific driver Dot-Gal4 to express HIV-1 nef alone or together with APOL1-G0 and APOL1-G1 at 22°C. Hand-GFP transgene expression was visualized as green fluorescence concentrated in the nuclei of nephrocytes. Scale bar: 15 μm. (F) Quantitation of LysoTracker dye fluorescence intensity, relative to fluorescence in control nephrocytes. n=20 flies, per group. Results are presented as mean±s.d., normalized to the control group. Kruskal–Wallis H-test followed by a Dunn's test; **P<0.001.
We also showed previously that APOL1-G1 altered the acidification of organelles and lysosomes in nephrocytes, which could impair their function (O'Toole et al., 2018). Here, we used LysoTracker to examine acidic vacuoles and lysosomes in nephrocytes with nef and APOL1 expression. LysoTracker signal was significantly reduced in nephrocytes expressing APOL1-G1, but not in those expressing nef or APOL1-G0 (Fig. 3E,F). Nephrocytes expressing APOL1-G0+nef or APOL1-G1+nef showed significantly lower LysoTracker signals (Fig. 3E,F). Moreover, APOL1-G1+nef nephrocytes had the lowest signal (Fig. 3E,F). These findings indicate that HIV-1 Nef exacerbates the changes induced by APOL1-G1 in key endocytic and acidification pathways that are essential for nephrocyte function.
HIV-1 Nef enhances APOL1-G1-induced autophagic changes, with accumulation of autophagosomes in fly nephrocytes
APOL1 can modulate autophagy in various experimental model systems (Fu et al., 2017a; McCarthy et al., 2021; Gerstner et al., 2022; Lee et al., 2023; Chang et al., 2019; Chun et al., 2019; Gatica et al., 2018). In Drosophila, Autophagy-related 8a (Atg8a), the equivalent of human LC3 (also known as MAP1LC3A), is a widely used marker of autophagy. Nephrocytes expressing nef showed no alteration in Atg8a-mCherry, but those expressing nef together with APOL1 showed significantly higher levels of Atg8a-mCherry, with the highest level of Atg8a found in APOL1-G1+nef-expressing nephrocytes (Fig. 4A,B). Normally, higher levels of Atg8a indicate increased autophagy (Nagy et al., 2015). However, when we examined the consequence of autophagy using the antibody against Ref(2)P, a marker of cargo destined to be degraded by autophagy (Spitz et al., 2022), we found that Ref(2)P levels actually increased in nephrocytes with APOL1-G1 or APOL1-G1+nef expression (Fig. 4C,D), suggesting a reduced level of autophagy. Similar to the Atg8a results, the increase in Ref(2)P level was exacerbated in APOL-G1+nef-expressing nephrocytes (Fig. 4C,D). To determine whether inhibiting mTor signaling, which can increase autophagy in Drosophila nephrocytes (Spitz et al., 2022), could rescue the nephrocyte function decline caused by APOL1 and Nef expression, we expressed APOL1 and nef together with mTor knockdown in Drosophila nephrocytes. We observed that mTor knockdown alone led to reduced nephrocyte function and decreased cell size. Interestingly, co-expression of mTor RNA interference with either APOL1-G0+nef or APOL1-G1+nef particularly rescued the nephrocyte functional defects (Fig. 4E,F). These findings suggest that autophagy plays a specific role in mediating the toxicity induced by the combined expression of APOL1 and Nef in nephrocytes.
*HIV-1 Nef exacerbated autophagy defects induced by APOL1-G1 in nephrocytes. (A,B) Flies used (20-day-old adult females): control (Dot>Atg8a-mCherry); nef (Dot>Atg8a-mCherry+nef-OE); APOL1-G0 (Dot>Atg8a-mCherry+APOL1-G0-OE); APOL1-G1 (Dot>Atg8a-mCherry+APOL1-G1-OE); APOL1-G0+nef (Dot>Atg8a-mCherry+APOL1-G0-OE+nef-OE); APOL1-G1+nef (Dot>Atg8a-mCherry +APOL1-G1-OE+nef-OE). (C,D) Flies used (20-day-old adult females): control (Dot>w1118); nef (Dot>nef-OE); APOL1-G0 (Dot>APOL1-G0-OE); APOL1-G1 (Dot>APOL1-G1-OE); APOL1-G0+nef (Dot>APOL1-G0-OE+nef-OE); APOL1-G1+nef (Dot>APOL1-G1-OE+nef-OE). (E,F) Flies used (20-day-old adult females): control (Dot>w1118); mTor RNA interference (mTor-IR) (Dot>mTor-IR); APOL1-G0+nef+mTor-IR (Dot>APOL1-G0-OE+nef-OE+mTor-IR), APOL1-G1+nef+mTor-IR (Dot>APOL1-G1-OE+nef-OE+mTor-IR). (A) Expression of Autophagy-related protein 8a (Atg8a; red, mCherry) in nephrocytes using the nephrocyte-specific driver Dot-Gal4 to express HIV-1 nef alone or together with APOL1-G0 and APOL1-G1. Boxed areas are shown magnified next to each image. Scale bars: 5 μm; 1 μm (magnified). (B) Quantitation of Atg8a fluorescence intensity, relative to fluorescence in control nephrocytes. n=20 flies, per group. (C) Autophagy receptor Refractory to sigma P [Ref(2)P; red] in nephrocytes using the nephrocyte-specific driver Dot-Gal4 to express HIV-1 nef alone or together with APOL1-G0 and APOL1-G1. Boxed areas are shown magnified next to each image. Scale bars: 5 μm; 1 μm (magnified). (D) Quantitation of Ref(2)P fluorescence intensity, relative to fluorescence in control nephrocytes. n=20 flies, per group. (E) 10 kDa fluorescent dextran particle uptake (red) by nephrocytes using nephrocyte-specific driver Dot-Gal4 to inhibit mTor expression alone or together with APOL1-G0+nef and APOL1-G1+nef at 22°C. Scale bar: 15 µm. (F) Quantitation of 10 kDa dextran uptake, relative to uptake in control flies. n=20 flies, per group. Results are presented as mean±s.d., normalized to the control group. Kruskal–Wallis H-test followed by a Dunn's test; **P<0.001.
HIV-1 Nef and APOL1-G1 reduce autophagy in nephrocytes synergistically
Because Ref(2)P levels are a more reliable marker than levels of Atg8a for the end result of autophagy, we hypothesized that the increased Atg8a levels could be due to accumulation of non-functional autophagosome. To verify this hypothesis, we examined the level of ubiquitinylated proteins in nephrocytes using an anti-ubiquitin antibody (Fig. 5A,B) and observed increased accumulation of ubiquitinylated proteins in nephrocytes expressing APOL1-G1, but not in those expressing nef or APOL1-G0 (Fig. 5A,B). We also found that APOL1-G1 and nef together induced the highest accumulation of ubiquitinylated proteins in nephrocytes (Fig. 5A,B). This suggests that HIV-1 Nef and APOL1-G1 reduce autophagy in nephrocytes synergistically.
*Expression of HIV-1 protein Nef in nephrocyte-induced ER stress. (A-D) Flies used (20-day-old adult females): control (Dot>w1118); nef (Dot>nef-OE); APOL1-G0 (Dot>APOL1-G0-OE); APOL1-G1 (Dot>APOL1-G1-OE); APOL1-G0+nef (Dot>APOL1-G0-OE+nef-OE); APOL1-G1+nef (Dot>APOL1-G1-OE+nef-OE). (E,F) Flies used (20-day-old adult females): control (Hand-GFP, Dot>GFP+w1118); nef (Hand-GFP, Dot>nef-OE); APOL1-G0 (Hand-GFP, Dot>APOL1-G0-OE); APOL1-G1 (Hand-GFP, Dot>APOL1-G1-OE); APOL1-G0+nef (Hand-GFP, Dot>APOL1-G0-OE+nef-OE); APOL1-G1+nef (Hand-GFP, Dot>APOL1-G1-OE+nef-OE). (A) The accumulation of ubiquitinylated proteins was shown by an anti-ubiquitin antibody in nephrocytes with expression of APOL1-G0 or APOL1-G1, with or without HIV-1 nef. Boxed areas are shown magnified next to each image. Scale bars: 5 μm; 1 μm (magnified). (B) Quantitation of ubiquitinylated proteins fluorescence intensity, relative to fluorescence in control nephrocytes. n=20 flies, per group. (C) The endoplasmic reticulum (ER) stress marker Protein disulfide isomerase (Pdi; red) in nephrocytes using the nephrocyte-specific driver Dot-Gal4 to express HIV-1 nef alone or together with APOL1-G0 and APOL1-G1. Scale bar: 15 μm. (D) Quantitation of anti-Pdi antibody staining fluorescence intensity, relative to fluorescence in control nephrocytes. n=20 flies, per group. (E) Quantitation of percentage of terminal deoxynucleotidyl transferase dUTP nick end labeling (TUNEL)-positive cells in each fly. n=20 flies, per group. (F) Apoptosis marker TUNEL (red) in nephrocytes using the nephrocyte-specific driver Dot-Gal4 to express HIV-1 nef alone or together with APOL1-G0 and APOL1-G1. Hand-GFP transgene expression was visualized as green fluorescence concentrated in the nuclei of nephrocytes. Dotted lines indicate the boundary of a cell. Scale bar: 5 μm. Results are presented as mean±s.d., normalized to the control group. Kruskal–Wallis H-test followed by a Dunn's test; **P<0.001.
HIV-1 Nef and APOL1-G1 increase ER stress in nephrocytes synergistically
APOL1-G1 can elicit the ER stress response (Rani and Gautam, 2018; Lee et al., 2023), while HIV-1 Nef can bind the ER chaperone calnexin (CNX; also known as CANX) to induce ER stress (Jennelle et al., 2014; Ryan et al., 2016; Guérin et al., 2008). We previously reported that APOL1-G1 induced ER stress in Drosophila nephrocytes (Lee et al., 2023), which is consistent with other studies’ results (Gerstner et al., 2022). Therefore, we assessed Protein disulfide isomerase (Pdi), a marker of ER stress in nephrocytes, using antibody staining. Pdi was significantly increased in nephrocytes expressing nef (Fig. 5C,D). This increase was significantly more substantial when nef was expressed simultaneously with APOL1-G1, even when compared to nephrocytes expressing APOL1-G1 alone or APOL1-G0+nef (Fig. 5C,D). However, further studies are needed to define the relative contribution of ER stress to the synergistic effects of APOL1-G1 and HIV-Nef in nephrocytes. Additionally, although we observed that enhancing autophagy rescued the nephrocyte phenotype induced by APOL1-G1 and HIV-Nef (Fig. 4E,F), it is important to note that this effect may be attributed to the broader role of mTor signaling. mTor modulation not only promotes autophagy but also suppresses protein synthesis (Zhao et al., 2015), which could independently alleviate ER stress . Further studies are needed to investigate these mechanisms.
Furthermore, nephrocytes that expressed APOL1-G1, but not nef or APOL1-G0, showed positive results in the terminal deoxynucleotidyl transferase dUTP nick end labeling (TUNEL) assay, a marker of cell death (Fig. 5E). TUNEL-positive cells were also observed when nephrocytes expressed APOL1-G0+nef or APOL1-G1+nef (Fig. 5E,F). Additionally, we performed co-labeling of TUNEL and anti-Pyd antibody in Drosophila nephrocytes. Because TUNEL marks nuclear DNA fragmentation, the confocal images were taken in the optical medial plane to capture the cell center. In this view, anti-Pyd antibody staining showed a characteristic continuous circular ring in nephrocytes with intact slit diaphragms. In the APOL1-G0+nef, APOL1-G1 and APOL1-G1+nef groups, we observed that nephrocytes displaying slit diaphragm defects were also TUNEL positive, indicating these cells were undergoing cell death (Fig. S2). We also observed phenotypic abnormalities in some TUNEL-negative nephrocytes (Fig. S2), suggesting that slit diaphragm damage precedes cell death and that the observed effects are not solely a consequence of apoptosis. These data support the association between slit diaphragm damage and apoptotic processes, indicating that HIV-1 Nef can exacerbate the APOL1-G1-induced autophagy-dependent pathway to further stimulates ER stress, leading to nephrocyte dysfunction and cell death.
DISCUSSION
We have developed a novel Drosophila model to investigate the interaction between HIV-1 Nef and APOL1-G1 in nephrocytes. Our findings demonstrate that HIV-1 Nef significantly worsens the pathogenic effects of APOL1-G1 across various cellular functions, including organelle acidification, autophagy and ER stress. Specifically, APOL1-G1 impairs organelle acidification, leading to the accumulation of non-functional autophagosomes and reduced autophagic activity, which in turn causes protein buildup and subsequent ER stress. Importantly, Nef exacerbates APOL1-G1-induced acidification defects and directly promotes ER stress, creating a synergistic increase in cellular toxicity. This combined stress ultimately leads to cell death and tissue damage in kidney cells, as demonstrated in Fig. 6. However, owing to technical limitations, determining the subcellular localization of APOL1 and nef transgenes in Drosophila nephrocytes remains challenging, limiting our ability to gain further insights. Here, we were unable to determine whether Nef affects the subcellular localization of APOL1, and further studies are underway to resolve this issue.
Model of HIV-1 Nef acting in synergy with APOL1-G1 through ER stress. Graphic depiction of the proposed model in which Nef exacerbates APOL1-G1-mediated ER stress and causes cellular toxicity. APOL1-G1 causes reduced organelle acidification, which leads to accumulation of non-functional autophagosome and reduced autophagy. Reduced autophagy results in protein accumulation, leading to ER stress. Nef exacerbates the effects of APOL1-G1 on organelle acidification and independently promotes ER stress. Therefore, HIV-1 Nef and APOL1-G1 synergistically increase cellular toxicity through ER stress, which ultimately leads to cell death and tissue damage in the kidneys. (Green text indicates that data showed upregulation, red text indicates that data showed downregulation, yellow text indicates that data showed no change.) APOL1-G1, apolipoprotein L1 risk allele G1; Atg8a-mCherry, Autophagy-related 8a with mCherry fluorescent tag; ER, endoplasmic reticulum; PDI, Protein disulfide isomerase; Rab5/7-YFP, Rab5 or Rab7 with yellow fluorescent protein tag; Ref(2)P, Refractory to sigma P; TUNEL, terminal deoxynucleotidyl transferase dUTP nick end labeling assay.
APOL1-G1-induced cytotoxicity is not exclusively dependent on the nucleotide substitutions that define this risk variant. It is also affected by the BH3 domain (Gerstner et al., 2022; Heneghan et al., 2015), exon 4-encoded sequences (Chang et al., 2019) and different haplotypes of APOL1 (Lannon et al., 2019). Therefore, we generated Tg flies expressing a common natural APOL1-G1 derived from culture podocytes from a child with HIVAN (Xie et al., 2014). This APOL1-G1 contains the haplotypes E150, I228 and K255, and only differs at S342 and I384 from a common natural APOL1-G0 haplotype used to generate the control flies. Notably, this APOL1-G0 control haplotype is more toxic in cultured human kidney epithelial cells (HEK 293) than the reference APOL1-G0 haplotype (Xie et al., 2014; O'Toole et al., 2018; Kruzel-Davila et al., 2017; Lan et al., 2014; Nichols et al., 2015; Olabisi et al., 2016; Granado et al., 2017; Hayek et al., 2017; Ma et al., 2017; Wen et al., 2018). We previously showed that APOL1-G0 expression in nephrocytes induced toxicity, albeit less severe compared to that induced by APOL1-G1 expression (O'Toole et al., 2018; Lee et al., 2023). When we reduced the expression levels of APOL1-G0 in nephrocytes by lowering the temperature to 22°C, APOL1-G0 toxicity was eliminated (Han and Olson, 2005); hence, all fly experiments in the current study were conducted at 22°C (instead of 25°C used in our previous study) so that only APOL1-G1 remains toxic. Although nephrocyte function appears to be unaffected in APOL1-G0-expressing flies at 22°C, the downstream pathway may still be impacted. Nevertheless, we found that Nef could also synergize with APOL1-G0, making it toxic at 22°C (Fig. 1), consistent with clinical studies showing that people of West African genetic ancestry living with a high HIV viral load can develop HIVAN even if they do not carry an APOL1-RA (Kasembeli et al., 2015).
A study using nephrin promoter-driven APOL1-G0 Tg mice crossbred with HIV-Tg26 mice showed that fewer renal HIVAN lesions were developed compared to single HIV-Tg26 mice, suggesting a protective role for APOL1-G0 against HIV-induced nephropathy (Zhang et al., 2013). However, studies in APOL1 Tg mice with a bacterial artificial chromosome (BAC) harboring human APOL1-G0, -G1 or -G2 found greater renal pathogenicity in G2/G2 Tg mice, compared to G1/G1 Tg mice, and that APOL1-G0 did not rescue APOL1-RA-induced kidney injury when these mice were injected with interferon-gamma (INF-γ) (Bruggeman et al., 2019). Likewise, we found that APOL1-G2 Tg flies developed more significant nephrocyte injury compared to APOL1-G1 Tg flies (Lee et al., 2023). Overall, these studies indicate that the toxicity of APOL1-RA is mainly a function of the renal expression level (Bruggeman et al., 2019), explaining why APOL1 Tg mice driven by different promoters show different results (Yoshida et al., 2023; Beckerman et al., 2017; McCarthy et al., 2021; Bruggeman et al., 2016). Our data are also consistent with a recent study using dual BAC/APOL1-HIV-Tg26 mice (Yoshida et al., 2024) to show that expression of APOL1-G0 did not minimize HIVAN lesions and expression of APOL1-G1 aggravated them (Yoshida et al., 2024).
Previous studies showed that HIV-1 Nef can induce ER stress by binding a chaperone protein, CNX (Jennelle et al., 2014; Ryan et al., 2016; Guérin et al., 2008). We showed that Nef caused ER stress in nephrocytes through a different pathway. We demonstrated that Nef, together with APOL1-G1, disrupted the autophagy pathway (Fig. 4), promoting additional ER stress (Rani and Gautam, 2018; Lee et al., 2023) (Fig. 5). Defective endosomal trafficking has been reported in yeast and flies expressing APOL1-G1 (Gerstner et al., 2022). Likewise, immunofluorescence studies in cultured human podocytes revealed increased RAB7 (late endosomes)- and LC3II (autophagosomes)-positive organelles in cells expressing the high-risk (G1/G2) compared to low-risk (G0/G0) APOL1 alleles (Fu et al., 2017a). Studies in inducible podocyte-specific APOL1-RA transgenic mice also showed that APOL1-G1 interferes with intracellular vesicular trafficking by impairing endocytic, autophagic and acidification pathways, as well as by disrupting the maturation of autophagosomes and autophagic flux, which correlated with the development of FSGS (Fu et al., 2017a). Expression of APOL1-RA was also shown to affect autophagy in cultured human podocytes (Kumar et al., 2019; Ekulu et al., 2021).
Several studies have shown that HIV-1 can restrict autophagy to promote viral replication by inhibiting the fusion between autophagosomes and lysosomes (Chang et al., 2019; Campbell et al., 2015; Saribas et al., 2015; Gupta et al., 2017). Nef overexpression in human astrocytes led to increased ATG8/LC3 (Saribas et al., 2015), and impaired acidification in human cardiomyocytes, altering RAB7 localization and autophagy pathways (Gupta et al., 2017). Alternatively, HIV-1 Nef reduced the fusion of autophagosomes to lysosomes by interacting with beclin1 (BECN1)/RAB7 in cultured human cells (Franco-Juárez et al., 2022; Zhang et al., 2020). Together, these and our findings demonstrate that HIV-1 Nef-mediated inhibition of autophagic flux is conserved across cell types and species. Notably, the minor changes induced by Nef alone in nephrocytes resemble the mild podocyte changes observed in Tg mice with podocyte-specific nef expression (Zuo et al., 2006; Husain et al., 2005). However, other studies showed more severe podocyte injury when HIV-1 nef and vpr were expressed simultaneously in mouse podocytes (Zuo et al., 2006), suggesting that other HIV-1 genes and cytokines released by HIV-infected cells are needed to fully evoke the HIVAN phenotype. HIV-nef Tg mice driven by the CD4 promoter also developed kidney disease (Hu et al., 2023; Hanna et al., 1998a,b). Even though podocytes might not express HIV-1 genes (Hu et al., 2023; Hanna et al., 1998a,b), Nef can still be released by HIV-infected cells predominately in exosomes (Dubrovsky et al., 2022) and can be taken up by uninfected cells (Mukhamedova et al., 2019).
Our fly model has limitations, including that it is based on the ectopic overexpression of APOL1 haplotypes, which can affect the intracellular localization and cytotoxicity of APOL1 (Baumann et al., 2004; Li et al., 2017), and bypass the infection of renal cells and the effects of other HIV genes and circulating cytokines acting as additional risk factors. HIVAN is a complex disease involving many renal cell types and structures that cannot be studied in flies. However, our model permits the exploration of HIV-1 Nef and APOL1 interactions independently of many confounding variables. Most findings from Tg mice, cultured podocytes and HIV-infected cells published so far are consistent with what we observed in nephrocytes. Because most relevant pathogenic pathways are highly conserved between fly nephrocytes and human podocytes, this new fly model provides a unique opportunity for rapid and cost-effective genetic or drug screens to better understand the interactions between APOL1 and HIV-1 for inducing renal injuries, as well as to discover novel therapeutics.
Drosophila is evolutionarily distant from humans, and we have accordingly discussed the limitations of using this model to study HIV-associated kidney diseases. However, because HIV-1 only infects human cells and rodents do not express APOL1, there are currently no ideal animal models to study the interaction between APOL1 and HIV-Nef in podocytes. Notably, prior studies using dual APOL1-HIV Tg mice were unable to determine whether APOL1-G1 and HIV-Nef interact specifically in mouse podocytes in vivo (Yoshida et al., 2024). In contrast, Drosophila nephrocytes provide a unique and cost-effective in vivo model system to explore how APOL1-G1 and HIV-Nef may interact.
Supporting the relevance of this model, our previous findings using nephrocyte-specific APOL1-G1-expressing flies (Fu et al., 2017a) and APOL1-G2-expressing flies (Zhu et al., 2023) have been validated by independent studies in APOL1 Tg mice and cultured mouse and human podocytes (Beckerman et al., 2017; Blazer et al. 2022). Moreover, Drosophila models of APOL1 have been adopted by other groups to uncover key aspects of APOL1 renal toxicity mechanisms (Kruzel-Davila et al., 2017; Gerstner et al., 2022). Thus, despite the evolutionary distance between Drosophila and human, it is now well accepted that Drosophila serves as a valuable model system to study the mechanisms of APOL1-associated renal toxicity.
MATERIALS AND METHODS
Fly strains
Flies were maintained on standard food (Meidi LLC) at 22°C under standard conditions. The following Drosophila lines were obtained from the Bloomington Drosophila Stock Center (BDSC): Dot-Gal4 (ID_6903), UAS-YFP-Rab5 (ID_24616), UAS-YFP-Rab7 (ID_23270), UAS-mCherry-Atg8a (ID_37750), UAS-GFP (ID_32184), UAS-mTor-IR (ID_33951 and 34639) and w1118 (ID_3605). We previously generated the Hand-GFP flies labeling the nuclei of nephrocytes and cardiomyocytes (Murakawa et al., 1988). When comparing the Drosophila nephrocyte functional or morphological differences between Dot>w^11^18 and Dot>UAS-GFP, we observed no significant differences between these two groups (Fig. S1). Additionally, we compared Dot>UAS-APOL1-G1 and Dot>UAS-APOL1-G1+UAS-GFP, observing that Dot>UAS-APOL1-G1+UAS-GFP exhibited a similar phenotype to Dot>UAS-APOL1-G1, with nephrocyte functional decline and increased cell size (Fig. S1). Based on this, we used Dot>w^1118^ as a control.
The APOL1-G0- and APOL1-G1 (cDNA from a child with HIVAN)-expressing Drosophila lines were generated as described previously (O'Toole et al., 2018). HIV-1 nef cDNA (pGM91) was obtained from the National Institutes of Health AIDS Research and Reference Reagent Program (contributed by Dr John Rossi) (Schneider et al., 2012). To generate UAS-nef constructs, the nef allele cDNA was cloned into pUAST-attB, and the transgene was introduced into a docking site by germline transformation. Flies expressing Dot-Gal4;UAS-APOL1-(G0/G1) were crossed with UAS-nef transgenic flies at 22°C. All the crosses were repeated three times independently.
10 kDa dextran and FITC-albumin uptake assay
Dextran and albumin uptake by nephrocytes was assessed ex vivo in (20-day-old) female adult flies to expose nephrocytes to artificial hemolymph containing 70 mmol/l NaCl, 5 mmol/l KCl, 1.5 mmol/l CaCl_2_, 4 mmol/l MgCl_2_, 10 mmol/l NaHCO_3,_ 5 mmol/l trehalose, 115 mmol/l sucrose and 5 mmol/l HEPES (Sigma-Aldrich). Following a 20-min incubation with 10 kDa Texas Red-dextran (0.05 mg/ml, Invitrogen) or FITC-albumin (100 mM, Sigma-Aldrich) and fixation (10 min) in 4% paraformaldehyde in phosphate buffered saline (4% PFA), the nephrocytes were mounted with VectaShield mounting medium (Vector Laboratories) and imaged.
Nephrocyte size and number
Nephrocytes were dissected from 20-day-old female adult flies and kept in artificial hemolymph, followed by fixation (10 min) in 4% PFA, and imaged. Nephrocyte size was determined using the area measurement function in ImageJ (Schneider et al., 2012) (version 1.52a). Nephrocyte numbers were manually counted using images of Hand-GFP labeling.
Immunochemistry
Female (20-day-old) flies were dissected and fixed [20 s heat fix in 100°C artificial hemolymph for anti-Pyd antibody or in 4% PFA for anti-Ref(2)P, anti-ubiquitin (FK2) and anti-Pdi antibodies]. Immunochemistry was carried out using established methods (O'Toole et al., 2018). Antibodies used in this study include mouse anti-Pyd antibody [1:100; Developmental Studies Hybridoma Bank (DSHB)], rabbit anti-Ref(2)P (1:100; ab178440, Abcam), mouse anti-ubiquitin FK2 (1:100; BWL-PW8810, Enzo Life Sciences), rabbit anti-Pdi (1:100; ZRB1846-25UL, Sigma-Aldrich) and Alexa Fluor 555 (1:1000; Thermo Fisher Scientific).
LysoTracker assay
Fly nephrocytes were dissected in artificial hemolymph, incubated (20 min) with LysoTracker (Thermo Fisher Scientific), fixed (10 min) with 4% PFA, mounted with VectaShield and imaged.
TUNEL assay
Nephrocytes were dissected in artificial hemolymph and heat fixed (100°C, 20 min) in 4% PFA, blocked with blocking buffer (50 mM Tris-HCl pH 7.4, 0.1% Triton X-100 and 188 mM NaCl), incubated with an In Situ Cell Death Detection Kit (Roche), mounted with VectaShield and imaged.
Confocal imaging
Confocal images were obtained using a ZEISS LSM900 microscope and ZEN Blue (edition 3.0) acquisition software. For quantitative comparison of intensities, common settings were chosen to avoid oversaturation and then applied across images for all samples within an assay. ImageJ (Schneider et al., 2012) (version 1.52a) was used for all image processing. For quantification, Rab5-YFP fluorescence intensity was measured in cortical areas, and Rab7-YFP and Pdi fluorescence intensities were measured in whole cells.
Statistical analysis
Statistical tests were performed using PAST.exe software (University of Oslo). Data were tested for normality using the Shapiro–Wilk test (α=0.05). Normally distributed data were analyzed by one-way ANOVA followed by Tukey–Kramer post-test for comparing multiple groups. Non-normal distributed data were analyzed by Kruskal–Wallis H-test followed by a Dunn's test for comparisons between multiple groups. Results are presented as mean±s.d. Statistical significance was determined as P<0.05. Details are provided in Dataset 1.
Supplementary Material
10.1242/dmm.052178_sup1Supplementary information
Dataset 1. Statistics.
The reference list from the paper itself. Each links out to its DOI / PubMed record.
- 1Baumann, J. G., Unutmaz, D., Miller, M. D., Breun, S. K. J., Grill, S. M., Mirro, J., Littman, D. R., Rein, A. and Kewalramani, V. N. (2004). Murine T cells potently restrict human immunodeficiency virus infection. J. Virol. 78, 12537-12547. 10.1128/JVI.78.22.12537-12547.200415507641 PMC 525105 · doi ↗ · pubmed ↗
- 2Beckerman, P., Bi-Karchin, J., Park, A. S. D., Qiu, C., Dummer, P. D., Soomro, I., Boustany-Kari, C. M., Pullen, S. S., Miner, J. H., Hu, C.-A. A. et al. (2017). Transgenic expression of human APOL 1 risk variants in podocytes induces kidney disease in mice. Nat. Med. 23, 429-438. 10.1038/nm.428728218918 PMC 5603285 · doi ↗ · pubmed ↗
- 3Blazer, A., Qian, Y., Schlegel, M. P., Algasas, H., Buyon, J. P., Cadwell, K., Cammer, M., Heffron, S. P., Liang, F.-X., Mehta-Lee, S. et al. (2022). APOL 1 variant-expressing endothelial cells exhibit autophagic dysfunction and mitochondrial stress. Front. Genet 13, 769936. 10.3389/fgene.2022.76993636238153 PMC 9551299 · doi ↗ · pubmed ↗
- 4Bruggeman, L. A., Wu, Z., Luo, L., Madhavan, S. M., Konieczkowski, M., Drawz, P. E., Thomas, D. B., Barisoni, L., Sedor, J. R. and O'Toole, J. F. (2016). APOL 1-G 0 or APOL 1-G 2 transgenic models develop preeclampsia but not kidney disease. J. Am. Soc. Nephrol. 27, 3600-3610. 10.1681/ASN.201511122027026370 PMC 5118487 · doi ↗ · pubmed ↗
- 5Bruggeman, L. A., Wu, Z., Luo, L., Madhavan, S., Drawz, P. E., Thomas, D. B., Barisoni, L., O'Toole, J. F. and Sedor, J. R. (2019). APOL 1-G 0 protects podocytes in a mouse model of HIV-associated nephropathy. P Lo S ONE 14, e 0224408. 10.1371/journal.pone.022440831661509 PMC 6818796 · doi ↗ · pubmed ↗
- 6Campbell, G. R., Rawat, P., Bruckman, R. S. and Spector, S. A. (2015). Human immunodeficiency virus type 1 Nef inhibits autophagy through transcription factor EB sequestration. P Lo S Pathog. 11, e 1005018. 10.1371/journal.ppat.100501826115100 PMC 4482621 · doi ↗ · pubmed ↗
- 7Chang, C., Young, L. N., Morris, K. L., Von Bülow, S., Schöneberg, J., Yamamoto-Imoto, H., Oe, Y., Yamamoto, K., Nakamura, S., Stjepanovic, G. et al. (2019). Bidirectional control of autophagy by BECN 1 BARA domain dynamics. Mol. Cell 73, 339-353.e 6. 10.1016/j.molcel.2018.10.03530581147 PMC 6450660 · doi ↗ · pubmed ↗
- 8Chun, J., Zhang, J.-Y., Wilkins, M. S., Subramanian, B., Riella, C., Magraner, J. M., Alper, S. L., Friedman, D. J. and Pollak, M. R. (2019). Recruitment of APOL 1 kidney disease risk variants to lipid droplets attenuates cell toxicity. Proc. Natl. Acad. Sci. USA 116, 3712-3721. 10.1073/pnas.182041411630733285 PMC 6397558 · doi ↗ · pubmed ↗