Disease activity trajectories in paediatric lupus and associations with socioeconomic factors and patient-reported pain
Siobhan Case, C Larry Hill, Peter Shrader, Anne Dennos, Thomas Phillips, Laura Eve Schanberg, Emily von Scheven, Kamil Barbour, Andrea M Knight, Aimee Hersh, MaryBeth Son, R Aamir

TL;DR
The study tracks disease activity in children with lupus over two years and finds that socioeconomic factors and pain levels are linked to disease outcomes.
Contribution
The study identifies distinct disease activity patterns in pediatric lupus and links them to socioeconomic and pain-related factors.
Findings
Three distinct disease activity trajectories were identified in pediatric lupus patients over two years.
Baseline SLEDAI 2K score and insurance type were significant predictors of disease activity trajectories.
Only 51% of patients achieved lupus low disease activity state (LLDAS) during the study period.
Abstract
Using data from participants with paediatric SLE (pSLE) in the Childhood Arthritis and Rheumatology Research Alliance Registry, we aimed to: (1) describe 2-year disease activity trajectories, measured by the SLE Disease Activity Index 2000 (SLEDAI 2K); (2) identify characteristics associated with each trajectory and (3) assess achievement of lupus low disease activity state (LLDAS) and associated baseline characteristics. Participants were diagnosed with pSLE within 12 months of baseline visit. Baseline sociodemographic, clinical and treatment characteristics were included in latent trajectory analyses. Associations between patient characteristics with trajectory groups and LLDAS were analysed with multinomial generalised logistic regression modelling. 1002 patients were screened; 553 were included for SLEDAI 2K and 269 for LLDAS analyses. SLEDAI 2K trajectories included (T1) low and…
Genes, proteins, chemicals, diseases, species, mutations and cell lines named across the full text — each resolved to its canonical identifier and authoritative record.
Click any figure to enlarge with its caption.
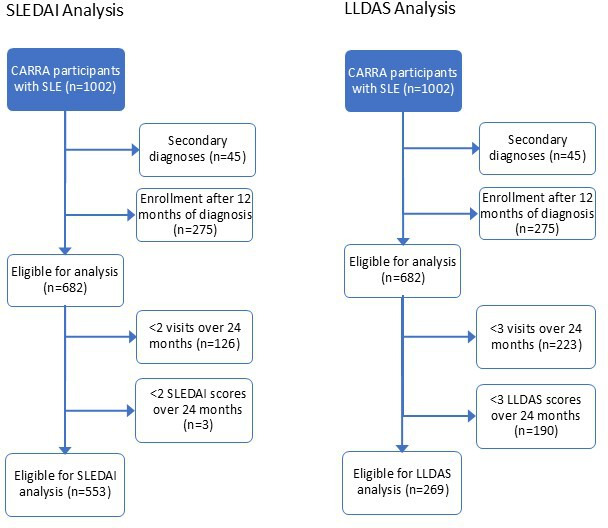 Figure 1
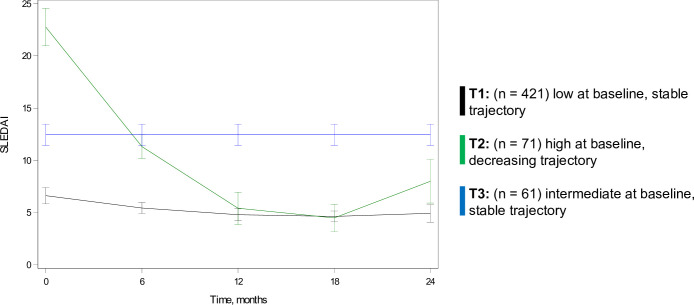 Figure 2
| Total sample (n=553) | Trajectory 1 | Trajectory 2 | Trajectory 3 | P value | |
|---|---|---|---|---|---|
| Sociodemographic characteristics | |||||
| Age at symptom onset (years), median (IQR) | 13 (11–15) | 13 (11–15) | 14 (12–16) | 14 (11–15) | 0.47 |
| Age at diagnosis (years), median (IQR) | 14 (12–16) | 14 (12–16) | 14 (12–16) | 14 (12–16) | 0.87 |
| Female sex | 481/553 (87%) | 362/421 (86%) | 63/71 (89%) | 56/61 (92%) | 0.40 |
| Race/ethnicity | 0.05 | ||||
| Asian | 60/541 (11%) | 49/409 (12%) | 8/71 (11%) | 3/61 (5%) | |
| Black, African American, African or Afro-Caribbean | 136/541 (25%) | 98/409 (24%) | 12/71 (17%) | 26/61 (42%) | |
| Hispanic, Latino or Spanish origin | 130/541 (24%) | 96/409 (24%) | 19/71 (27%) | 15/61 (25%) | |
| White | 136/541 (25%) | 103/409 (25%) | 21/71 (30%) | 12/61 (20%) | |
| Other/multiple races | 79/541 (15%) | 63/409 (15%) | 11/71 (16%) | 5/61 (8%) | |
| Insurance | 0.001 | ||||
| Private | 241/552 (44%) | 189/420 (45%) | 32/71 (45%) | 20/61 (33%) | |
| Government | 230/552 (42%) | 172/420 (41%) | 27/71 (38%) | 31/61 (51%) | |
| Other | 64/552 (12%) | 53/420 (13%) | 5/71 (7%) | 6/61 (10%) | |
| None | 17/552 (3%) | 6/420 (1%) | 7/71 (10%) | 4/61 (7%) | |
| Highest level of parent/guardian education | 0.21 | ||||
| Less than high school | 56/465 (12%) | 40/353 (11%) | 10/64 (16%) | 6/48 (13%) | |
| Graduated high school | 127/465 (27%) | 96/353 (27%) | 17/64 (27%) | 14/48 (29%) | |
| College (between 1—4 years) | 203/465 (44%) | 149/353 (42%) | 48/64 (44%) | 26/48 (54%) | |
| Graduate school | 79/465 (17%) | 68/353 (19%) | 9/64 (14%) | 2/48 (4%) | |
| Household income (annual gross) in US$ | 0.48 | ||||
| <US$25 000 | 71/331 (21%) | 52/246 (21%) | 11/48 (23%) | 8/37 (22%) | |
| US$25 000—49 999 | 87/331 (26%) | 66/246 (27%) | 11/48 (23%) | 10/37 (27%) | |
| US$50 000—74 999 | 49/331 (15%) | 32/246 (13%) | 7/48 (15%) | 10/37 (27%) | |
| US$75 000—99 999 | 41/331 (12%) | 31/246 (13%) | 6/48 (13%) | 4/37 (11%) | |
| US$100 000—150 000 | 36/331 (11%) | 31/246 (13%) | 5/48 (10%) | 0/37 (0%) | |
| Above US$150 000 | 47/331 (14%) | 34/246 (14%) | 8/48 (17%) | 5/37 (14%) | |
| Area Deprivation Index, national percentile, median (IQR) | 47 (23–73) | 44 (21–72) | 52 (32–78) | 64 (33–76) | 0.03 |
| Indices and classification criteria at baseline Registry visit | |||||
| Days from onset to diagnosis, median (IQR) | 81 (33–193) | 83 (34–203) | 46 (25–134) | 88 (33–217) | 0.03 |
| Days from diagnosis to baseline, median (IQR) | 63 (19–160) | 78 (31–185) | 15 (7–39) | 42 (13–137) | <0.001 |
| ACR classification criteria score, median (IQR) | 5 (4–6) | 4 (4–5) | 6 (5–7) | 5 (4–6) | <0.001 |
| SLICC classification criteria score, median (IQR) | 9 (7–10) | 8 (6–10) | 11 (9–13) | 9 (8–11) | <0.001 |
| SLEDAI 2K score—baseline window, median (IQR) | 8 (3–14) | 5 (3–10) | 24 (21–27) | 13 (9–16) | <0.001 |
| SLICC/ACR Damage Index score, median (IQR) | 0 (0–0) | 0 (0–0) | 0 (0–1) | 0 (0–1) | <0.001 |
| Physician global assessment, median (IQR) | 3 (1–4) | 2 (1–4) | 5 (3–6) | 4 (2–6) | <0.001 |
| Patient/parent global assessment, median (IQR) | 2 (0–5) | 2 (0–5) | 3 (1–5) | 2 (0–5) | 0.02 |
| Paediatric global health survey score, T score | 39 (34–42) | 39 (34–42) | 36 (32–40) | 39 (36–46) | 0.004 |
| Pain intensity score, median (IQR) | 2 (0–4) | 2 (0–4) | 4 (2–6) | 2 (0–5) | <0.001 |
| Pain interference score, T score, median (IQR) | 50 (34–60) | 47 (34–59) | 58 (51–62) | 51 (34–62) | <0.001 |
| Lupus nephritis | 199/527 (38%) | 132/403 (33%) | 39/67 (58%) | 28/57 (49%) | <0.001 |
| Medication Use | |||||
| Days from symptom onset to first immunosuppression, median (25th, 75th) | 96 (40, 228) | 101 (46, 243) | 67 (27, 152) | 104 (50, 273) | 0.009 |
| Oral prednisone use | 0.33 | ||||
| None | 448/553 (88%) | 367/421 (87%) | 67/71 (94%) | 54/61 (89%) | |
| Low to intermediate dose | 11/553 (2%) | 10/421 (2%) | 1/71 (1%) | 0/61 (0%) | |
| High dose | 54/553 (10%) | 44/421 (10%) | 3/71 (4%) | 7/61 (11%) | |
| Intravenous pulse steroids | 159/553 (29%) | 111/421 (26%) | 29/71 (41%) | 19/61 (31%) | 0.04 |
| Cyclophosphamide | 59/553 (11%) | 43/421 (10%) | 8/71 (11%) | 8/61 (13%) | 0.78 |
| Rituximab | 60/553 (11%) | 46/421 (11%) | 9/71 (13%) | 5/61 (8%) | 0.71 |
| Mycophenolate mofetil | 220/553 (40%) | 160/421 (38%) | 32/71 (45%) | 28/61 (46%) | 0.31 |
| Azathioprine | 64/553 (12%) | 53/421 (13%) | 4/71 (6%) | 7/61 (12%) | 0.24 |
| Methotrexate | 54/553 (10%) | 45/421 (11%) | 4/71 (6%) | 5/61 (8%) | 0.38 |
| Hydroxychloroquine | 480/553 (87%) | 373/421 (89%) | 53/71 (75%) | 54/61 (89%) | 0.005 |
| Comparison | OR (95% CI) | P value |
|---|---|---|
| SLEDAI 2K trajectories | ||
| Baseline SLEDAI 2K score (per 1 point increase) | ||
| Trajectory 1 | Reference | |
| Trajectory 2 | 2.37 (1.88 to 2.99) | <0.001 |
| Trajectory 3 | 1.23 (1.16 to 1.30) | <0.001 |
| Insurance | ||
| Government versus private insurance | ||
| Trajectory 1 | Reference | |
| Trajectory 2 | 0.13 (0.04 to 0.45) | 0.001 |
| Trajectory 3 | 0.77 (0.45 to 1.34) | 0.36 |
| No insurance versus private insurance | ||
| Trajectory 1 | Reference | |
| Trajectory 2 | 4.44 (0.58 to 34.25) | 0.15 |
| Trajectory 3 | 3.83 (1.24 to 11.82) | 0.02 |
| Other insurance versus private insurance | ||
| Trajectory 1 | Reference | |
| Trajectory 2 | 1.93 (0.45 to 8.23) | 0.37 |
| Trajectory 3 | 0.65 (0.30 to 1.41) | 0.27 |
| First assessed LLDAS | P value | ||
|---|---|---|---|
| No (n=222) | Yes (n=47) | ||
| ACR classification criteria score, median (IQR) | 5 (4–6) | 5 (3–5) | 0.04 |
| SLEDAI 2K score—baseline window, median (IQR) | 9 (4–15) | 5 (3–11) | 0.01 |
| SLICC Damage Index score, median (IQR) | 0 (0–1) | 0 (0–0) | 0.008 |
| Pain intensity score, median (IQR) | 2 (0–5) | 1 (0–3) | 0.05 |
| Pain interference score, T score, median (IQR) | 51.7 (34.0–59.5) | 40.6 (34.0–49.5) | 0.002 |
| Achieved LLDAS | P value | ||
|---|---|---|---|
| No (n=133) | Yes (n=136) | ||
| Highest level of parent/guardian education completed | <0.001 | ||
| Less than high school graduate | 14/113 (12%) | 17/119 (14%) | |
| Graduated high school | 33/113 (29%) | 28/119 (24%) | |
| College | 61/113 (54%) | 47/119 (40%) | |
| Graduate school | 5/113 (4%) | 27/119 (23%) | |
| ACR classification criteria score, median (IQR) | 5 (4–6) | 5 (4–6) | 0.02 |
| SLICC classification criteria score, median (IQR) | 9 (7–11) | 8 (7–10) | 0.02 |
| SLEDAI 2K score—baseline window, median (IQR) | 10 (4–16) | 7 (3–13) | 0.004 |
| Physician global assessment, median (IQR) | 3 (1–5) | 2 (1–4) | 0.008 |
| Patient/parent global assessment, median (IQR) | 2 (0–5) | 1 (0–4) | 0.04 |
| Pain interference score, T score, median (IQR) | 53 (34–62) | 45 (34–58) | 0.007 |
- —http://dx.doi.org/10.13039/100017759Childhood Arthritis and Rheumatology Research Alliance
- —Samara Jan Turkel Center
- —http://dx.doi.org/10.13039/100000980Arthritis Foundation
- —NIH/NIAMS
- —PCORI
- —http://dx.doi.org/10.13039/100000030Centers for Disease Control and Prevention
- —http://dx.doi.org/10.13039/100001009Bristol Myers Squibb Foundation
Peer Reviews
No public reviews on file for this paper yet. If you reviewed it on a platform where reviews are public (OpenReview, ICLR, NeurIPS, ICML), you can paste yours below so the community can read it here.
Videos
No videos yet. Explain this paper in a talk, walkthrough, or lecture? Add one.
Taxonomy
TopicsSystemic Lupus Erythematosus Research · Hepatitis Viruses Studies and Epidemiology
Introduction
The disease course of paediatric SLE (pSLE) is highly variable, with some patients following a chronic but manageable course while others experience life-threatening flares with significant morbidity and disability. Compared with adult-onset SLE, pSLE is associated with more severe manifestations including more frequent neurological and renal involvement, higher mortality,1 increased exposure to immunosuppression and higher accrual of disease damage.2 Compounding these issues, there are many documented disparities in pSLE as children identifying with certain racial and ethnic groups are more likely to develop pSLE and experience severe manifestations.35 However, risk factors for severe disease trajectories are not fully understood, leaving questions as to how to identify and treat patients with pSLE at highest risk of severe disease with the goal of improving health outcomes.
Trajectories of disease activity in pSLE have been described for an inception cohort of patients in Ontario, Canada seen between 1985 and 2011.6 Disease activity trajectories were associated with disease damage trajectories, as well as demographic and clinical characteristics such as self-identified ethnicity. The same cohort was used to study the trajectory of disease damage, revealing a steady accumulation of damage during adulthood.7 Predictors of damage trajectories also included self-reported ethnicity, as well as earlier time periods of diagnosis (1985–1990 vs 1991–2000 vs 2001–2011), treatment with cyclophosphamide and higher doses of prednisone. However, these studies did not include measures of socioeconomic status (SES) or patient-reported outcomes (PRO) and spanned an era prior to the use of rituximab and other biological treatments in SLE. Additionally, another study of patients with childhood-onset SLE in the Childhood Arthritis and Rheumatology Research Alliance (CARRA) Registry found that PRO including pain interference did not clearly predict active versus inactive disease but was likely limited by the small sample size (n=58).8 It is not clear how these associations might hold in a larger population with contemporary treatment standards.
In this study of participants with pSLE enrolled in the CARRA Registry, we describe disease trajectories in a large, diverse cohort of patients across North America and use ZIP code level measures of SES. The study aimed to (1) describe 2-year trajectories of disease activity as measured by the SLE Disease Activity Index 2000 (SLEDAI 2K)9; (2) identify key baseline (ie, at enrolment) patient characteristics associated with different trajectories; and (3) describe the association between baseline characteristics and presence of lupus low disease activity state (LLDAS)10 at the first assessment (determination of LLDAS response requires data from two visits) as well as LLDAS attainment at any point in the first 24 months of Registry enrolment.
Patients and methods
Study design, data source and patient involvement
The CARRA Registry enrols patients from 71 sites across North America. For this analysis, data were included from March 2017 through August 2022.11 Patients and their families were not directly involved in setting the research question, study design or analysis.
Subjects
Participants in the CARRA Registry were eligible for the current analysis if they had a diagnosis of pSLE as defined by the Systemic Lupus International Collaborating Clinics (SLICC) criteria,12 13 had no diagnosis of a secondary rheumatological condition other than antiphospholipid antibody syndrome or macrophage activation syndrome, and were enrolled in the Registry within 12 months of diagnosis. Exclusion criteria included an insufficient number of visits within the first 24 months of enrolment to calculate trajectories for the disease activity measure (less than two Registry visits for the SLEDAI 2K, or less than three Registry visits for the LLDAS).
Data collection
Baseline demographics included sex, self-reported race and ethnicity, highest parent/guardian education level, household income, health insurance status and 9-digit ZIP code which was used to calculate the national neighbourhood Area Deprivation Index (ADI) using US census bureau data from 2010.14 Higher ADI signifies more deprivation and lower SES (range 1–100). Insurance was categorised as none, private, government (ie, Medicare, Medicaid, state and/or military insurances) or other.
Baseline clinical characteristics included age at diagnosis, age at symptom onset, days from symptom onset to diagnosis, days from diagnosis to baseline visit, immunosuppressive medications (including glucocorticoids) prior to or at baseline visit, days from diagnosis to first immunosuppressive medication, number of American College of Rheumatology (ACR) and SLICC classification criteria,12 13 SLEDAI 2K score (range 0–105),9 SLICC/ACR Damage Index (SDI) (range 0–47),15 attainment of LLDAS as a binary measure (LLDAS score computed using 0 for any missing components, attainment scored as yes/no),10 presence of lupus nephritis (as determined by physician report), physician global assessment, PRO comprising patient/parent global assessment and Patient-Reported Outcomes Measurement Information System (PROMIS) measures of pain intensity (how much pain a patient experiences, range 0–10) and interference (how pain interferes with well-being and daily activities, range 0–32), and the paediatric global health survey.1618 Lower scores on the pain-related PROMIS measures indicate lower pain intensity/pain interference and higher scores on the paediatric global health survey indicate better overall health and quality of life. Oral glucocorticoid use was categorised into low/intermediate dose and high dose, with high dose defined as ≥20 mg a day.
Data for SLEDAI 2K and LLDAS were collected from outpatient scheduled (every 6 months) or unscheduled (for medications changes) visits and were assigned to a visit allowing for a 3-month window around each 6-month interval. If more than one visit occurred in the same window, the date collected closest to the 6-month interval was selected.
Statistical analysis
We compared baseline characteristics between participants who were included versus excluded, with χ² tests for categorical and Wilcoxon rank sum tests (non-parametric statistical methods) for continuous variables, respectively. A p value of<0.05 was considered significant.
Latent trajectory analysis was performed on the SLEDAI 2K scores using SAS procedure Proc Traj (SAS Institute, Cary, North Carolina, USA). The maximum likelihood method was used based on the SLEDAI 2K scores. No covariates were used in the trajectory modelling. All potential models were performed that had 2–5 trajectories, with any possible combination of constant, linear or quadratic terms. Within each model, the posterior probability of being assigned to each trajectory was calculated. Patients were then assigned the trajectory in which they had the highest probability. The Bayesian information criterion (BIC), Akaike information criterion (AIC) and average of the posterior probability of all subjects assigned to each trajectory were calculated for each model. Models were assessed based on BIC and AIC, as well as posterior probability >0.75 and n>30 for all trajectory groups. The clinical relevance of each model was assessed and one final model was selected.
Baseline characteristics among (1) each SLEDAI 2K trajectory; (2) LLDAS attainment at first assessment (ie, at the second registry visit) or (3) ever achieving LLDAS within 24 months were described with summary statistics. Trajectory groups were compared using the Wilcoxon rank sum test for continuous variables and χ² test for categorical variables at a significance level of <0.05.
Three separate multinomial generalised logistic regression models examined associations between baseline patient characteristics and (1) SLEDAI 2K trajectory groups, (2) LLDAS at first assessment and (3) ever achieving LLDAS within 24 months. The reference category for the SLEDAI 2K trajectory group was T1 (low baseline score with stable trajectory) and for LLDAS was not being in a low disease state. In the case of missing, not answered or unknown information, the data were imputed using a multiple imputation process with 20 imputation models, obtained using Markov Chain Monte Carlo simulation or regression methods. Results of the multiple imputation were analysed for variability between imputations. Less than 10% missingness was reported in most variables, so there was low variability between the multiple imputations. We used forward variable selection; variables needed to have a p value of ≤0.05 to remain in the model. Pooled estimates from all imputations are reported. For the SLEDAI analysis, we included baseline SLEDAI score as we hypothesised that the impact of this variable should be substantial, and removing it could therefore be misleading by making relatively less impactful variables appear to have greater influence.
Sensitivity analysis compared trajectories that used SLEDAI 2K scores with complete versus incomplete data for urinary variables. As with the original analysis, the trajectories were assessed based on fit statistics and clinical relevance.
Results
Baseline characteristics
Of 1002 patients with pSLE identified in the CARRA Registry, 553 met criteria for the SLEDAI 2K analysis and 269 for the LLDAS analyses (figure 1, CONSORT (Consolidated Standards of Reporting Trials) diagram). The mean and median number of visits was 3.9 and 4.0 for the SLEDAI 2K analysis, and 4.7 and 5.0 for the LLDAS analysis, respectively.
CONSORT diagram of selection of patient populations for the SLEDAI 2K and LLDAS analyses. CARRA, Childhood Arthritis and Rheumatology Research Alliance; CONSORT, Consolidated Standards of Reporting Trials; LLDAS, lupus low disease activity state; SLEDAI 2K, SLE Disease Activity Index 2000.
In the SLEDAI 2K analysis, 87% were female, with a median age of 14 years at diagnosis (IQR 12–16) (table 1). Approximately one-quarter each identified as black/African American/African/Afro-Caribbean, Hispanic/Latino/Spanish and white. Among parents, 44% reported at least some college education and an additional 17% some graduate school. Annual household income was <US100 000 for 25%. Only 3% of patients were uninsured. Median rank ADI was 47 (IQR 23–73). Lupus disease burden was significant, with median ACR classification criteria score of 5 (IQR 4–6) and median baseline SLEDAI 2K of 8 (IQR 3–14). Lupus nephritis was present in 38% of patients (199/527). For treatment at or before baseline, most (87%) were on hydroxychloroquine, with stronger immunosuppressive medications including mycophenolate mofetil (40%), rituximab (11%), cyclophosphamide (11%), intravenous pulse dose steroids (29%) and high-dose oral steroids (10%). In regard to PRO collection, 80% (441/553) of patients with data on pain intensity reported pain, with a median pain intensity score of 2 (IQR 0–4) and median pain interference T score of 50 (IQR 34–60).
When comparing participants who were included (n=553) versus excluded (n=449) in the SLEDAI 2K analysis, those included had an older average age at symptom onset (mean 13.0 years (SD 2.9) vs 12.6 (SD 3.1), p=0.02); higher national ADI (mean 48.4 (SD 28.7) vs 44.1 (SD 28.2), p=0.04); differences in parent/guardian education; higher average physician global score (mean 2.9 (SD 2.2) vs 2.1 (SD 2.2), p<0.0001), baseline SLEDAI score (mean 9.7 (SD 8.1) vs 7.0 (SD 6.6), p<0.0001), pain interference T score (mean 49.0 (SD 12.4) vs 47.2 (SD 12.0), p=0.04); more oral steroid use (65 (11.8%) vs 33 (7.3%), p=0.02); and less use of certain medications including methotrexate (54 (9.8%) vs 70 (15.6%), p=0.005) and mycophenolate mofetil (220 (39.8%) vs 217 (48.3%), p=0007) (online supplemental table 2).
In the LLDAS cohort, those included (n=269) compared with those excluded (n=733) had higher average physician global scores (mean 3.0 (SD 2.2) vs 2.4 (SD 2.2), p<0.0001), baseline SLEDAI scores (mean 9.9 (SD 7.8) vs 8.1 (SD 7.5), p=0.0004), SLICC classification criteria scores (mean 8.8 (SD 2.5) vs 8.4 (SD 2.9), p=0.04) and ACR classification criteria scores (mean 4.9 (SD 1.5) vs 4.7 (SD 1.6), p=0.03); and lower use of mycophenolate mofetil (101 (38%) vs 336 (46%), p=0.02) and rituximab (22 (8%) vs 95 (13%), p=0.04) (online supplemental table 3).
SLEDAI 2K trajectories
The BIC, AIC and average posterior probabilities are presented for the top model of SLEDAI 2K trajectories (online supplemental table) and shown over time (figure 2). Trajectories of SLEDAI 2K scores included (T1) low and stable (n=421, 76%), (T2) high and decreasing (n=71, 13%), (T3) intermediate and stable (n=61, 11%).
Latent trajectory analysis of SLEDAI 2K scores over 24 months in the CARRA Lupus Registry. CARRA, Childhood Arthritis and Rheumatology Research Alliance; SLEDAI 2K, SLE Disease Activity Index 2000.
The impact of covariates on SLEDAI 2K trajectories
Baseline characteristics significantly differed between SLEDAI 2K trajectories in several categories (table 1).
In multinomial generalised logistic regression, including the same variables as those described in table 1, only baseline SLEDAI 2K score and insurance type remained statistically significant (table 2). Specifically, SLEDAI 2K scores (per 1-point increase) were higher in T2 and T3 versus T1, and compared with private insurance, government insurance was less common in T2 versus T1 and no insurance was more common in T3 versus T1.
Supplemental sensitivity analysis for SLEDAI 2K urinary variables
Missing data for urinary variables in the SLEDAI 2K was higher than for other SLEDAI 2K variables. We performed a supplemental sensitivity analysis comparing trajectories using a SLEDAI 2K that had complete urinary data versus incomplete data, and the same trajectories were selected with fewer numbers in each group (data not shown).
First LLDAS assessment and LLDAS attainment over the study period
17% (47/269) of patients attained LLDAS at first assessment; the first assessment was at the 6-month visit for most participants (89%). Most participants (85%) also had a 24-month visit. By 24 months, LLDAS attainment at any point in the study period increased to 51% (136/269). When comparing baseline characteristics between participants who had not achieved LLDAS at first assessment versus those who had, participants who had higher baseline SLEDAI 2K, SDI and ACR classification criteria as well as worse scores on PROs (pain intensity, pain interference and paediatric global health survey) were less likely to attain LLDAS at first assessment (table 3). In logistic regression, differences in baseline SDI and pain interference score remained statistically significant, with higher SDI and higher pain interference scores associated with lower odds of LLDAS achievement at first assessment.
The relationships between baseline characteristics and achieving LLDAS during the 24 months following enrolment were also assessed (table 4), with parent/guardian education, SLEDAI 2K, ACR and SLICC classification criteria, pain interference and patient/parent global assessment all predictive of LLDAS attainment over the study period in bivariate analysis. Highest level of parent/guardian education completed, rituximab use at baseline, baseline ACR classification criteria and pain interference remained significant in logistic regression. Specifically, for patients who achieved LLDAS within 24 months, baseline rituximab use was higher, the number of baseline ACR classification criteria was lower and pain interference scores were lower compared with those who did not achieve LLDAS. Regarding parent/guardian education, patients with a parent/guardian who completed graduate school had higher odds of achieving LLDAS compared with patients with a parent/guardian who completed some or graduated college as well as with those who graduated high school.
Discussion
This study was designed to identify predictors of disease activity trajectories and LLDAS attainment in newly diagnosed pSLE participants in the CARRA Registry. In this diverse cohort of patients with active pSLE, we identified three distinct disease activity trajectories that were predicted by baseline SLEDAI 2K scores and health insurance, with lack of insurance associated with higher disease activity over time and government insurance less associated with high disease activity at enrolment. Furthermore, higher levels of pain interference were related to lower rates of LLDAS achievement, both at first assessment and over the study period of 24 months.
SLEDAI 2K trajectories for pSLE have been described in a Canadian cohort.6 The Canadian study had a longer median follow-up time of 5.4 years and identified five disease activity trajectories for SLEDAI 2K and prednisone exposure, specifically (1) relapsing/transforming; (2) high initial activity with long-term remission; (3) moderate initial activity with long-term, low-grade disease; (4) late relapsing; and (5) chronic, low-grade.6 While the shorter time frame of our study makes direct comparison difficult, the studies are similar in identifying trajectories with ongoing low-grade disease. Identification of low-grade disease activity is important in therapeutic management, since even low levels of disease activity as measured by SLEDAI 2K scores can lead to increased damage.19 In fact, disease activity trajectories in the Canadian study were associated with disease damage trajectories.6
In our cohort, 17% of patients attained LLDAS at the first assessment (second Registry visit for most included participants) and achieving LLDAS at any point in the study period increased to 51% by 24 months. Achievement of LLDAS at the first or subsequent assessments was predicted by fewer ACR classification criteria at enrolment and lower baseline pain interference; subsequent LLDAS attainment was also predicted by higher parent/guardian education level and baseline rituximab use. In a pSLE cohort in the UK assessing LLDAS, 67% achieved LLDAS over a median of 18 months (IQR 8.5—30.8).20 Achievement of LLDAS in that study was associated with a significantly lower risk of severe flare and less damage over time.20 It is possible that rates of LLDAS attainment differed between the UK cohort and ours due to the number of visits per participant; their participants had a median of 10 visits over 2 years, allowing for more frequent assessment of LLDAS.
The importance of pain-related PROs was underscored by their association with LLDAS achievement as well as the high amount (64%) of patients who reported some degree of pain at baseline. Pain in pSLE is described as an important factor in health-related quality of life (HRQoL)21 and disability,22 but its relationship to disease activity is less well described. Interestingly, a previous study did not find a relationship between more detailed PROMIS paediatric measures including pain interference and dichotomised SLEDAI score of active versus inactive disease, potentially reflecting the small sample size.8 In another CARRA Registry study of adolescents with pSLE, patients reporting higher levels of pain were more likely to have discordance with their provider in rating their health status.23 This discordance in health status ratings may result in provider undertreatment and therefore worse disease activity. In adult studies, PROs and HRQoL have not been associated with adjusted mean SLEDAI-2K in joint trajectory modelling.24 However, one study in adults with SLE described trajectories based on a combination of disease activity measures and PROs,25 and there are data suggesting that higher self-reported pain in adult patients with lupus is associated with higher SLEDAI scores.26 Further work should explore what aspects of pain are most impactful on function and the relationship of longitudinal PROs and disease activity measures over time.
This study demonstrated an important association between lacking health insurance and having a trajectory of higher disease activity in a pSLE population. This does not appear to reflect a limited ability to attend follow-up visits, as the median number of follow-up visits was similar across the trajectories. Other factors, such as inability to afford medications or diagnostic testing, may contribute. Interestingly, national ADI was likewise associated with higher disease activity trajectories in the univariate, but not the multivariate analysis, while household income and parental/guardian education levels were similar across trajectories. Prior studies have shown significant disparities in disease damage accrual by SES and race, with one study in adults showing that SES variables accounted for 10% of organ damage measured by the SDI.27
We also found a relationship between LLDAS and parental/guardian education, with LLDAS achievement being more likely for patients with parents/guardians who attended graduate school compared with those graduating high school or attending college. This could potentially reflect many factors, such as higher health literacy or greater flexibility at the parent/guardian’s workplace to accommodate medical care. The relationships between SLEDAI trajectories and LLDAS achievement with being uninsured and parent/guardian education warrant further investigation to identify modifiable factors.
The only medication in our study that was associated with a disease activity measure (LLDAS) was rituximab use at baseline. It is possible that rituximab is more effective at controlling early disease activity over the first 2 years of enrolment as described in our study. Otherwise, short-term disease activity was not predicted by baseline medication use.
Limitations of this study include missing data, with the highest percentages of missing data in household income, ADI, PROs on health status and days from diagnosis to immunosuppression (table 1). Our analysis used multiple imputation for missing data. Some data collection was done during the COVID-19 pandemic which impacted missingness, including PROs, and may also have limited accuracy of physician-reported outcomes in telemedicine visits. Additionally, predictors of SLEDAI 2K trajectories were based on SLEDAI 2K scores calculated at 6-month windows per CARRA Registry procedures for data entry. In the trajectory analysis, the small mean change in the groups over time was based on the average score of all patients in the group; individual patients within the group may still have experienced flares. Also, our inclusion criteria may have selected for a sicker population of patients with pSLE, given that patients included in the SLEDAI 2K analysis had higher baseline SLEDAI 2K scores than those who were excluded.
Future directions include exploring these trajectories over a longer period of time, examining disease activity measures that are specific to pSLE,28 and whether identification of predictors of disease trajectories justifies tailoring immunosuppressive treatment at baseline. The role of pain interference in pSLE warrants greater attention, given its ability to predict lack of LLDAS attainment over the short and longer term. Additionally, patients with pSLE with high SLEDAI 2K scores at baseline should be closely monitored for persistent or worsening disease activity given the known relationship between disease activity and damage,20 and efforts should be made to identify and assist patients who lack health insurance.
Supplementary material
10.1136/lupus-2025-001521online supplemental file 1
The reference list from the paper itself. Each links out to its DOI / PubMed record.
- 1Tucker LB Uribe AG Fernández M et al Adolescent onset of lupus results in more aggressive disease and worse outcomes: results of a nested matched case-control study within LUMINA, a multiethnic US cohort (LUMINA LVII)Lupus (Los Angel)2008173142210.1177/0961203307087875 PMC 281804418413413 · doi ↗ · pubmed ↗
- 2Brunner HI Gladman DD Ibañez D et al Difference in disease features between childhood-onset and adult-onset systemic lupus erythematosus Arthritis Rheum 2008585566210.1002/art.2320418240232 · doi ↗ · pubmed ↗
- 3Rubinstein TB Knight AM Disparities in Childhood-Onset Lupus Rheum Dis Clin North Am 2020466617210.1016/j.rdc.2020.07.00732981643 · doi ↗ · pubmed ↗
- 4Chang JC Sears C Torres V et al Racial Disparities in Renal Outcomes Over Time Among Hospitalized Children With Systemic Lupus Erythematosus Arthritis Rheumatol 2022741430910.1002/art.4212735384383 PMC 9339464 · doi ↗ · pubmed ↗
- 5Vazzana KM Daga A Goilav B et al Principles of pediatric lupus nephritis in a prospective contemporary multi-center cohort Lupus (Los Angel)20213016607010.1177/09612033211028658 PMC 1046161034219529 · doi ↗ · pubmed ↗
- 6Lim LSH Pullenayegum E Feldman BM et al From Childhood to Adulthood: Disease Activity Trajectories in Childhood-Onset Systemic Lupus Erythematosus Arthritis Care Res (Hoboken)201870750710.1002/acr.2331928704581 · doi ↗ · pubmed ↗
- 7Lim LSH Pullenayegum E Lim L et al From Childhood to Adulthood: The Trajectory of Damage in Patients With Juvenile-Onset Systemic Lupus Erythematosus Arthritis Care Res (Hoboken)20176916273510.1002/acr.2319928118527 · doi ↗ · pubmed ↗
- 8Weitzman ER Gaultney A von Scheven E et al Construct validity of Patient-Reported Outcomes Measurement Information System Paediatric measures in juvenile idiopathic arthritis and systemic lupus erythematosus: cross-sectional evaluation BMJ Open 202313 e 06367510.1136/bmjopen-2022-063675 PMC 988485936707118 · doi ↗ · pubmed ↗