Cross-Sectional Study of Variations in Cephalometric Parameters in Arab Orthodontic Patients with Skeletal Class I and II
Kareem Midlej, Peter Proff, Nezar Watted, Fuad A. Iraqi

TL;DR
This study examines differences in jaw structure among Arab orthodontic patients in Israel, focusing on how age and sex affect skeletal class I and II malocclusions.
Contribution
The study provides new insights into cephalometric variations specific to Arab orthodontic patients in Israel, including sex- and age-related differences and PCA results.
Findings
Males with skeletal class I had more horizontal growth patterns and anterior mandible rotation compared to females.
Female adults with skeletal class II had more hyperdivergent jaw bases and posterior mandible rotation compared to adolescents.
PCA explained 88.6% of the sample variance using four principal components, highlighting key cephalometric parameters.
Abstract
Objectives: Previous literature has already discussed the effects of age and sex on the diagnosis and treatment of malocclusion problems. However, this effect varies among different ethnic groups. These differences have not yet been investigated in many populations, such as Arab orthodontic patients and residents of Israel. Therefore, it is crucial to understand such variations in specific populations for better diagnosis and treatment. The main aim of this study is to provide novel knowledge concerning skeletal classes I and II among a cohort of Arab patients who are citizens of Israel. We used parameters obtained from lateral cephalograms to understand the variations among different sex and age subgroups. We also examined the correlations and performed principal component analysis (PCA). Methods: This study was based on the coded records of 394 Arab patients diagnosed with skeletal…
Genes, proteins, chemicals, diseases, species, mutations and cell lines named across the full text — each resolved to its canonical identifier and authoritative record.
Click any figure to enlarge with its caption.
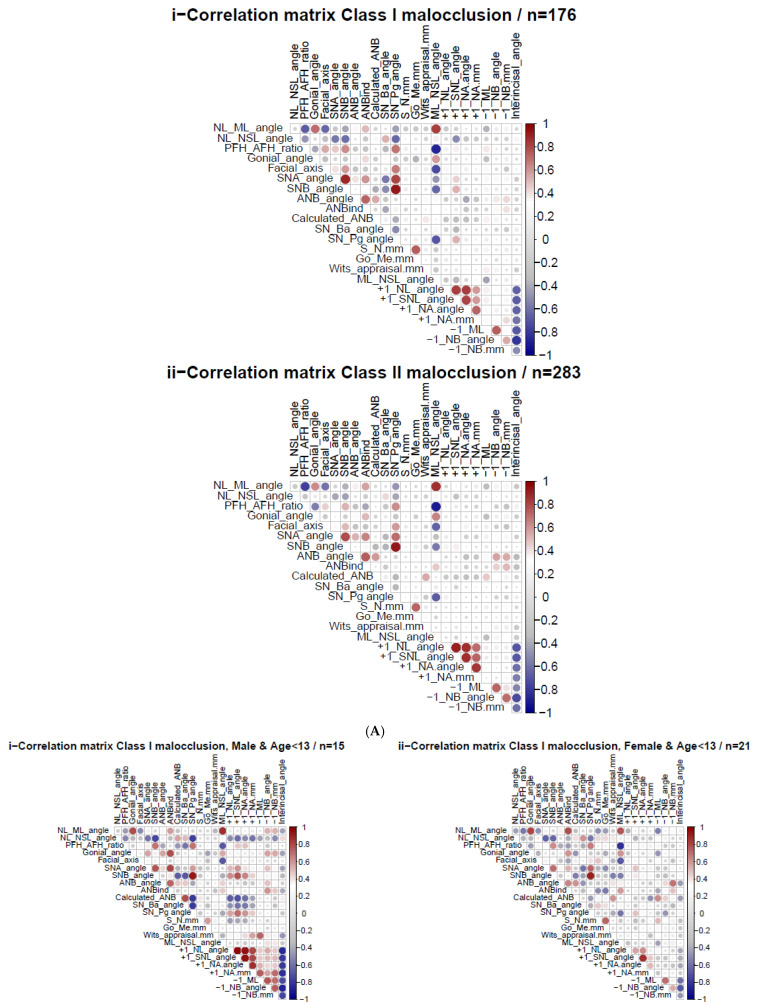 Figure 1
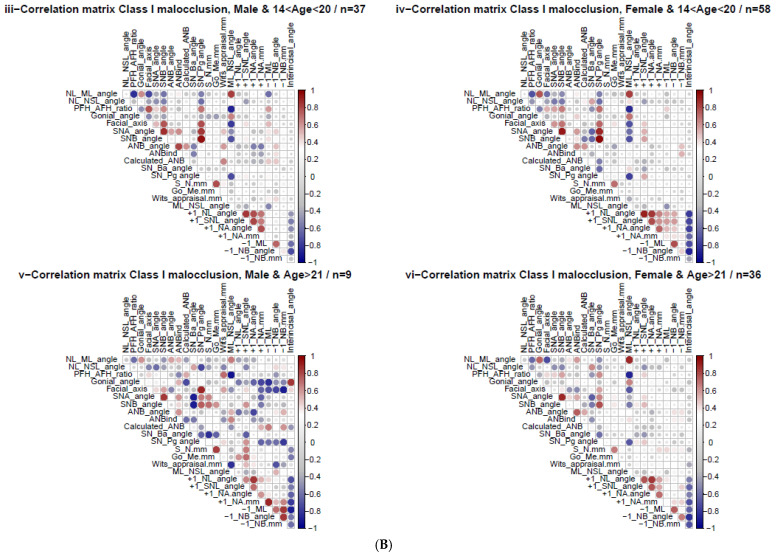 Figure 2
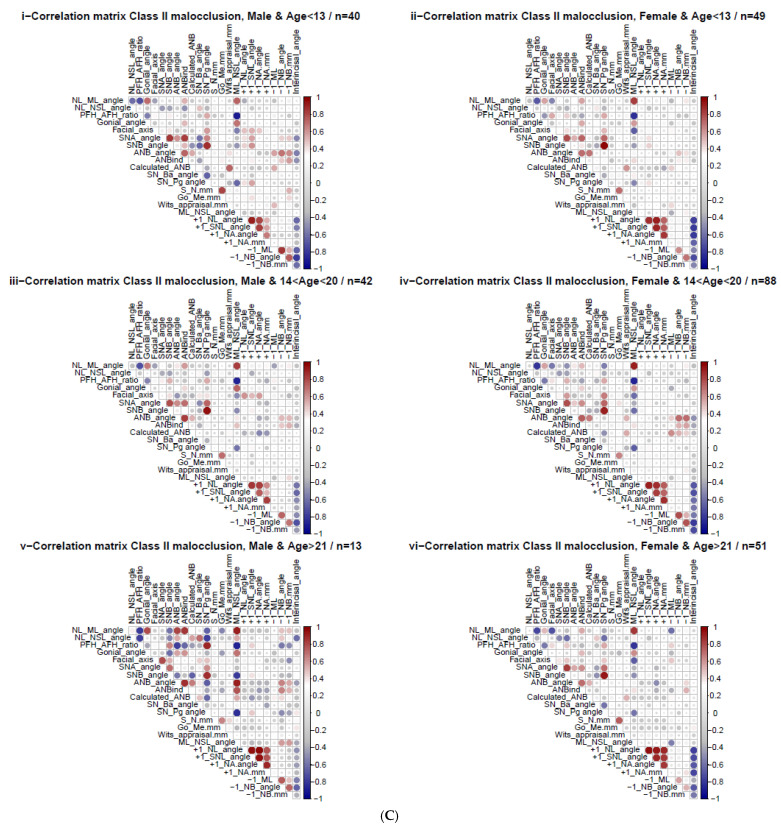 Figure 3
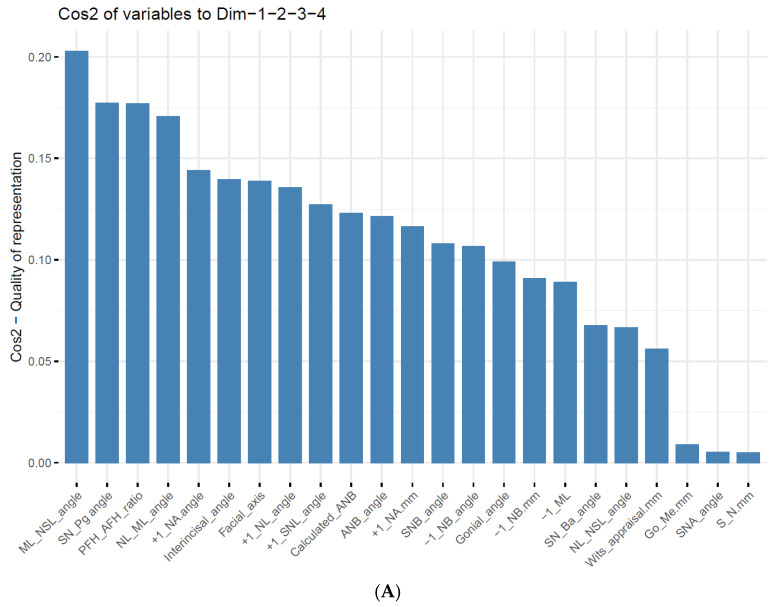 Figure 4
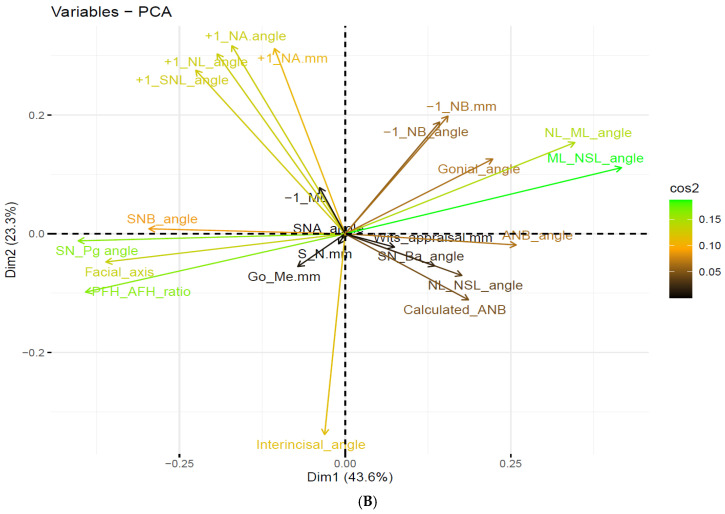 Figure 5
- —Tel Aviv University
- —University of Regensburg
- —Orthodontic Research Center
Peer Reviews
No public reviews on file for this paper yet. If you reviewed it on a platform where reviews are public (OpenReview, ICLR, NeurIPS, ICML), you can paste yours below so the community can read it here.
Videos
No videos yet. Explain this paper in a talk, walkthrough, or lecture? Add one.
Taxonomy
TopicsOrthodontics and Dentofacial Orthopedics · Temporomandibular Joint Disorders · Dental Radiography and Imaging
1. Introduction
Orthodontic problems can influence many oral functions, such as swallowing disorders and speech sound production (phonetics) errors. These malfunctions were described by Gonçalves et al. [1] and Leavy et al. [2]. A study by Claudino and Traebert [3] found that aesthetic facial changes can affect a person’s quality of life and well-being, especially in young people. A separate study by Javidi et al. [4] showed that orthodontic treatment improved emotional and social well-being during childhood and adolescence. Malocclusion is caused by functional, dental, skeletal, or combined conditions, as described by Ardani et al. [5]. In skeletal class I (Class I occlusion: (SCIO)), individuals present a harmonious relationship between the maxilla and mandible in the sagittal direction. This is considered the ideal (skeletal) occlusion and, hence, a treatment goal for the sagittal anomalies discussed by Ardani et al. [5] and Lone et al. [6]. Furthermore, SCIO is the most frequent skeletal class worldwide and accounts for 93% of specific populations, according to a review by Lone et al. [6]. Skeletal class II malocclusion (SCIIMO) accounts for over one-third of all malocclusions worldwide and is more frequent in Caucasians, according to a recent review by Lone et al. [7].
The etiology of skeletal malocclusion is multifactorial and affected by both genetic and environmental factors, as thoroughly discussed by Cenzato et al. [8]. Inherited factors may also be involved, as described by Ghodasra and Brizuela [9,10]. Genetic studies have found that the genes MSX1, PAX9, AXIN2, ESRRB, FGF3, FGF4, FGF9, GREM2, IRF6, JAG1, LHX8, and TWIST1 are associated with an increased risk of SCIO [6], and that the genes FGFR2, MSX1, MATN1, MYOH1, ACTN3, GHR, KAT6B, HDAC4, and AJUBA are correlated with SCIIMO [11].
In 1899, Angle established his classification of occlusions based on the relationship between the buccal groove of the mandibular first permanent molar and the mesiobuccal cusp of the maxillary first permanent molar, as described by Lone et al. [6,9].
SCIIMO is a heterogeneous condition characterized by a retrognathic mandible, prognathic maxilla, or both [7]. Steiner [12] defined SCIO as an ANB angle with values ranging between 0° and 4° and SCIIMO as an ANB angle with values > 4° [12,13]. According to Jacobson [14], the “Wits” appraisal is intended as a diagnostic aid to be used in conjunction with other parameters. Throughout the years, many studies have presented equations and regression formulas considering the individual norms of the ANB angle and Wits appraisal [15,16,17,18,19].
Previous research has confirmed ethnic differences in the properties of malocclusion. A study conducted by Trottman and Elsbach [20] compared malocclusion in preschool black and white children and found significant racial differences in occlusal relations. In addition, the prevalence of Class I molar relationship was comparable in Black and White children, whereas the prevalence of Class II molar relationship was significantly greater in White children. Another study by Phelan et al. [21] evaluated the variation in SCIIMO between Mexican mestizos and Caucasians and found no difference in the maxillomandibular relationships. However, Mexican SCIIMO participants had more protrusion of both jaws and more extraordinary proclination of the incisors than white SCIIMO participants. Furthermore, Mexicans had smaller SN-FH angles and significantly more vertical tendencies than Caucasians. The distribution of malocclusions was also examined by Alhammadi et al. [22], who included 53 studies from several countries, and found that the prevalence of malocclusion among permanent mixed dentition varied. In addition, different countries have different prevalence rates. For instance, in Israel, the prevalence of Class III was 0.7% compared to 19.9% in China. Ethnic differences may have critical clinical manifestations in treatment decisions for these two ethnic groups.
To our knowledge, the cephalometric parameters of Palestinian Arab patients with SCIO and SCIIMO have not yet been investigated. Therefore, the main aim of this study was to examine the differences and variations in cephalometric parameters and their correlations among Palestinian Arab residents of Israel patients and to evaluate the skeletal situation concerning Angle’s classes. This population can be considered a permanent population of this area, with family histories dating back to numerous generations and high levels of consanguinity. Furthermore, we analyzed the effects of age and sex on cephalometric parameters. As a secondary outcome, we planned to perform a principal component analysis to identify the most relevant variables for diagnosing skeletal Class I/II. Finally, the main hypothesis was that both skeletal class I and II patients would demonstrate significant variations across different sex and age subgroups.
2. Materials and Methods
2.1. Ethical Statement
This research was conducted according to the current guidelines and followed the ethics and regulations of the University Hospital of Regensburg Ethics Committee (approval number 19-1596-101, dated 13 November 2019). In addition, this study complied with the STROBE protocol for observational studies. This study consisted of 394 coded records of Palestinian Arab citizens of Israel who were diagnosed with SCIO or SCIIMO. All cephalograms were imported while maintaining their resolution using the TIF format into Romexis 7 software, Planmeca, Finland. Calibration was performed prior to the analysis to ensure the accuracy of the landmarks. Cephalometric analysis was performed by a senior orthodontist (NW). All information collected was part of the standard of care by the orthodontists’ team at the Center for Dentistry Research and Aesthetics based in Jatt, Israel.
The research sample consisted of 394 patients with SCIO (n = 157, 40%) and SCIIMO (n = 237, 60%). The inclusion criteria were as follows:
-
Arab patients diagnosed with SCIO (−1 ≤ Calculated_ANB ≤ 1) or SCIIMO (Calculated_ANB > 1). Calculated_ANB was determined by the difference between the measured ANB and the individual ANB of Panagiotidis and Witt (Calculated_ANB = ANB − individual ANB) [15].
-
Available data from pre-treatment lateral cephalograms.
The mean age of SCIO patients was 18 (M = 18, SD = 6.2), with an age range of 8.2–48 years. Among patients with SCIO, females constituted more than half (n = 101, 64%). The mean age of patients with SCIIMO was 17 (M = 17, SD = 6.5), with an age range of 6.8–44, and here also, females were more than half of the patients in this class (n = 162, 68%). Table 1A,B summarize detailed information about the tested SCIO and SCIIMO patients.
2.2. Gender and Age Subgroups
In this study, we examined the effects of sex and covariates on the variation in cephalometric parameters among patients with SCIO and SCIIMO. We grouped the patients into three subgroups according to age, as per previous literature [23,24] and clinical recommendations: 0 ≤ age ≤ 13, 14 ≤ age ≤ 20, and age ≥ 21. In summary, we compared the following subgroups:
- Males, and Females
- Age subgroups
- Combination of gender and age subgroups
2.3. Cephalometric Variables
Sample size
The sample size was determined by the maximum number of Arab Orthodontic patients diagnosed with skeletal class I or II malocclusion within the enrolment period. Moreover, we calculated the estimated sample size needed to obtain a moderate correlation (p = 0.5) in the different subgroups of sex and age using the following formula [25]:
The estimated sample size needed for moderate correlation was 29 patients (for each subgroup).
Complete information on all the parameters is presented in Supplementary Table S1, and the location of all parameters assessed is presented in Supplementary Figure S1. These cephalometric parameters were the most critical variables in the present study.
2.4. Data Analysis
Data analysis was performed using the R software (Version 4.5.1) platform and one-way analysis of variance (ANOVA) tests. Tukey post-hoc analysis was used to understand the differences between different subgroups of sex and age within the same and other classifications. More details regarding ANOVA and Tukey analysis can be found in the study by Nanda et al. [26].
In addition, we applied Spearman’s correlation and visualized the results as a heatmap correlation matrix for a better understanding of the correlations between the different cephalometric parameters among the different subgroups. Finally, to better estimate our data structure and the contribution of each variable to the sample variance, Principal Component Analysis (PCA) was performed as described by Korenius et al. [27]. Prior to performing the PCA, we examined the Kaiser-Meyer-Olkin (KMO) statistic to determine whether the data were suitable for PCA. The results showed an overall Measure of Sampling Adequacy (MSA) of 0.5. In order to increase the overall MSA, we removed the ANB_ind_ column from the data, as it was redundant with the Calculated_ANB (ANB − ANB_ind_), and the repeated MSA was equal to 0.63, which is suitable for PCA analysis. We used different figures to illustrate the importance and weight of each cephalometric parameter when calculating the principal component. In this study, we analyzed the first four components, which explained about 88.6% of the variation in our data. The level of significance was set at p < 0.05.
3. Results
3.1. Variations in Cephalogram Parameters
Our observations revealed many variations in cephalometric parameters in different sex and age subgroups within the same classification or when comparing SCIO with SCIIMO. We performed Tukey multiple group comparisons to detect these variations and looked for significant (p < 0.05) differences, which are presented in Table 2A–C and Supplementary Table S2.
3.2. Variations in Cephalometric Parameters Within the Same Classification
3.2.1. Class I Occlusion
When comparing SCIO patients, the results showed differences in the parameters NL-ML angle, PFH/AFH ratio, ANB_ind_, SN-Ba, S-N (mm), Go Me (mm), Wits appraisal, and ML-NSL angles, as presented in Table 2A. According to our results, male patients had a significantly (p < 0.05) more horizontal growth pattern (PFH/AFH) and anterior rotation of the mandible (ML-NSL) than female patients. Furthermore, in males, the mandible was significantly longer (Go-Me), even though a higher Wits appraisal indicated a more distobasal jaw relationship (p < 0.05). Among adolescents (age 14–20), male patients presented a more mesocephalic pattern (SN-Ba) than females.
3.2.2. Class II Malocclusion
Our analysis also revealed several significant differences when comparing different sex and age groups within the SCIIMO patients. In females, adults (> 21 years) had more hyperdivergent jaw bases than adolescents (ML-NL) and a more posteriorly rotated mandible (ML-NSL) (p < 0.05). Furthermore, adolescents presented a more horizontal growth pattern (PFH/AFH, Gonion angle) than children (age < 13 years) and adults (Gonion angle only) (p < 0.05). In line with this observation, adults had a more vertical growth pattern than younger patients according to the facial axis (p < 0.05). Finally, female children had a greater proclination of the lower incisors (−1/ML) than female adolescents (p < 0.05). The detailed results are presented in Table 2B.
3.3. Calculated_ANB (i.e., ANB-ANB Individual)
The results demonstrated a significant difference (p < 0.001) in the Calculated_ANB values between SCIO and SCIIMO, as well as between sub-groups of sex and age. When comparing skeletal class I and II patients, the former had a lower Calculated_ANB (M = −0.26, SD = 0.59) than the latter (M = 2, SD = 0.9) (Table 1A,B). In addition, when comparing subgroups of sex and age, SCIIMO presented significantly higher (p < 0.01) values of Calculated_ANB, i.e., a more pronounced skeletal class II, compared to the same or different SCIO subgroups, as shown in Supplementary Figure S2 and Table S2C.
3.4. Variations in Cephalometric Parameters Between Different Skeletal Classes
This study showed many differences in the cephalometric parameters when comparing different subgroups of sex and age between SCIO and SCIIMO, as presented in Supplementary Table S2.
3.5. Heatmap Spearman Correlations: Calculated_ANB vs. Other Cephalometric Parameters
Both SCIO and SCIIMO demonstrated many correlations between the Calculated_ANB and other parameters. Among SCIO patients, Calculated_ANB was moderately significantly correlated with the inclination of the maxilla (NL-NSL) (ρ = 0.336, p < 0.01), degree of prognathism of the mandible (SNB) (ρ = −0.364, p < 0.01), sagittal position of the chin (SN-Pg) (ρ = −0.395, p < 0.01), and inclination of the lower front teeth (−1/ML) (ρ = 0.377, p < 0.01). Moreover, Calculated_ANB showed a significantly weak correlation with the divergence of the jaw bases (NL-ML), growth pattern (gonial angle, facial axis, SN-Ba), degree of prognathism of the maxilla (SNA), parameters related to skeletal class (ANB_ind_, Wits appraisal), length of the anterior cranial base (S-N), and inclination of the upper (+1/SNL angle) and lower front teeth (−1/NB).
Among these correlations, SCIIMO parameters and Calculated_ANB were: ANB angle (ρ = 0.430, p < 0.01), Wits appraisal (ρ = 0.574, p < 0.01), SN-Pg angle (ρ = −0.302, p < 0.01), and −1/ML (ρ = 0.334, p < 0.01), which were significantly weakly correlated with SNB, SN-Ba, +1/NL, +1/SNL, +1/NA angle, +1/NA (mm), −1/NB angle, and −1/NB (mm) (Table 3A and Figure 1A).
3.6. Heatmaps Spearman Correlations—Gender and Age Variation
The heatmaps of each sex and age subgroup revealed many significant Spearman correlations, especially between calculated_ANB and other cephalometric parameters. Among SCIO female children, the results showed a strong, significant (p < 0.05) correlation between Calculated_ANB on the one hand and the divergence of the jaw bases (NL-ML), growth pattern (gonial angle), ANB, and inclination of the lower incisors (−1/ML). In addition, females older than 13 years presented a significant (p < 0.05) correlation between Calculated_ANB and the angle of inclination of the upper jaw (NL-NSL), sagittal position of the lower jaw (SNB) and chin (SN-Pg), craniofacial pattern (SN-Ba), and inclination of the upper front teeth (+1/SNL). Regarding SCIO male patients, the results showed that patients aged 0–13 years revealed a significant (p < 0.05) correlation between Calculated_ANB and the sagittal location of the mandible (SNB) and chin (SN-Pg), and the inclination of the upper incisors (+1/SNL). Among males aged older than 14 years, the results revealed a significant (p < 0.05) correlation between Calculated_ANB and Wits appraisal, the inclination of the lower incisors (−1/ML, −1/NB), and the interincisal angle, as presented in Figure 1B and Table 3B.
Regarding SCIIMO subgroup correlations, our analysis showed that the Calculated_ANB was associated with the measured ANB angle in all subgroups except for males aged 0–13 years (p < 0.05). In addition, a strong correlation was observed between the Calculated_ANB and Wits appraisal in all class II subgroups (p < 0.05), as presented in Figure 1C and Table 3C.
3.7. Principal Component Analysis (PCA)
In the next stage, we performed PCA to understand how cephalometric parameters contributed to sample variability. The results showed that the first four components explained 88.6% of the variance in the data, and this is presented in Table 4A.
To evaluate the weight of each cephalometric parameter among the first four components, we extracted a loading matrix. The first component revealed a high positive value for the divergence of the jaw bases (NL-ML) and the inclination of the mandible (ML-NSL), and a high negative value for the growth pattern (PFH/AFH, facial axis) and the sagittal position of the chin (SN-Pg). The second component showed a positive value for the upper incisor inclination (+1/NL, +1/SNL, +1/NA) and position (+1/NA (mm)) and a high negative value for the interincisal angle. The third component presented a high negative value in the sagittal parameters (ANB, Calculated_ANB, and Wits appraisal) and dental parameters (−1/ML and −1/NB). Finally, the fourth component showed high negative values for the NL-NSL and SN-Ba angles and a high positive value for the SNB angle. The detailed information is presented in Table 4B.
Finally, we evaluated the contribution of the cephalometric parameters to the first four components using a cosine squared function. The results in Figure 2A,B revealed that the mandible’s rotation (ML-NSL), sagittal position of the chin (SN-Pg), growth pattern (PFH/AFH ratio), and divergence of the jaw bases (NL-ML) were the most critical parameters, contributing to the first four PCs.
4. Discussion
Our study aimed to reveal novel information about the Palestinian Arab ethnic minority who are citizens of Israel. Specifically, we focused on the differences in cephalometric parameters between various sex and age groups. To understand the effects of sex and age on cephalometric parameters, we performed multiple comparison examinations within the same class and between SCIO and SCIIMO. We also examined the correlation between the different cephalometric parameters in the overall sample, and then with sex and age effects. Moreover, we investigated the contribution of each parameter to the variation in the data using PCA.
4.1. Different Groups Comparisons
Among SCIO patients, male patients had a significantly (p < 0.05) more horizontal growth pattern (PFH/AFH), an anteriorly rotated mandible (ML-NSL), longer mandible (Go-Me), and greater sagittal distance between the jaw bases according to Wits appraisal than females (I). These results are supported by the research by Salama and Abuaffan [28], who examined lateral cephalograms of Sudanese university students with SCIO and found statistically significant differences between both sexes, especially in skeletal variables. The SNA°, SNB°, and SNPg° angles were significantly higher (p < 0.01) in males than in females. In addition, they found that males showed more anteriorly inclined maxillae and mandibles (NL-NSL and ML-NSL) than females (p < 0.01). A survey by Drevensek et al. [29] revealed that the values of PFH and AFH differed significantly between the sexes (p = 0.001). The means for PFH and AFH in the early mixed dentition period were 72.3 mm and 112.0 mm for boys and 66.9 mm and 106.3 mm for girls, respectively. However, our results are not aligned with those of Deshmukh et al. [30], who found no sex differences in cephalometric variables.
Among the patients with SCIIMO, significant differences were found between the different sex and age subgroups. Adults, in particular females, had more hyper-divergent jaw bases (NL-ML) and posteriorly rotated mandibles (ML-NSL) (p < 0.01) than adolescents. In addition, our results showed that compared with children and adolescents, adults had a more vertical growth pattern according to the facial axis. This result is partially consistent with that of Pancherz et al. [31], who found that anterior rotation of the mandible was more frequently observed in younger than in older patients. In the same study, the authors did not find significant age-dependent differences in the divergence of the jaw bases (NL-ML) among patients with SCIIMO divisions 1 or 2. Furthermore, female children showed more vertical growth patterns (PFH/AFH ratio and Gonion angle) and proclined lower incisors than female adolescents. These results are supported by Yoon and Chung [32], who found that with growth, the face becomes flatter, and the mandible rotates forward (ANB, MP-SN, and gonial angles decrease, and PFH: AFH (%) increases).
4.2. Calculated_ANB Correlation with Other Cephalometric Parameters
Overall, both the SCIO and SCIIMO groups demonstrated many correlations between Calculated_ANB and other parameters. Among SCIO patients, Calculated_ANB had a moderate significant association with the inclination of the upper jaw (NL-NSL) (ρ = 0.336, p < 0.01), the sagittal position of the mandible (SNB) (ρ = −0.364, p < 0.01), chin SN-Pg (ρ = −0.395, p < 0.01), and the lower incisors’ inclination (−1/ML) (ρ = 0.377, p < 0.01). In SCIIMO, Calculated_ANB was associated with ANB (ρ = 0.430, p < 0.01), Wits appraisal (ρ = 0.574, p < 0.01), the chin’s antero-posterior location (SN-Pg) (ρ = −0.302, p < 0.01), and the lower incisors’ inclination (−1/ML) (ρ = 0.334, p < 0.01). These findings demonstrate that the skeletal class, determined by Calculated_ANB, is not only correlated with the sagittal position of the jaw bases but also with other skeletal (and dental) parameters.
Our results are consistent with those of previous studies. According to Jan et al. [33], the correlation between the ANB angle and Wits was significantly correlated with an “r” value of 0.469 (r = 0.469, p < 0.00). Another study conducted on 60 subjects found a statistically significant correlation between the ANB angle and Wits appraisal values. In addition, Saad et al. [34] found a statistically insignificant correlation between the SNP plane angle and ANB angle and Wits appraisal. In another study performed by Ardani et al. [35] on SCIIMO in the Japanese population, a significant correlation was found between mandibular length and other skeletal variables in the vertical and sagittal directions, such as facial axis, SN-MP, LAFH, and ANB. An investigation done by Gul-e-Erum and Fida [36] examined cephalometric analysis for assessing the sagittal jaw relationship and determining the relationship between them and found a robust correlation between AXB and AF-BF distance and a weak correlation between ANB and Beta angle. In the same study, they found that the Wits appraisal showed the highest coefficient of variability.
4.3. Results of Principal Component Analysis
Subsequently, after understanding the variations and correlations of the different cephalometric parameters, we aimed to better understand our data structure and the contribution of each parameter to this variation. We conducted a PCA analysis that showed us the ability of the first four components to explain 88.6% of the variation in the skeletal class diagnosis. The results revealed that the inclination of the lower jaw (ML-NSL), sagittal position of the chin (SN-Pg), growth pattern (PFH/AFH ratio), and divergence of the jaw bases (NL-ML) were the most important parameters for the first four PCs. In a previous study by Jan et al. [33] that examined sixty-three lateral cephalometric variables of 309 white Class II adults, PCA resulted in seven principal components that explained 81% of the variation. The first three components represented variations in mandibular rotation, maxillary incisor angulation, and mandibular length. Another study by Moreno et al. [37], which analyzed the phenotype–genotype correlations of facial width and height proportions in patients with Class II malocclusion using 2D frontal repose photographs, revealed that four principal components (PCs) explained 75% of the total variation. Furthermore, Dascalu and Zegan [38] performed a previous study that used 16 measurements and a sample of 120 patients. A cephalometric study was performed to identify possible differences between the measures for different types of orthodontic diagnoses, and five principal components were identified, which covered 88.54% of the total variance of the variables. The rotated component matrix showed that the components corresponded to the following measurement order: SND, Maxl-NA, 1I-NB S-E, and ANB.
4.4. Limitations
The study sample comprised only patients with skeletal classes I and II, while those with skeletal class III were excluded. Furthermore, this study was based on a single rater’s diagnosis. Another limitation was the heterogeneous size of the age- and sex-specific subgroups, which can be explained by the retrospective study of the enrollment of patients without consideration of subgroups.
5. Conclusions and Future Research
This research revealed new information regarding Arab orthodontic patients who are diagnosed with skeletal class I or II. The results demonstrate the differences between the two classes. In addition, this study demonstrated the variation and correlation of cephalometric parameters among different sex and age subgroups in skeletal class I and II Arab patients, especially considering Calculated_ANB. Therefore, this study highlights the need to consider these differences when diagnosing patients and to distinguish the differences across different sex and age subgroups in the diagnosis and treatment process. For example, the results showed that class I male patients had a significantly (p < 0.05) more horizontal growth pattern (PFH/AFH), an anteriorly rotated mandible (ML-NSL), longer mandible (Go-Me), and greater sagittal distance between the jaw bases according to Wits appraisal than females. The PCA showed that a few cephalometric parameters explained 88.6% of the total variance in skeletal class I/II diagnosis. These parameters are the inclination of the lower jaw (ML-NSL), sagittal position of the chin (SN-Pg), growth pattern (PFH/AFH ratio), and divergence of the jaw bases (NL-ML), which have a strong influence on Calculated_ANB and must be identified with high certainty to precisely define an individual’s skeletal class.
The reference list from the paper itself. Each links out to its DOI / PubMed record.
- 1Gonçalves F.M. Taveira K.V.M. Araujo C.M. de Ravazzi G.M.N.C. Guariza Filho O. Zeigelboim B.S. Santos R.S. Stechman Neto J. Association between atypical swallowing and malocclusions: A systematic review Dent. Press J. Orthod.202327 e 222128510.1590/2177-6709.27.6.e 2221285.oar PMC 1004246136995845 · doi ↗ · pubmed ↗
- 2Leavy K.M. Cisneros G.J. Le Blanc E.M. Malocclusion and its relationship to speech sound production: Redefining the effect of malocclusal traits on sound production Am. J. Orthod. Dentofac. Orthop.201615011612310.1016/j.ajodo.2015.12.01527364213 · doi ↗ · pubmed ↗
- 3Claudino D. Traebert J. Malocclusion, dental aesthetic self-perception and quality of life in a 18 to 21 year-old population: A cross section study BMC Oral Health.201313310.1186/1472-6831-13-323295063 PMC 3556057 · doi ↗ · pubmed ↗
- 4Javidi H. Vettore M. Benson P.E. Does orthodontic treatment before the age of 18 years improve oral health-related quality of life? A systematic review and meta-analysis Am. J. Orthod. Dentofacial Orthop.201715164465510.1016/j.ajodo.2016.12.01128364887 · doi ↗ · pubmed ↗
- 5Ardani I.G.A.W. Heswari D. Alida A. The correlation between Class I, II, III dental and skeletal malocclusion in ethnic Javanese: A cross sectional study J. Int. Oral Health 20201224810.4103/JIOH.JIOH_193_19 · doi ↗
- 6Lone I.M. Zohud O. Midlej K. Awadi O. Masarwa S. Krohn S. Kirschneck C. Proff P. Watted N. Iraqi F.A. Narrating the Genetic Landscape of Human Class I Occlusion: A Perspective-Infused Review J. Pers. Med.202313146510.3390/jpm 1310146537888076 PMC 10608728 · doi ↗ · pubmed ↗
- 7Lone I.M. Zohud O. Midlej K. Proff P. Watted N. Iraqi F.A. Skeletal Class II Malocclusion: From Clinical Treatment Strategies to the Roadmap in Identifying the Genetic Bases of Development in Humans with the Support of the Collaborative Cross Mouse Population J. Clin. Med.202312514810.3390/jcm 1215514837568550 PMC 10420085 · doi ↗ · pubmed ↗
- 8Cenzato N. Nobili A. Maspero C. Prevalence of dental malocclusions in different geographical areas: Scoping review Dent. J.2021911710.3390/dj 9100117 PMC 853489934677179 · doi ↗ · pubmed ↗