Near extinction of the HBV quasispecies driven by the hard selective sweep in chronic hepatitis B
Daiqiang Lu, Andong He, Guichan Liao, Renyu Zhou, Zichun Cheng, Ka Cheuk Yip, Xiufang Wang, Wei Cao, Jiaojiao Peng, Ruiman Li, Jie Peng, Feng Gao

TL;DR
This study shows that strong immune pressure can reduce hepatitis B virus diversity, leading to a homogeneous viral population that could be targeted for a functional cure.
Contribution
The study identifies a hard selective sweep in HBV quasispecies driven by T cell immune pressure, leading to a homogeneous viral population.
Findings
HBV quasispecies diversity varies among patients based on selection pressure.
Hard selective sweeps (HSS) reduce viral diversity into a homogeneous population in some patients.
Predominant mutations occur in T cell epitopes, suggesting T cell-driven selection pressure.
Abstract
The viral quasispecies play an important role in pathogenesis. However, little is known about the nature of hepatitis B virus (HBV) quasispecies and its impact on the outcomes of chronic hepatitis B. Here, we characterized the bona fide quasispecies viral populations from 16 chronically infected patients by analyzing the near full-length viral genomes obtained by single genome sequencing. Follow-up plasma samples were collected from six patients after 6 months and from four patients after 3–5 years. We found that the viral population diversity levels were highly variable among these patients, depending on the status of the selection pressure. To further understand the host selection pressure over time, we compared viral sequences from different timepoints in 10 patients and found the hard selective sweep (HSS) at the whole genome level in three of them. This HSS was extremely strong and…
Genes, proteins, chemicals, diseases, species, mutations and cell lines named across the full text — each resolved to its canonical identifier and authoritative record.
Click any figure to enlarge with its caption.
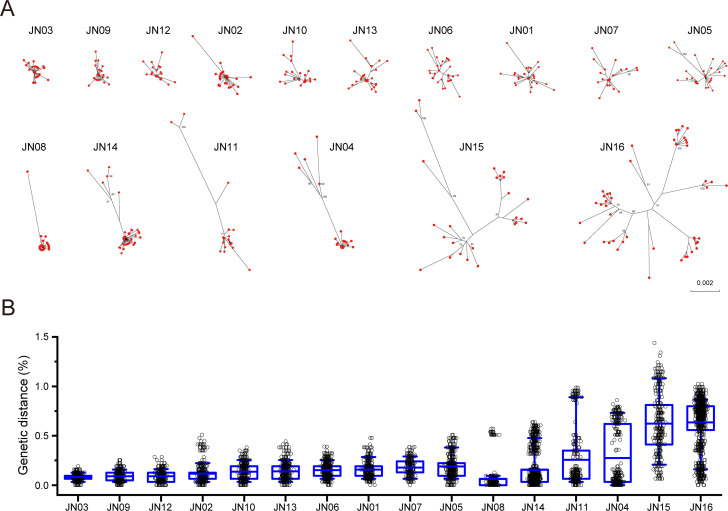 Fig 1
Fig 1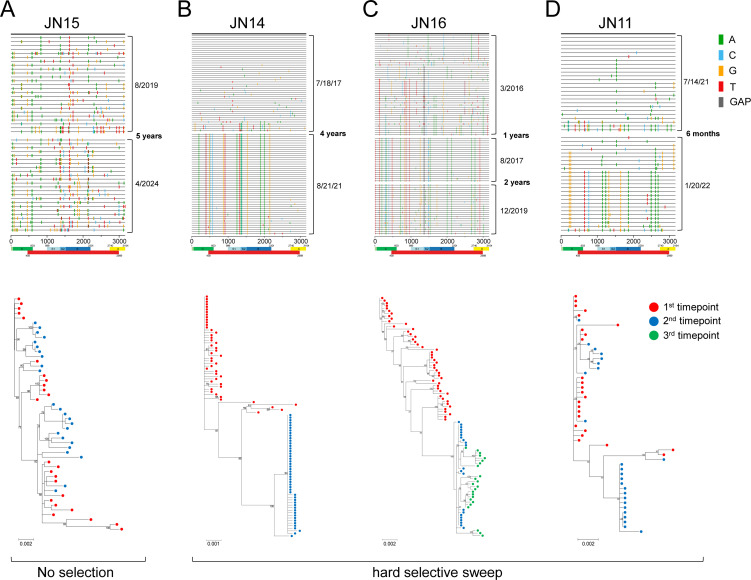 Fig 2
Fig 2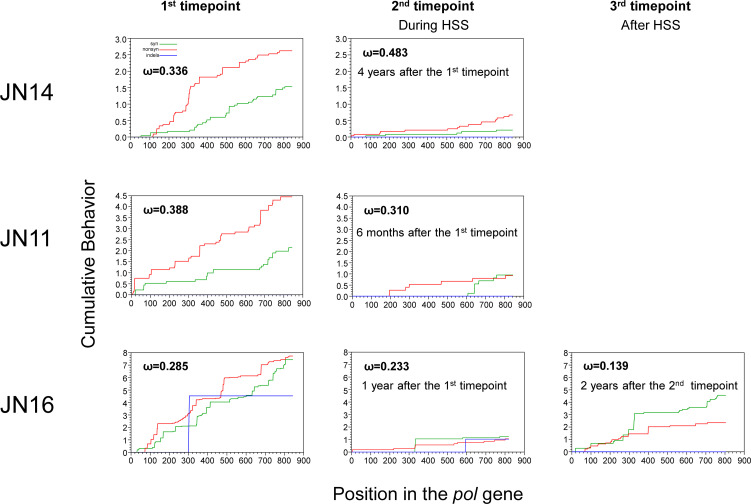 Fig 3
Fig 3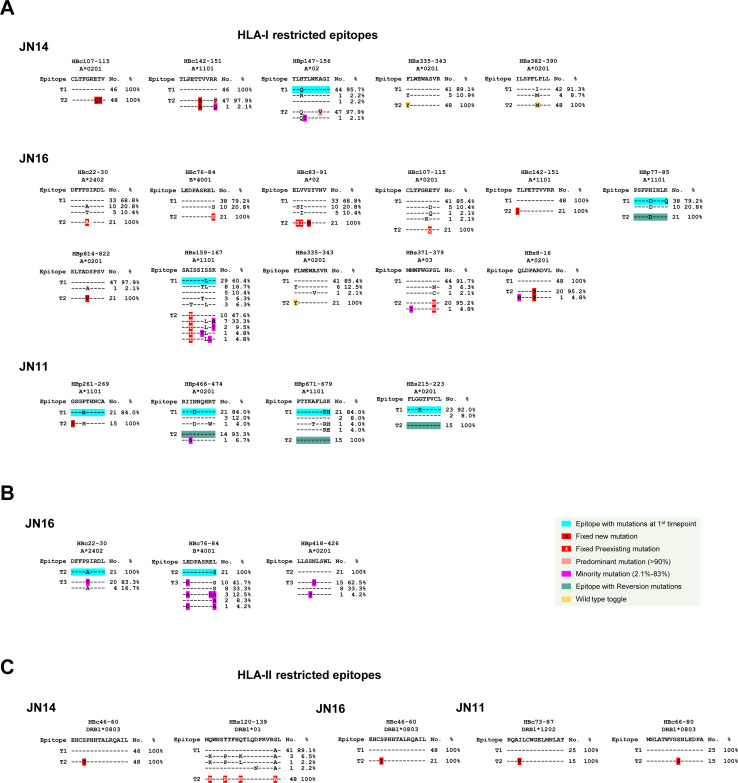 Fig 4
Fig 4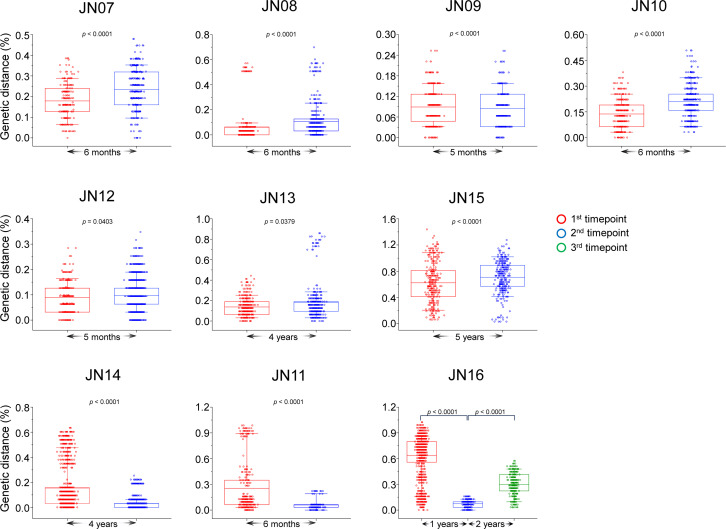 Fig 5
Fig 5| Total mutations | No. of nonsynonymous mutations in known T cell epitopes | No. of nonsynonymous mutations not in known epitopes | No. of synonymous mutations | |||||
|---|---|---|---|---|---|---|---|---|
| HLA-I restricted | HLA-II restricted | |||||||
| 1 | 2 | 3 | 1 | 3 | ||||
| JN14 | 17 | HBp147-156 | HBc107-115 | HBc46-60 | HBs120-139 | 5 | 1 | |
| JN16 | 21 | HBc22-30 | HBc83-91 | HBc46-60 | 5 | 3 | ||
| JN11 | 13 | HBp261-269 | HBp671-679 | HBc73-87 | 3 | 3 | ||
| PID | Evolutionary rate | Selection |
|---|---|---|
| JN07 | 1.43 × 10⁻⁴ | No HSS selection |
| JN08 | 6.30 × 10⁻⁵ | |
| JN09 | 4.78 × 10⁻⁵ | |
| JN10 | 8.02 × 10⁻⁴ | |
| JN12 | 2.58 × 10⁻⁴ | |
| JN13 | 6.97 × 10⁻⁵ | |
| JN15 | 4.58 × 10⁻⁴ | |
| JN14 | 1.09 × 10⁻³ | HSS selection |
| JN16 | 1.14 × 10⁻² | |
| JN11 | 1.81 × 10⁻³ |
- —National Key Research and Development Program of Chinahttp://dx.doi.org/10.13039/501100012166
- —Research Fund for International Scientists of National Natural Science Fund of China
- —Program for Guangdong Introducing Innovative and Entrepreneurial Teams
Peer Reviews
No public reviews on file for this paper yet. If you reviewed it on a platform where reviews are public (OpenReview, ICLR, NeurIPS, ICML), you can paste yours below so the community can read it here.
Videos
No videos yet. Explain this paper in a talk, walkthrough, or lecture? Add one.
Taxonomy
TopicsHepatitis B Virus Studies · Hepatitis C virus research · Bacteriophages and microbial interactions
INTRODUCTION
Hepatitis B is an infection of the liver caused by the hepatitis B virus (HBV). Although HBV is cleared by immune responses during acute infection in the majority of the infected people, ~5% of them become chronic hepatitis B (CHB), which can lead to hepatocellular carcinoma (HCC) (1–3). About 254 million people were living with CHB, resulting in ~1.1 million deaths in 2022 (4). Each year, 1.2 million new infections are diagnosed. Thus, hepatitis B is a major threat to public health (4). HBV is highly variable due to the error-prone reverse transcriptase and can result in a diversified viral population, termed quasispecies, in a CHB patient (5, 6). Previous studies showed that the viral quasispecies in a host plays an important role in the pathogenesis of polioviruses and hepatitis C viruses (HCV) (7, 8). The HBV quasispecies can also affect viral evolution, pathogenesis, drug discovery, and vaccine design. For example, mutations in the X gene are closely associated with the development of HCC (9). Furthermore, HCC patients exhibit a higher frequency of PreS gene deletions along with increased complexity and diversity of viral populations (10, 11). Additionally, immune selection pressure-driven enrichment of PreCore and/or basal Core promoter mutants contributes to serological conversion in HBeAg-positive patients (12). Furthermore, genetic variations in the reverse transcriptase gene and the major hydrophilic region (MHR) lead to the emergence of drug-resistance mutations and neutralizing antibody (nAb) escape mutations, respectively (13–16). These mutations have important impacts on drug discovery and multivalent vaccine design.
However, HBV quasispecies have not been well characterized due to the limitations of the used methods. Direct sequencing of bulk PCR products can only detect the consensus sequences of the quasispecies population in the PCR products but not the actual individual sequences (17, 18). Cloning analysis of bulk PCR products can detect individual sequences but suffers greatly from resampling of the amplified same genome (19) and Taq-polymerase introduced mutations during PCR (17). Next-generation sequencing has very short read lengths (50–300 bp) and higher error rates (0.1%) (20). These above methods also employ the bulk PCR amplification step and can be significantly affected by the highly artificial recombination rate during bulk PCR amplification (21–23). HBV sequences have been obtained using the above methods, and only one recent study used the limiting dilution PCR method to analyze the drug resistance to lamivudine after treatment failure with antiviral drugs (24).
The single genome sequencing (SGS) method has been used extensively to study HIV, HCV, and malaria quasispecies (25–27). We have used the SGS method to study HIV quasispecies and made numerous important discoveries. They include accurate determination of transmitted/founder HIV-1 strains (18), the co-evolution of the viruses and broadly neutralizing antibodies (bnAbs) in the same host (25), and mechanisms of immune escape from bnAbs (28). Since PCR is carried out with a single genome and the final PCR products are sequenced in bulk, SGS is not affected by Taq-polymerase-mediated mutations, resampling, and artificial recombination as the above-mentioned methods (17–23). Therefore, SGS provides an excellent method for the unbiased analysis of viral quasispecies and the accurate capture of the in vivo evolutionary trajectory of HBV in CHB patients.
A selective sweep often occurs under host selection pressure during viral infections (29, 30). In the soft selective sweep (SSS), beneficial mutations are present on different genomic backgrounds, and it does not eliminate all genetic variation in the population (31). However, in the hard selective sweep (HSS), a beneficial mutation increases in frequency rapidly and drastically reduces genetic variation in the population (29, 30). SSS is often observed in HIV, HCV, and SARS-CoV-2 infections as well as during influenza A virus transmission (32–35). However, HSS has been found during HIV and HCV transmission (18, 36) or after treatment failure of HIV infection (37–39), but it has not been observed during natural chronic infection of any viruses. About 1% of the CHB patients each year can become HBsAg negative and free of HBV infection (40–42). The virologic attributes to this self-clearance of HBsAg have not been investigated. It will be important to investigate whether HSS plays a critical role in the HBsAg self-clearance during natural HBV infection.
Here, we analyzed the near full-length (NFL) HBV genome sequences of longitudinal samples from the same CHB patients using the SGS method, which can precisely characterize the viral quasispecies without interference of the error rate, resampling, and artificial recombination generated by bulk PCR (17–22). We found that the strong HSS that resulted in a highly homogeneous viral population often occurred during natural CHB. This unique phenomenon demonstrates the presence of the previously unappreciated host selection pressure that is strong enough to eliminate all diverse viral strains except one homogeneous viral population. This finding has important implications in understanding the biology, reservoir, and pathogenesis of HBV as well as developing effective treatment strategies for CHB.
RESULTS
Genetic diversity levels of HBV are highly variable in CHB patients
The HBV quasispecies in the samples collected from 16 CHB patients were studied (Table S1). All but three were infected for >10 years. The average of viral loads was 4.51 × 10^7^ (9.41 × 10^2^ to 5.45 × 10^8^) IU/mL. To accurately characterize the viral population, we obtained an average of 29 (20–57) NFL viral genome sequences from each archived plasma sample by SGS (Fig. 1; Table S1). Phylogenetic analysis showed that sequences from each patient formed a tight lineage (Fig. S1). The HBV genetic diversity levels were highly variable among these patients. It was less than 0.2% (0.08%–0.19%) in 10 patients (Fig. 1; Table S2). In the other four patients (JN08, JN14, JN11, and JN04), the genetic diversity levels of the major viral populations were even less than 0.1% (0.03–0.09) but each contained a highly divergent viral population (Fig. 1A; Fig. S2). The last two patients (JN15 and JN16) had much higher genetic diversity levels and harbored multiple lineages of divergent variants (Fig. 1; Fig. S2). The highly variable genetic diversity levels indicate that the viruses are under different selection pressures among CHB patients.
Various levels of genetic diversity among the chronically HBV-infected patients. (A) Phylogenetic tree analysis of all NFL HBV sequences from each patient was constructed by the maximum likelihood method using the General Time Reversible Model (GTR) model. The branch reliability was estimated with 1,000 bootstrap replicates. (B) The intra-host genetic diversity levels were compared among 16 CHB patients. The genetic diversity within a patient was determined by calculating pairwise genetic P-distances of the HBV sequences from the same patient. The blue middle line indicates the mean. The box shows 25–75 percentiles of the diversity, and the whiskers show 10–90 percentiles of the diversity.
HSS drives the diverse viral quasispecies into a highly homogeneous viral population
To understand what caused the high levels of viral genetic variation and how HBV evolves over time, we analyzed the viral quasispecies from additional timepoints (0.5–5 years later) from 10 CHB patients (Table S1). In seven cases (70%), the viral sequences were indistinguishable between the initial timepoint and the second timepoint (Fig. 2A; Fig. S3), similar to most results in previous reports (43, 44). This showed that the viral populations in these CHB patients were not likely under detectable immune selection pressure, consistent with the reported immunity exhaustion during CHB (45–49). However, all viral sequences in JN14 at the second timepoint were distinct from those at the first timepoint and formed an independent monophyletic branch (Fig. 2B). Importantly, they were highly homogeneous, with the majority (64.6%) of the NFL genome sequences identical to each other, while all but two other sequences differed from the majority sequence by only one nucleotide. This demonstrates that the viruses experienced a strong HSS.
HSS in the chronically HBV-infected patients. The multiple NFL HBV genome sequences obtained by SGS at 2–3 timepoints from each CHB patient were analyzed. Each highlighter plot shows the positions of all mutations in each HBV genome sequence, compared to the consensus sequence of all sequences obtained at the first timepoint (top thick line). Each line represents an NFL HBV genome sequence. Mutations and gaps are color coded, and their locations in the viral genome are shown at the bottom. The phylogenetic trees were constructed by the maximum likelihood method with the GTR model. Its reliability was estimated by 1,000 bootstrap replicates. The colors of the dots represent viral sequences from different timepoints. The viral population in patient JN15 was under no selection (A), while the viral populations in patients JN14 (B), JN16 (C), and JN11 (D) were under HSS.
Severe reduction of both synonymous and nonsynonymous mutations during HSS. Cumulative plots of each codon average behavior for all sequences compared for the HBV Pol gene at different timepoints for synonymous mutations (green), nonsynonymous (red) mutations, and indels (blue). Values of ω denote average ratios of the rate of nonsynonymous substitutions per nonsynonymous site (dN/dS) for each sample.
A similar strong HSS on the viruses was observed in JN16. The viral population at the second timepoint was also very different from those from 1 year ago and formed a monophyletic branch (Fig. 2C). The majority of sequences (76.2%) were highly homogeneous (identical to each other or different by two nucleotides) after HSS, while the other five sequences differed from the majority sequences by only three nucleotides. We also obtained a third timepoint sample (2 years after the second timepoint) from the same patient. Interestingly, all the viral sequences at the third timepoint evolved from the viruses at the second time (Fig. 2C). This demonstrates that the highly homogeneous viral population selected by the strong HSS can continue to evolve afterward. No detection of any viral sequences from the first timepoint at the third timepoint indicates that the diverse viral variants at the first timepoint were eliminated through HSS.
In the third patient JN11, the second timepoint sample was collected only 6 months later. The majority of the sequences (60%) at the second timepoint were also highly homogeneous and distinct from those at the first timepoints (Fig. 2D), like in JN14 and JN16. All (15) but one sequence was either identical or differed from the majority of sequences by only one nucleotide. However, nine sequences (36%) were still indistinguishable from those at the first timepoint (Fig. 2D). These results indicate that the viral quasispecies were in the process of being replaced by the highly homogeneous viral population under the strong HSS.
Recombination facilitates HSS
In patient JN14, four sequences from the first timepoint were divergent but more closely related to the sequences from the second timepoint (Fig. S4A). The highlight plot showed that eight bases in the S gene were shared between these four sequences and those from the second timepoint after HSS. This indicates that the two halves of the genomes had different origins. Analysis of the 5’-half sequences (~1,300 bp) showed that all the sequences at the second timepoint were distinct from those from the first timepoint (Fig. S4B). However, the analysis of the 3’-half sequences (~1,800 bp) showed that all the new mutations in the sequences from the second timepoint were present in those four divergent sequences at the first timepoint (Fig. S4C). Phylogenetic tree analysis showed that all the 5’-half genome sequences from the second timepoint formed an independent lineage, while the 3’-half genome sequences formed an independent tight cluster together with those four divergent viruses from the first timepoint. These results strongly indicate that the recombination occurred between a minority population of the variants and an undetected viral population at the first timepoint and only the recombinant virus survived the strong HSS (30).
Limited mutations in the viral population due to the strong selective pressure
After HSS, both synonymous and nonsynonymous mutations across the entire Pol gene, which consist of the majority (80%) of the viral genome, were severely reduced in all three individuals (Fig. 3), consistent with the highlighter plot analysis results (Fig. 2). Similar results were also observed for the other three genes (PreC_Core, PreS1_S2_S, and X) which completely or partially overlap the Pol gene (Fig. S5). However, both synonymous and nonsynonymous mutations in the viral genomes that did not undergo HSS showed similar rates between two timepoints (Fig. S6). Interestingly, after the new homogeneous viral population completely replaced the previous viral quasispecies due to HSS in JN16, the numbers of synonymous and nonsynonymous mutations started to increase (Fig. 3), indicating that the host selection pressure exerted by HSS was no longer able to suppress these newly selected homogeneous viruses, and the viruses continued to evolve ([Fig. 3 and 2C](#F3 F2)).
Identification of predominant/fixed mutations in known T cell epitopes after HSS
After HSS, a number of mutations were fixed (100%) or predominant (>90%) in the viral population in each patient, indicating that they were strongly selected. These mutations together caused a dramatic viral population shift in all three HSS patients. To investigate whether these mutations were under selection pressure from immune responses, we determined whether any of these mutations occurred in known T and B cell epitopes. The MHR of HBsAg (aa 99–169) containing the “a” determinant is the main target for nAb (50). Examination of the amino acid substitutions in MHR did not show any strongly selected predominant/fixed mutations before and after HSS among all three patients (Fig. S7). In addition, no amino acid substitutions resulted in changes at N-linked glycosylation (NLG) sites in the entire S protein. Thus, nAbs did not likely play a role during HSS in these CHB patients.
The HBV-specific T cell responses are extremely weak, which has made it very difficult to analyze in CHB patients (51, 52). We also only had plasma samples from the patients, which prevented us from performing T cell immune response analysis. However, we were able to determine whether any of these predominant/fixed mutations selected by HSS were present in well-characterized T cell epitopes and thus potentially escaped from T cell responses. In JN14, 17 mutations were strongly selected by HSS. They were either predominant (>97%) or fixed in the viral population after HSS (Fig. S7A). Seven mutations were found in five known HLA-I-restricted epitopes (Fig. 4A; Table 1). The two other mutations (F335Y and I387M) in the S protein were known wild type (53). Therefore, they were not likely under the pressure of T cell selection.
Identification of predominant and fixed mutations in well-characterized T cell epitopes. (A) The sequence alignments of the well-characterized T cell epitopes restricted by HLA-I with viral sequences with predominant/fixed mutations from JN14, JN11, and JN16 before and after HSS. (B) The sequence alignments of the well-characterized T cell epitopes restricted by HLA-I with viral sequences with mutations between the HSS-selected viruses and the newly evolved viruses in JN16. (C) The sequence alignments of the well-characterized T cell epitopes restricted by HLA-II with viral sequences with predominant/fixed mutations from JN14, JN11, and JN16 before and after HSS. Various kinds of mutations are indicated by different color schemes as shown in the legends.
Among 21 predominant/fixed mutations identified in JN16, 12 were found in 11 known HLA-I-restricted epitopes (Table 1). One preexisting mutation F335Y in the HBs335-343 epitope of the S protein was known as wild type as seen in JN14. One mutation in a Pol epitope (HBp77-85) was a reversion mutation that mutated back to the wild type. Thus, these two mutations should not be associated with escape from T cell responses. Interestingly, from the second timepoint (highly homogeneous viral population selected by the strong HSS) to the third timepoint, the viruses continued to evolve and became more diversified ([Fig. 2C and 3](#F2 F3)). Three new predominant mutations (67%–83%) were detected in three known HLA-I-restricted epitopes (Fig. 4B; Fig. S7B). In addition, two or three different amino acid substitutions were found in two epitopes. These indicate that the viruses were under a new round of selection from the T cell immune responses after HSS. However, no fixed escape mutations and multiple different mutations in the same T cell epitopes indicate that it was still at the early stage of the T cell selection.
There were 13 fixed mutations in JN11. Five of them were found in four known HLA-I-restricted epitopes (Fig. 4A; Fig. S7A). However, only one in a Pol epitope (HBp261-269) was a potential escape mutation, while all the other three are reversion mutations. Interestingly, all four epitopes already had mutations at the first timepoint, suggesting that they all had escaped from the earlier T cell selection pressure.
The fixed mutations were also found in one or two known HLA-II-restricted epitopes in each patient (Fig. 4C; Table 1). In addition, many mutations were not found in known T and B cell epitopes in each patient (Fig. S7; Table 1). Their roles warrant more in-depth analysis in future studies. Taken together, the identification of the potential escape mutations in well-characterized T cell epitopes indicates that escape from T cell immune response plays an important role in HSS.
HSS increases the evolutionary rate of HBV
Analysis of the sequences from two different timepoints from each patient showed increases in the average diversity levels of the viral population in the CHB patients without HSS over time (Fig. 5). This indicates that the viruses continuously evolved, although the viruses from the two different timepoints were not fully distinguishable from each other (Fig. 2A; Fig. S3). However, the diversity levels of the viral populations were significantly decreased during HSS in all three CHB patients (Fig. 5). The Shannon entropy analysis of the sequences at two different timepoints for each patient also showed the same result. The Shannon entropy of the viral population after HSS was dramatically reduced in the three CHB patients, while it was maintained at similar levels at both timepoints in the CHB patients without HSS (Fig. S8). With these sequences from longitudinal samples, we were able to compare the HBV evolutionary rate in patients with or without HSS (Table 2; Table S3). The average evolutionary rate was 2.63 × 10^−4^ substitutions per site per year for viruses without HSS, consistent with the previous reports (3.7 × 10^−6^ to 7.72 × 10^−4^) (43, 54–59). However, it was 4.77 × 10^−3^ substitutions per site per year for viruses with HSS (Table 2). It was as high as 1.14 × 10^−2^ for JN16. Thus, the evolutionary rate of HBV under HSS is about 10–100 times faster than HBV not under HSS (Table 2; Table S3). Interestingly, the evolutionary rate of HBV returned to the normal rate (8.56 × 10^−4^ per site per year) after HSS in the same patient JN16. This demonstrates that the HBV evolutionary rate can dramatically increase during HSS.
Strong reduction of genetic diversity levels after the HSS. The genetic diversity was determined by calculating the P-distance of viral sequences from each timepoint sample. The pairwise genetic distances from different timepoints in each patient were compared. The first, second, and third timepoint samples were indicated by red, blue, and green circles, respectively. Statistical comparisons were carried out using the Mann-Whitney U test or Kruskal-Wallis test.
DISCUSSION
The strong HSS on the whole viral genome has been observed during transmission and under selection of antiviral drugs in HIV and HCV (18, 36–39). However, such a strong HSS on viral populations has not been observed within a host during chronic viral infection. By analyzing the bona fide quasispecies viral populations from the longitudinal samples, we found that strong HSS frequently occurred among CHB patients (30%), and it was so strong that it drove the viral quasispecies into a highly homogeneous viral population. The nearly identical NFL sequences in the viral population after HSS strongly suggest that this homogeneous viral population originated from a single infected cell, while HBV in all but one infected cell was eliminated during HSS. None of the initial diverse viruses were detected more than 2 years after the HSS in one patient. This further confirms that the diverse viruses have been selected out by HSS.
No mutations were found in the HBsAg MHR region, which is the only known target for nAbs, and all three CHB patients were not treated with antiviral drugs (Table S1). Thus, this strong HSS was not likely caused by nAbs or antiviral drugs. However, the predominant/fixed mutations were detected in the well-characterized T cell epitopes in all three patients, suggesting that T cell immune responses play an important role in HSS. In addition, some fixed mutations were also found at sites not associated with known T cell epitopes. These mutations might also play a role in the strong HSS if they are present in T cell epitopes that have not been identified yet. Thus, it will be important to characterize these predominant/fixed mutations in or outside known T cell epitopes to investigate their roles in escape from T cell immune responses during HSS in future studies.
About 95% of acute HBV infections can be cleared, demonstrating the important role of the host immune system (1). Even though both B and T cell immune responses are generally exhausted during CHB (45–49), the self-clearance of HBsAg still naturally occurs in about 1% of HBsAg-positive patients per year (40–42). This indicates the host immune system still can eliminate the viruses during CHB in rare cases, but the mechanism of HBsAg self-clearance remains unresolved. In this study, we showed that the selection force of HSS was so strong that it drove the diverse viral population into a highly homogeneous viral population, possibly from a single infected cell, in CHB. This indicates that the immune responses, likely the T cell responses, can drive HBV very close to extinction during chronic infection. If the selection pressure that causes HSS can be boosted a little more to eliminate the highly homogeneous viruses from the last remaining single HBV-infected cell, this can lead to a functional cure of CHB as seen in the self-clearance of HBsAg (40, 60).
Our analysis of the JN14 sequences showed that the viruses at the second timepoint were like the result of recombination. One recombinant fragment contained eight mutations that were detected in the minority viral population (four sequences) at the first timepoint, while the other recombinant fragment contained nine new mutations that were not detected in the viral population at the first timepoint. Thus, it is very likely that these viruses were generated through recombination between those divergent minority viruses and an undetected virus population. Such recombinants have been frequently observed during HIV-1 evolution (19, 21, 61). Importantly, these results indicate that recombination may be an important way for viruses to survive the strong HSS.
Because of the dramatic viral population change, the evolutionary rate of HBV increased by 10- to 100-fold during HSS. Thus, HBV does not evolve linearly in the infected hosts over time. Thus, the genetic diversity levels of the viral populations will depend on the time when the samples are collected. It will be highly diverse in CHB patients without HSS but highly homogeneous in CHB patients right after HSS, no matter how long the infections are. Importantly, the much faster evolutionary rate caused by HSS also has a significant impact on the estimation of the molecular evolutionary rate of HBV.
Overall, our results show that the frequent occurrence of HSS in CHB patients significantly impacts HBV evolution, the diversity of the viral population, and the pathogenesis of CHB. HSS is so forceful that only one infected cell is not eliminated in the CHB patient, very close to the extinction of HBV. Viral load assays have been frequently used to monitor the antiviral treatment efficacy in CHB patients. Thus, the blood samples are readily available and can be easily used for the SGS analysis to determine if the viruses in the patients experience HSS. Our data show that the viruses under HSS can last for about 1 year. This gives sufficient time to monitor the presence of HSS during CHB. Since T cell immune responses are most likely the forces that cause HSS, closely monitoring viral population changes, identifying T cell immune responses leading to HSS, and enhancing the T cell responses can serve as a promising approach to cure CHB by eliminating the highly homogeneous viral population or the last infected cell during HSS.
MATERIALS AND METHODS
Patients
Sixteen CHB patients were enrolled in this study. Twelve CHB patients (JN01–JN12) were admitted to the First Affiliated Hospital of Jinan University. Among them, follow-up samples were collected from six patients 6 months later (JN07–JN12). Four CHB patients (JN13–JN16) were admitted to Nanfang Hospital of Southern Medical University. Written consent was obtained from all patients, and the study was approved by the ethics committee of The First Affiliated Hospital (KY-2022-044) and Nanfang Hospital of Southern Medical University (NFEC-2020-290). One follow-up sample was collected from each patient 3–5 years later from three patients (JN13–JN15). Two samples from two timepoints (1.4 and 3.75 years from the first timepoint, respectively) were collected from JN16. Thirteen CHB patients were infected for at least 10 years (up to 25 years). The infection time could not be determined for the other three patients (JN09, JN11, and JN12). The average of viral loads was 4.51 × 10^7^ (9.41 × 10^2^ to 5.45 × 10^8^) IU/mL. HBsAg was positive for all 16 patients, while HBeAg was positive for 9 patients. Eight patients were treated with tenofovir disoproxil fumarate (TDF), but no TDF-associated resistance mutations were detected at the time when plasma samples were analyzed. In all four samples (JN13–JN16) which were followed for about 4 years, none were treated with any antiviral drugs. All patients were negative for HCV and HIV-1 infections. Only plasma samples were archived and available for this study from all 16 patients since they enrolled for studies in which only plasma was collected. All samples were stored at −80°C.
Single genome amplification of near full-length HBV genomes
HBV genomic DNA was extracted from 200 µL plasma of each sample using the QIAamp DNA Mini Kit (Qiagen, Hilden, Germany). Single genome amplification (SGA) was performed to obtain NFL HBV genome sequences using Phanta Flash Master Mix (Vazyme, Nanjing, China) as previously reported (18). The first round of PCR was carried out with the primers P1 (5′-TTTTTCACCTCTGCCTAATCA-3′; nt 1,823–1,843) and P2 (5′-AAAAAGTTGCATGGTGCTGG-3′; nt 1,827–1,808), and the second round PCR was done with the primers NPP1 (5′-ACCTCTGCCTAATCATCTCTTGT-3′; nt 1,829–1,851) and NPP2 (5′-GTTGCATGGTGCTGGTGCGCAG-3′; nt 1,822–1,801. The PCR conditions for both rounds were as follows: an initial denaturation at 98°C for 30 s, followed by 35 cycles of denaturation at 98°C for 10 s, annealing at 58°C for 5 s, and extension at 72°C for 15 s, and a final extension at 72°C for 1 min.
DNA sequencing
The PCR products (~3.2 kbp) were purified with the E.Z.N.A. Cycle-Pure Kit (Omega Bio-Tek, Georgia, USA) and subjected to cycle sequencing using BigDye terminator v3.1 (Applied Biosystems, Foster City, USA) on the ABI 3730XL DNA analyzer. Sequence contigs from each SGA were assembled and edited using Sequencher 5.4 (Gene Codes, Ann Arbor, USA). The final sequences were deposited in GenBank (accession numbers: PQ335234–PQ336013).
Sequence analysis
The final assembled SGA sequences from each patient were aligned using the MAFFT version 7 (https://mafft.cbrc.jp/alignment/server/index.html). The resulting alignment was inspected using Seaview (62) and corrected around large indels when necessary. The consensus sequence was generated by aligning multiple viral sequences from the same patient, calculating the frequencies of the nucleotide or amino acid at each site in the alignment at the first timepoint, and selecting the base or amino acid with a frequency of ≥60% at each site. Highlighter mutation plots were generated using the Highlighter tool (18) (https://www.hiv.lanl.gov/content/sequence/HIGHLIGHT/highlighter_top.html). Sequences exhibiting significant hypersubstitutions (P < 0.1) and those enriched for APOBEC-mediated G-to-A substitutions were excluded from subsequent analysis utilizing the Hypermut tool (63) (https://www.hiv.lanl.gov/content/sequence/HYPERMUT/hypermut.html). The Maximum Likelihood phylogenetic tree was constructed using the GTR model via IQ-TREE (64) (https://www.hiv.lanl.gov/content/sequence/IQTREE/iqtree.html) or PhyML (65) (https://www.hiv.lanl.gov/content/sequence/PHYML/interface.html). The topology of the tree was assessed through 1,000 bootstrap replicates or Approximate Likelihood Ratio Test. Within-lineage genetic pairwise P-distances were computed using the sequences from each sample with MEGA v11 (66). HIV Sequence Database software (https://www.hiv.lanl.gov/content/sequence/ENTROPY/entropy.html) examines the Shannon entropy of viral quasispecies at different timepoints and uses randomization calculations to calculate statistical confidence. The accumulation of synonymous and nonsynonymous mutations for each of the four open reading frames (PreC_Core, Pol, PreS1_S2_S, and X) was assessed using the Synonymous Nonsynonymous Analysis Program (SNAP) tool (67) (https://www.hiv.lanl.gov/content/sequence/SNAP/SNAP.html) through pairwise comparison of all sequences within the four overlapping open reading frames of samples from different timepoints. Sites under positive selection, identified with a cutoff of P = 0.05, were determined utilizing the online Mixed Effects Model of Evolution tool from the Datamonkey server (68).
Identification of potential immune escape mutations
Sequence fragments containing the MHR of HBsAg including the “a” determinant in the S gene from each patient contained the major target for nAbs and aligned. Any predominant and fixed mutation between different timepoints was examined to identify potential nAb escape mutations. NLG sites were analyzed with the tool from Los Alamos National laboratory websites (https://www.hiv.lanl.gov/content/sequence/GLYCOSITE/glycosite.html) (69) to identify changes in NLG sites. To identify potential T cell escape mutations, predominant and fixed mutations after HSS were examined against well-characterized T cell epitopes in the Hepitopes database (https://www.expmedndm.ox.ac.uk/hepitopes) (70), Immune Epitope Database (https://www.iedb.org) (71), and reported in previous studies (53, 72, 73).
Evolutionary rate assessment
The sampling time of the sequences was used as a calibration point for the Bayesian Markov Chain Monte Carlo analysis to estimate the evolutionary rate of HBV in each patient. Constant coalescent, exponential coalescent, and Bayesian skyline coalescent tree priors were used with either a strict or a relaxed lognormal clock model. All models were run using the GTR + G4 substitution model in BEAST v2 (74) with a total Markov chain length set to 200 M, including a 10% burn-in. Path sampling was performed to select the best combination model. Convergence was assessed by ensuring that the effective sample size for each parameter was greater than 200.
Statistical analysis
Statistical analysis was performed using SPSS 25.0. The Kruskal-Wallis test was used for multiple group analyses, and the Mann-Whitney test was used for comparisons between two groups. All tests were performed as two-sided tests, with P < 0.05 considered significant.
The reference list from the paper itself. Each links out to its DOI / PubMed record.
- 1Terrault NA, Lok ASF, Mc Mahon BJ, Chang K-M, Hwang JP, Jonas MM, Brown RS, Bzowej NH, Wong JB. 2018. Update on prevention, diagnosis, and treatment of chronic hepatitis B. Hepatology 67:1560–1599. doi:10.1002/hep.2980029405329 PMC 5975958 · doi ↗ · pubmed ↗
- 2Seeger C, Mason WS. 2000. Hepatitis B virus biology. Microbiol Mol Biol Rev 64:51–68. doi:10.1128/MMBR.64.1.51-68.200010704474 PMC 98986 · doi ↗ · pubmed ↗
- 3Ganem D, Prince AM. 2004. Hepatitis B virus infection--natural history and clinical consequences. N Engl J Med 350:1118–1129. doi:10.1056/NEJ Mra 03108715014185 · doi ↗ · pubmed ↗
- 4Hepatitis B. Available from: https://www.who.int/news-room/fact-sheets/detail/hepatitis-b. Retrieved 16 Aug 2024.
- 5Domingo E, Gomez J. 2007. Quasispecies and its impact on viral hepatitis. Virus Res 127:131–150. doi:10.1016/j.virusres.2007.02.00117349710 PMC 7125676 · doi ↗ · pubmed ↗
- 6Betz-Stablein BD, Töpfer A, Littlejohn M, Yuen L, Colledge D, Sozzi V, Angus P, Thompson A, Revill P, Beerenwinkel N, Warner N, Luciani F. 2016. Single-molecule sequencing reveals complex genome variation of hepatitis B virus during 15 years of chronic infection following liver transplantation. J Virol 90:7171–7183. doi:10.1128/JVI.00243-1627252524 PMC 4984637 · doi ↗ · pubmed ↗
- 7Vignuzzi M, Stone JK, Arnold JJ, Cameron CE, Andino R. 2006. Quasispecies diversity determines pathogenesis through cooperative interactions in a viral population. Nature 439:344–348. doi:10.1038/nature 0438816327776 PMC 1569948 · doi ↗ · pubmed ↗
- 8Farci P, Shimoda A, Coiana A, Diaz G, Peddis G, Melpolder JC, Strazzera A, Chien DY, Munoz SJ, Balestrieri A, Purcell RH, Alter HJ. 2000. The outcome of acute hepatitis C predicted by the evolution of the viral quasispecies. Science 288:339–344. doi:10.1126/science.288.5464.33910764648 · doi ↗ · pubmed ↗