Transcriptome-wide N6-methyladenosinem modifications analysis of chicken cecum in responding to Campylobacter jejuni inoculation
Yanan Zhao, Yuanmei Wang, Liying Liu, Yanru Ren, Long Liu, Jiayi Wang, Xianyao Li

TL;DR
This study explores how N6-methyladenosine (m6A) modifications in chicken cecum cells respond to Campylobacter jejuni infection, identifying key regulatory genes and pathways.
Contribution
The study identifies YTHDC2 as a key regulator of m6A modifications in chicken cecum during C. jejuni infection and reveals associated gene pathways.
Findings
m6A modifications in chicken cecum correlate with immune response genes during C. jejuni infection.
YTHDC2 regulates apoptosis and autophagy in chicken macrophage-like cells during infection.
Differential m6A peaks and gene expression are linked to NF-kappaB and toll-like receptor signaling pathways.
Abstract
Campylobacter jejuni (C. jejuni), a commensal food-borne pathogen, poses severe threat to human health and poultry industry. N6-methyladenosine (m6A) mRNA modification is associated with innate immunity. However, the mechanism of m6A modification in C. jejuni chicken cecum inoculation remains unclear. Here, we characterized the cecal m6A modification landscape of chicken in the C. jejuni-resistant (R) and susceptible (S) groups using methylated RNA immunoprecipitation sequencing and RNA sequencing (RNA-seq), and further conducted the in vitro C. jejuni inflammatory model based on chicken macrophage-like cell line (HD11) to elucidate the specific mechanism. In the S group, the level of proinflammatory cytokines (IL-8, IL-1β, IL-18, TNF-α, IL-17A) and global RNA methylation were significantly decreased (P < 0.05). A total of 30,427 and 30,367 m6A peaks were identified in R and S groups,…
Genes, proteins, chemicals, diseases, species, mutations and cell lines named across the full text — each resolved to its canonical identifier and authoritative record.
Click any figure to enlarge with its caption.
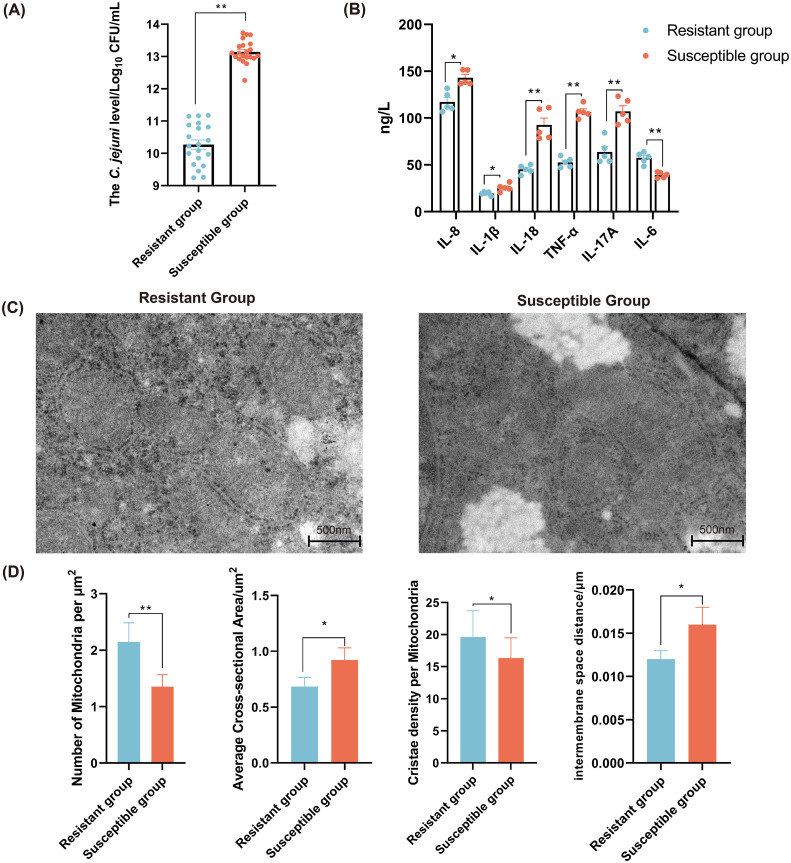 Figure 1
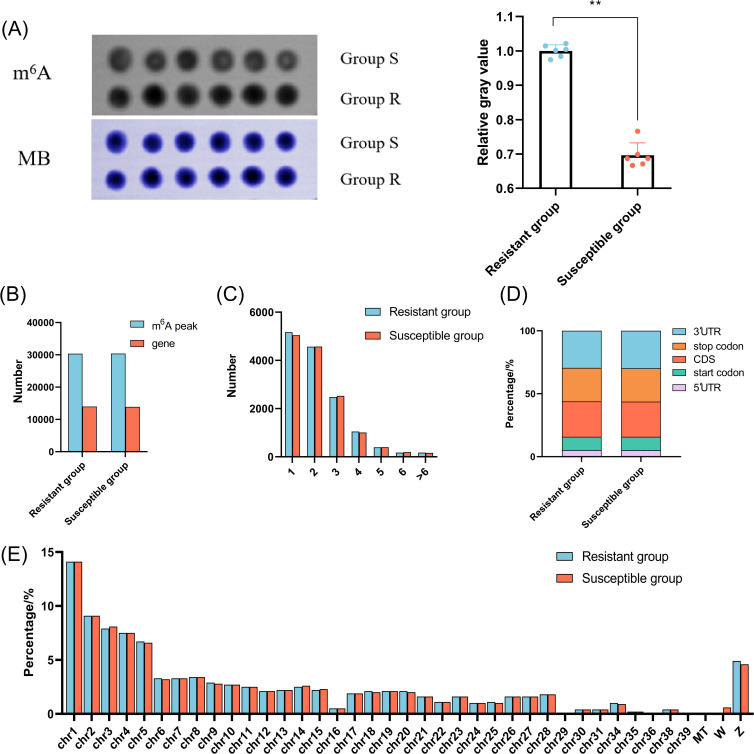 Figure 2
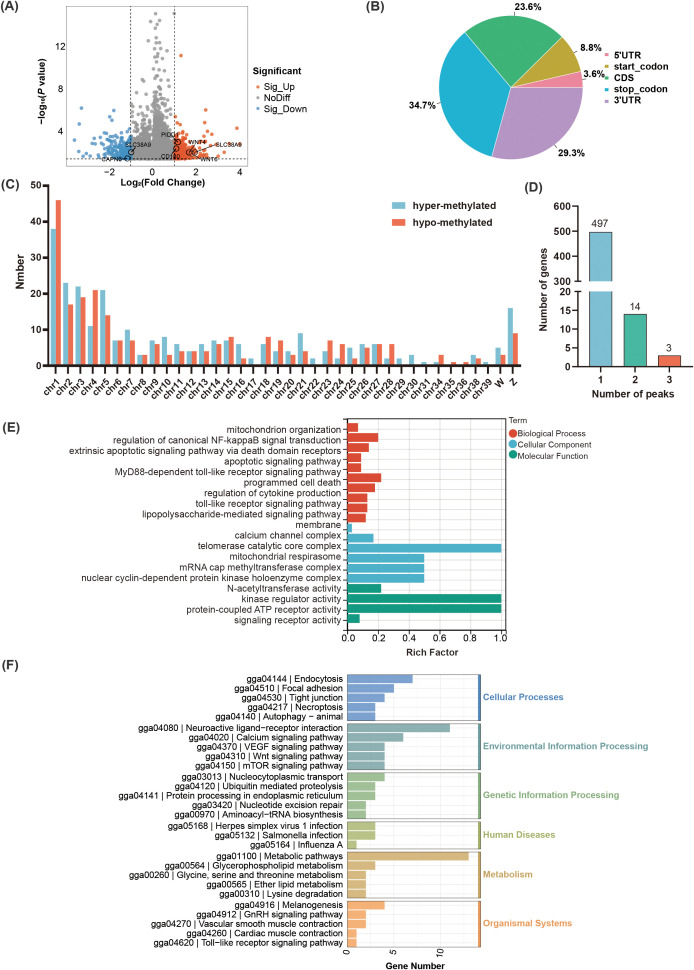 Figure 3
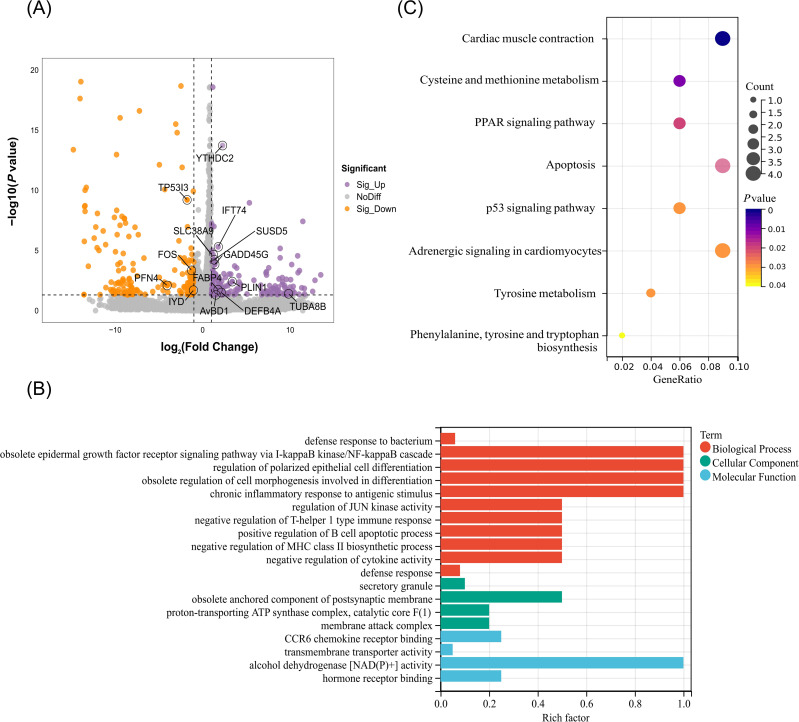 Figure 4
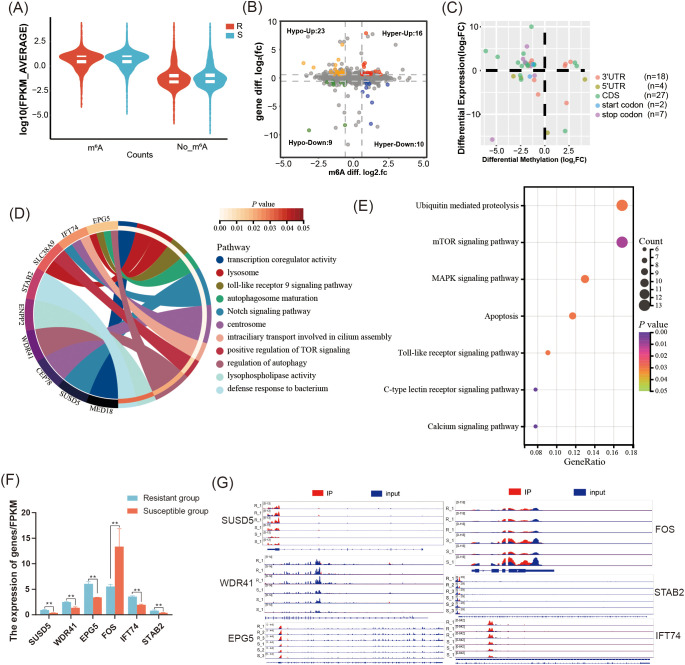 Figure 5
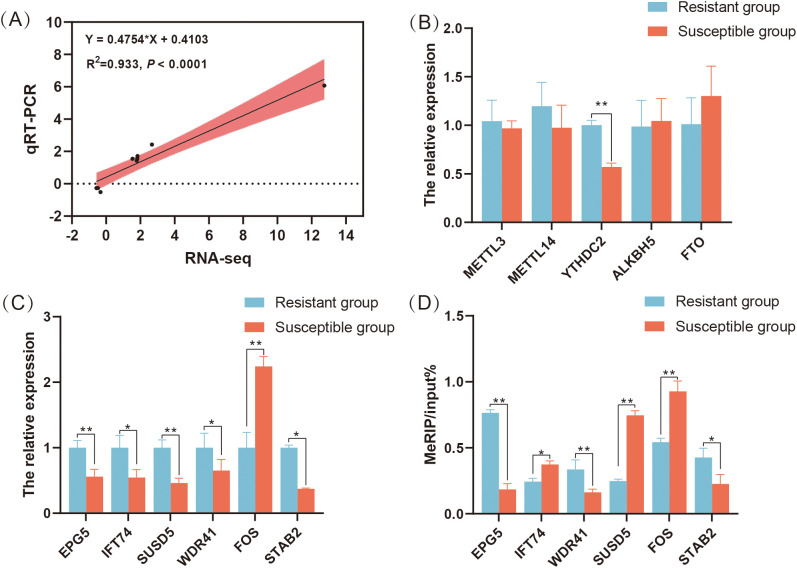 Figure 6
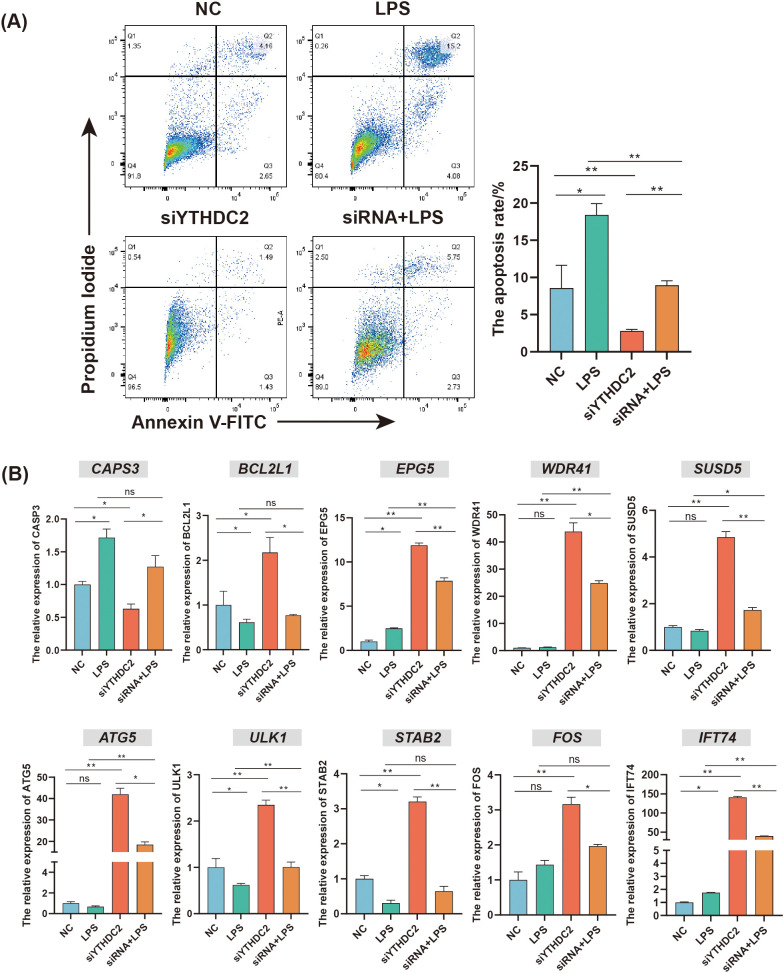 Figure 7
Peer Reviews
No public reviews on file for this paper yet. If you reviewed it on a platform where reviews are public (OpenReview, ICLR, NeurIPS, ICML), you can paste yours below so the community can read it here.
Videos
No videos yet. Explain this paper in a talk, walkthrough, or lecture? Add one.
Taxonomy
TopicsRNA modifications and cancer · Corrosion Behavior and Inhibition · RNA and protein synthesis mechanisms
Introduction
1
Campylobacter jejuni (C. jejuni), a foodborne bacterial pathogen, is considered a major causative agent of bacterial gastroenteritis (1). It causes severe diarrheal symptoms, accompanied by fever, nausea and abdominal cramping (2), and poses a sever threat to the poultry industry and human health (3). In 2010, C. jejuni caused an estimated 96 million cases of diarrheal illness, contributing to approximately 37,600 deaths worldwide (4). Human bacterial gastroenteritis is primarily attributed to Campylobacter species, among which C. jejuni is responsible for approximately 90% of reported cases (5). Human infection typically results from the ingestion of contaminated animal food products, particularly poultry, where C. jejuni colonizes as part of the natural intestinal microbiota (6). C. jejuni primarily colonizes the chicken cecum and subsequently disseminates to systemic tissues, resulting in contamination of poultry meat and eggs (7–9). C. jejuni can cause intestinal damage, disrupt gut barrier function, and facilitate the translocation of luminal bacteria to internal organs (10, 11). Despite extensive efforts in vaccination and antibiotic applications, C. jejuni remains persistent in commercial poultry production. Notably, emerging evidence demonstrates that genetic selection strategies effectively enhance host resistance to C. jejuni challenge in chickens, offering a sustainable alternative for disease control (12–14).
The host immune response plays a critical role in responding to C. jejuni inoculation. The activation of both innate and adaptive immune responses is critical for controlling Campylobacter inoculation (15, 16). Multiple studies have documented immune or metabolic genes closely correlated with resistance in chickens to C. jejuni inoculation, including factors such as the major histocompatibility complex (MHC), cadherins, and other genetic elements (17). Briefly, the MHC has been identified as a critical genetic determinant in resistance to Campylobacter in commercial broiler chickens (18). The resistance to C. jejuni inoculation in the chicken intestine has been linked to a locus spanning CDH13 (19). Chickens with an inherently high phenotype of pro-inflammatory mediators, including IL-6, CXCLi2, and CCLi2, are more resistant to Campylobacter inoculation (20). Disruption of flhF abolishes sustained C. jejuni invasion capacity in the avian intestinal tract (21). The expression of the host defense peptides (HDPs) including AvBD1-2, CATH1-3, AvBD7, AvBD4, and AvBD6 were suppressed in chicken HD11 cell following C. jejuni inoculation (22). Additionally, miR-155, as a vital regulator, could involve in regulating the C. jejuni inoculation in chicken (23). The miR-30 and miR-148/miR-152 families exhibit time-dependent regulation in response to Campylobacter inoculation in chickens (24). Recent studies revealed that post-transcriptional modifications play crucial roles in regulating the immune system following C. jejuni inoculation (25). The recognition of m^6^A methylation within the coding sequence (CDS) by YTHDC2 promotes the overall translation efficiency, whereas knockdown YTHDC2 substantially reduces protein synthesis (26).
N6-methyladenosine (m^6^A), the most prevalent post-transcriptional modification, regulate various biological processes including reproduction (27), growth and development (28, 29), immunity (30, 31), and metabolism (32, 33) through altering mRNA splicing, export, translation, and degradation (34, 35). Recent study revealed that resveratrol augments antioxidant and anti-apoptotic functions in chicken primordial germ cells via m^6^A methylation (36). m^6^A modification is catalyzed by three classes of key regulators, writers (e.g., METTL3, METTL14), erasers (e.g., ALKBH5, FTO) and readers (e.g., YTHDC2, YTHDF2) (37). METTL3 is involved in M1 macrophage polarization and pyroptosis during liver fibrosis (38). It is reported that LPS inoculation alters the m^6^A methylation on the transcripts of GR and impairs its mRNA stability in a YTHDF2-dependent manner, which leads to the decrease of its protein (Zhao et al., 2025). YTHDC2 suppresses antiviral immunity through ISG20-dependent degradation of IFN-β mRNA in macrophages during late-stage viral infection (39). Lactylation of ALKBH5 enhances innate immune responses to DNA viruses including herpesviruses and mpox virus (40). However, the mechanism underlying m^6^A modification in chicken in response to C. jejuni inoculation remains poorly understood.
To elucidate the regulatory role of m^6^A modification in the chicken immune response to C. jejuni inoculation, the cecal m^6^A modification landscape in susceptible and resistant groups were characterized using MeRIP-seq and RNA-seq. Numerous differential m^6^A methylation peaks and corresponding differentially expressed genes potentially were involved in host defense mechanisms against C. jejuni. Notably, YTHDC2 regulates resistance to C. jejuni inoculation by modulating immune-related gene expression, as confirmed through in vitro experiments. These findings provide new insights into epigenetic regulation of avian host-pathogen interactions.
Materials and methods
2
C. jejuni inoculation and sample collection
2.1
A total of 70 day-3 C. jejuni-free specific pathogen-free (SPF) White Leghorn chickens (Jinan SAIS Poultry Co., Ltd, China) were used in the current study. The C. jejuni (ATCC 33291) strain was obtained from the China Center of Industrial Culture Collection (CICC). Chickens were raised in sterilized isolators with free access to feed and water. Each chicken was orally inoculated with 0.5 mL of C. jejuni solution (1.68 × 10^8^ CFU/mL). All procedures were performed under strict sterilization conditions. At 8 hours post-inoculation with C. jejuni, the venous blood, liver, cecal content, and cecum were collected from each individual, and immediately frozen in liquid nitrogen.
To quantify the C. jejuni levels, 0.1 g cecal content from each chicken was collected and serially diluted with sterile PBS. Subsequently, the cecum content was cultured on Columbia Blood Agar Base plates (Sigma, USA) under microaerophilic conditions (42°C, 85% N_2_, 10% CO_2_, and 5% O_2_) for 48 hours. Chicken with over 1.86×10^13^ CFU/mL C. jejuni in cecal content was classified as the susceptible group (S group), and chicken with below 4.36×10^10^ CFU/mL was assigned to the resistant group (R group). All experimental protocols were approved by the Ethics Committee on the Care and Use of Laboratory Animals at Shandong Agricultural University (Approval Number: SDAUA-2019-060).
Mitochondrial electron microscopy observation
2.2
Approximately 1–2 mm^3^ liver tissue from each chicken was fixed in a 2.5% glutaraldehyde and washed with 0.1 M phosphate buffer for three times. After post-fixation with 1% osmium tetroxide in 0.1 M phosphate buffer, tissues were dehydrated through a graded ethanol series (30%, 50%, 70%, 90%, and 100%) for 10 minutes per concentration. The tissue was embedded in epoxy resin (Epon 812, Epon, USA), and polymerized at 60°C for 48 hours. Ultrathin sections (60–90 nm) were prepared and examined using a transmission electron microscope (TEM) (Hitachi, Japan) at a magnifications of 80,000x. ImageJ 1.8.0 was used to quantify the mitochondrial length, width, area, and the number of mitochondrial cristae.
The concentration of immune factors in chicken serum
2.3
To collect the serum, the venous blood was collected from each chicken in the R and S groups, and centrifuged at 3000 × g for 10 minutes at 4°C. IgA (ml002792), IL-6 (ml059839), IL-18 (ml042769), IL-1β (ml002787), IL-17A (ml023404), and TNF-α (ml002790) ELISA kits (MLBIO, Shanghai, China) were used to determine the serum cytokines’ levels according to the manufacturer’s instructions, respectively.
m6A immunoprecipitation, library construction and sequencing
2.4
Total RNA was isolated from cecum sample using the Total RNA Kit I (Omega, Hunt Valley, USA) according to the manufacturer’s instructions. The integrity and concentration of RNA were measured using Agilent 2100 Bioanalyzer (Agilent, California, USA) and Nanodrop 2000 (Nanodrop, Wilmington, DE), respectively. Total RNA was purified using the Dynabeads Oligo (dT) (Thermo Fisher Scientific, Massachusetts, USA), and fragmented into approximately 100 nucleotides. The fragmented RNA of each individual was clustered into two libraries: an immunoprecipitation (IP) library and an input library. For the IP library, the fragmented RNA was incubated with an m^6^A-specific antibody in IP buffer (50 mM Tris-HCl, 750 mM NaCl, and 0.5% Igepal CA-630) for 2 hours at 4°C. The IP and input RNA was then reverse-transcribed into cDNA using SuperScript II Reverse Transcriptase (Invitrogen, Waltham, USA), and second-strand synthesis was conducted with NEBNext^®^ Ultra™ II Directional RNA Library Prep Kit (New England Biolabs, USA). Finally, a total of six libraries in each group (3 replicates × (IP + input)) were constructed, and subjected to paired-end 150 bp sequencing using the Illumina NovaSeq 6000 platform (LC-Bio Technology Co., Ltd., Hangzhou, China).
Bioinformatics analysis
2.5
The adapter sequences, duplicate reads, and low quality reads were filtered out from raw data with the default parameters using fastp (41). The clean reads were mapped to the Gallus gallus reference genome (GRCg7b) using HISAT2 (42). Peak calling analysis was performed with the R package ExomePeak (43). The candidate peak region within the genome was tested by the Poisson distribution model to assess the statistical significance of read enrichment, and the region with P value < 0.05 was considered a peak. The differentially methylated m^6^A peaks (DMPs) between resistant and susceptible groups were identified using Fisher’s test. The distribution of m^6^A peaks across functional elements (5′UTR, start codon, CDS, stop codon, and 3′UTR) was annotated using ANNOVAR (44). Subsequently, the identification and visualization of m^6^A motifs enriched within peak regions were performed using HOMER (45) and the BioSeqUtils package in R (46). The gene expression was quantified using StringTie (47) with default parameters. The differentially expressed genes (DEGs) between R group and S group was identified with DESeq2 package (48). The genes with |log_2_Fold change| ≥ 1 and P value < 0.05 were considered DEGs. The DEG harboring at least one DMPs was defined as the differentially methylated gene (DMG). Gene ontology (GO) and Kyoto Encyclopedia of Genes and Genomes (KEGG) enrichment analysis for DMPs, DEGs and DMGs was performed using the LC-Bio OmicStudio platform (https://www.omicstudio.cn/home).
RNA m6A dot blot assay
2.6
The total RNA from each cecum was denatured at 95°C for 3 minutes and cross-linked to an Immobilon-Ny+ Nylon Membrane Roll (Merck Millipore, Germany). The unbound RNA was washed with Tris-buffered saline containing 0.1% Tween 20 for 5 minutes. After blocking with 5% skimmed milk (BI, Germany) for 1 hour, the membrane was incubated with an anti-m^6^A antibody (1:250 dilution; ab286164, abcam) at 4°C overnight with gentle shaking. Subsequently, the membrane was incubated with an anti-mouse IgG secondary antibody (1:5,000 dilution; ab190475, Abcam) for 1 hour at room temperature. The m^6^A levels were visualized using a chemiluminescent substrate in a chemiluminescence imaging system (Fusion Fx Vilber Lourmat, France) and then quantified using ImageJ 1.8.0.
MeRIP-PCR
2.7
Following RNA extraction, poly(A)+ RNA was selectively purified using oligo(dT) magnetic beads (Thermo Fisher Scientific, Massachusetts, USA), and fragmented into approximately 100 nts using the Magnesium RNA Fragmentation Kit (New England Biolabs, USA) following the manufacturer’s instructions. The fragmented RNA was then subjected to immunoprecipitation with an m^6^A-specific antibody (Synaptic Systems, Göttingen, Germany) conjugated to Protein A/G magnetic beads (Invitrogen, USA). Both the immunoprecipitated RNA and input RNA were reverse transcribed into cDNA using the PrimeScript RT Reagent Kit (Takara, Dalian, China). qRT-PCR was performed using SYBR Premix Dimer Eraser (Takara, Dalian, China) and specific primers (Sangon, Shanghai, China) on Roche LightCycler^®^ 96 System (Supplementary Table S1).
Cell culture, siRNA and LPS challenge
2.8
The chicken macrophage-like cell line (HD11) was provided by ShanghaiNulen Biotech. (Shanghai, China). HD11 were cultured in Dulbecco’s modified Eagle’s medium (DMEM) (Gibco, Invitrogen, Carlsbad, CA), supplemented with 10% fetal bovine serum (Gibico, Thermo Fisher Scientific, Australia) and 1% penicillin and streptomycin (Servicebio, Beijing, China) at 37 °C in a humidified atmosphere of 5 % CO_2_ for amplification. Cells were subcultured when they reached 80% to 90% confluence.
The small interfering RNA (si-YTHDC2) for YTHDC2 (Sense: 5’-CAGCUUUAAUUGUGAGAAATT-3’; Anti-sense: 3’-UUUCUCACAAUUAAAGCUGTT-5’) and negative control si-NC were obtained from Sangon Biotech (Shanghai, China). C. jejuni lipopolysacharide (LPS) was obtained from FUJIFILM Wako (Cat. No. 128-05671, Japan). The HD11 cells were seeded in 6-well plates at a density of 1 × 10^6^ cells per well and cultured for 24 h. The si-YTHDC2 or si-NC was transfected using Lipofectamine™ 3000 (Thermo Scientific, Invitrogen, US) in serum-free Opti-MEM^®^I Medium (Gibco, Invitrogen, Carlsbad, CA), and incubated at 37 °C in a humidified atmosphere of 5 % CO_2_ for 8 h. Following 24 hours transfection, the cells were incubated with LPS challenge (5 μg/mL) for 8 h, and the expression of YTHDC2 was detected using RT-qPCR (Supplementary Figure S1).
Flow cytometric analysis
2.9
Apoptosis assay was performed using the Annexin V-FITC/propidium iodide Cell Apoptosis Detection Kit (Servicebio, Wuhan, China) followed by flow cytometry analysis. Briefly, the cells were rinsed and resuspended with 1× binding buffer to a concentration of 5 × 10^6^ cells/mL. A 100 μL cell suspension was incubated with Annexin-FITC (5 μL) and propidium iodide (5 μL) for 10 min at room temperature in the dark. Data were analyzed using Flowjo software (Version: 10.9.1).
Quantitative real-time polymerase chain reaction
2.10
Total RNA from cecum or HD11 was extracted using TRIzol Reagent (Thermo Scientific, Invitrogen, US) following the manufactures’ instructions. One μg total RNA from each sample used for RNA sequencing was reverse-transcribed into cDNA with PrimeScript™ RT Reagent Kit (Takara, Japan). Quantitative real-time PCR (qRT-PCR) was performed using SYBR Premix Dimer Eraser (Takara, Japan) and gene-specific primers (Sangon, Shanghai, China) (Supplementary Table S1). The relative gene expression level was calculated using the 2^ -ΔΔCt^ method.
Statistical analysis
2.11
In the current study, the statistical analysis was performed with SPSS 26.0 software. T-tests and One-way analysis of variance (ANOVA) followed by Tukey’s post hoc test were employed to ascertain differences among groups. Among these, T-tests were used for two groups and One-way ANOVA with Tukey’s multiple comparisons were used for multiple groups (n = 4). The data were presented as mean ± SEM. Results with P value < 0.05 were considered statistically significant.
Results
3
The characterization of immune related traits of chicken in the susceptible and resistant groups
3.1
The C. jejuni colonization level in chicken cecum of the R group was significantly lower than that of the S group (P < 0.01) (Figure 1A). The level of proinflammatory cytokine (IL-8, IL-1β, IL-18, TNF-α, and IL-17A) in the S group was significantly higher compared to the R group. Whereas, the level IL-6 was significantly decreased in the S group (P < 0.05) (Figure 1B). The mitochondria in the R group were closely arranged, clearly visible, and evenly distributed, whereas those in the S group appeared damaged and swollen (Figure 1C). Additionally, the average cross-sectional area and the inter-membrane space distance of mitochondria in the R group were significantly smaller than those in the S group (P < 0.05). Whereas, the number of mitochondria per μm^2^ and the cristae density per mitochondria in the R group were significantly higher than those in the S group (Figure 1D).
*The characterization of immune related traits of chicken in the C. jejuni-susceptible (S) and resistant (R) groups. (A) The C. jejuni colonization levels in chicken cecum of resistant and susceptible groups. (B) The levels of cytokines in chicken serum in the C. jejuni-susceptible and resistant groups. Scale bar, 500 nm. (C) The mitochondrial morphology and ultrastructure of chicken liver in the C. jejuni-susceptible and resistant groups. (D) The indexes of mitochondria of liver in the C. jejuni-susceptible and resistant groups. The data are pooled from 2 independent experiments with 5 replicates per group (n = 5) and presented as the mean ± SEM; , ** representing P < 0.05, and P < 0.01, respectively.
Characterization of m6A methylation
3.2
To elucidate the mechanism underlying chicken responding to C. jejuni inoculation, we evaluated the global level of m^6^A in chicken cecum in the R and S groups using dot blot method. As shown in Figure 2A, the global level of m^6^A modification decreased substantially in S group (P < 0.01). Further analysis of MeRIP-seq and RNA-seq indicated that 40–50 million raw reads were obtained from each sample. After removing the low quality reads, more than 39 million clean reads with Q20 values above 98% were generated from each sample (Supplementary Table S2), and more than 86.86% clean reads could be uniquely aligned to the chicken genome. Moreover, more than 91.82% clean reads could be mapped to the exon region (Supplementary Figure S2). A total of 30,427 and 30,367 m^6^A peaks, corresponding to 13,969 and 13,875 genes, were identified in the R and S groups, respectively (Figure 2B). Most genes contained just 1–2 peaks (Figure 2C). The m^6^A peaks in the R and S groups were predominantly enriched in the 3′UTR, CDS region, and stop codon, followed by the start codon and 5′UTR (Figure 2D). Moreover, m^6^A modifications were widely distributed throughout the chicken genome, with the highest number of peaks located on chromosome 1, accounting for 14.1% in each group (Figure 2E). Additionally, enriched motifs in both groups matched the canonical m^6^A motifs ‘RRACH’ and ‘DRACH’ (R = A or G; D = A, G or U; H = A, C or U), while multiple motifs corresponding to non-canonical m^6^A sites including ‘CUACG’ and ‘CGACG’ were also identified (Supplementary Figure S3).
The characterization of the m6A methylation of chicken cecum in the C. jejuni-susceptible (S) and resistant (R) groups. (A) The global m6A levels of chicken cecum in the C. jejuni-susceptible and resistant groups. The data are pooled from 2 independent experiments with 6 replicates per group (n = 6) and presented as the mean ± SEM; ** representing P < 0.01. (B) The number of identified m6A peaks and genes in the C. jejuni-susceptible and resistant groups. (C). The number of peaks in the corresponding genes in the C. jejuni-susceptible and resistant groups. (D) The distribution of m6A peaks in different genomic features in the C. jejuni-susceptible and resistant groups. (E) The density of m6A peaks on chromosomes in the C. jejuni-susceptible and resistant groups.
Identification and functional analysis of DMPs
3.3
There were 514 DMPs identified between the R group and the S group including 270 hyper-methylated and 244 hypo-methylated peaks (P < 0.05, |log_2_ Fold change| ≥ 1) (Figure 3A, Supplementary Table S3), which mainly located in the stop codon (34.7%) (Figure 3B). Among which, the 270 hyper-methylated peaks were widely distributed on 36 chromosomes, while the 244 hypo-methylated peaks were widely distributed on 32 chromosomes (Figure 3C). Moreover, there were 38 hyper-methylated and 46 hypo-methylated peaks mainly located on chromosome 1. These DMPs were annotated to 514 genes, approximately 98% genes contained one m^6^A peak (Figure 3D). GO enrichment analysis indicated that the DMPs were significantly enriched in 324 terms (212 biological process (BP), 76 molecular function (MF), 36 cellular component (CC)) (P < 0.05) (Supplementary Table S4). In terms of BP, the major immune-related pathways including regulation of mitochondrion organization, regulation of canonical NF-kappaB signal transduction, apoptotic signaling pathway, MyD88-dependent toll-like receptor signaling pathway, and lipopolysaccharide-mediated signaling pathway were significantly enriched (Figure 3E). Notably, PIDD1, ZFAND6, and CAPN3 were significantly enriched in the regulation of canonical NF-kappaB signal transduction, and apoptotic signaling pathway. PTAFR and CD180 were significantly enriched in the lipopolysaccharide-mediated signaling pathway. KEGG pathway enrichment results revealed that the DMPs were significantly enriched in Wnt signaling pathway, mTOR signaling pathway, Toll-like receptor signaling pathway, calcium signaling pathway, VEGF signaling pathway, autophagy, and tight junction (P < 0.05) (Figure 3F). Notably, WNT6, PRKCB, WNT4, and SLC38A9 were demonstrated significantly associated with the mTOR signaling pathway.
Identification and functional analysis of the identified m6A peaks in the C. jejuni-susceptible (S) and resistant (R) groups. (A) The identified m6A peaks in C. jejuni-susceptible and resistant groups. (B). The distribution of differential m6A peaks in different genomic features in the resistant and susceptible groups. (C). The density of m6A peaks on chromosomes. (D) The number of differential m6A peaks in the corresponding genes. (E) The enriched GO terms for the differential m6A peaks. (F) The enriched KEGG pathway of differential m6A peaks.
Correlated analysis of m6A modification and gene expression
3.4
To elucidate the functional consequences of the gene expression modified by m^6^A methylation, the global transcriptomic landscape of chicken cecum in the R and S groups were performed using RNA-seq. Totally, 365 DEGs were identified including 166 upregulated genes and 199 downregulated genes (P < 0.05, |log_2_Fold change| ≥ 1) (Figure 4A, Supplementary Table S5). Notably, the expression of m^6^A modification related gene YTHDC2 were upregulated in the R group, but no significance was observed in other m^6^A modification related genes such as METTL14, FTO, ALKBH5 (Supplementary Figure S4). Further GO and KEGG analysis for DEGs identified 193 significantly enriched terms (128 BP, 49 MF, 16 CC) (P < 0.05) (Supplementary Table S6). In terms of BP, the major immune-related terms including defense response to bacterium, regulation of polarized epithelial cell differentiation, negative regulation of T-helper 1 type immune response, positive regulation of B cell apoptotic process, and negative regulation of cytokine activity were significantly enriched (Figure 4B). Among these, IL-10, DEFB4A, and AvBD1 were significantly enriched in defense response to bacterium. KEGG enrichment results showed that the DEGs were significantly enriched in eight pathways including PPAR signaling pathway, apoptosis, p53 signaling pathway, tyrosine metabolism (P < 0.05) (Figure 4C).
Identification and functional analysis of differentially expressed genes in the C. jejuni-susceptible (S) and resistant (R) groups. (A) The identified genes in the C. jejuni-susceptible and resistant groups. (B) The enriched GO terms of differentially expressed genes. (C) The enriched KEGG pathway of differentially expressed genes.
To elucidate the regulatory role of m^6^A modification, the correlation between m^6^A modification and gene expression was performed. In general, we found that the expression of gene containing m^6^A peak was significantly higher than that of genes without m^6^A modifications in both the R and S groups (P < 0.05) (Figure 5A). Further analysis revealed that 58 DMGs were identified in R group including 26 hyper-methylated DMGs (16 mRNAs upregulated and 10 mRNAs downregulated), and 32 hypo-methylated DMGs (23 mRNAs upregulated and 9 mRNAs downregulated) (Figure 5B, Supplementary Table S7). The m^6^A peaks of the DMGs predominantly located in CDS region (n=27) and 3’UTR (n=18) (Figure 5C). The GO enrichment results showed that these DMGs were mainly enriched in 11 terms including autophagy, toll-like receptor 9 signaling pathway, Notch signaling pathway, intraciliary transport involved in cilium assembly (P < 0.05) (Figure 5D). KEGG enrichment results showed that these DMGs were significantly enriched in 7 pathways including C-type lectin receptor signaling pathway, Calcium signaling pathway, toll-like receptor signaling pathway, apoptosis, MAPK signaling pathway, and mTOR signaling pathway (P < 0.05) (Figure 5E). Interestingly, the hypo-methylated DMGs including SUSD5 and IFT74 were significantly enriched in Notch signaling pathway, but the expression at mRNA level was increased. The regulation of autophagy pathway was enriched by two hyper-methylated DMGs WDR41 and EPG5, which have higher mRNA expression. Moreover, the DMG FOS with hypo-methylated level and lower expression at mRNA level was significantly enriched in apoptosis pathway. The hypo-methylated DMG STAB2 was mainly associated with defense response to bacteria (Figures 5F, G).
Integrated analysis of MeRIP-seq and RNA-seq in the C. jejuni-susceptible (S) and resistant (R) groups. (A) The gene expression of genes with or without m6A modifications in the resistant and susceptible groups. (B) Distribution of genes with significant changes in both gene expression levels as well as m6A levels (Hyper-up: m6A levels upregulated and mRNA expression upregulated; Hyper-down: m6A levels upregulated as well as mRNA expression downregulated; Hypo-up: m6A levels downregulated as well as mRNA expression upregulated; Hypo-down: m6A levels downregulated as well as mRNA expression downregulated. (C) The distribution of differentially expressed genes containing differential m6A peaks in different genomic features. (D) The enriched GO terms of differentially expressed genes containing differential m6A peaks (E) The enriched KEGG pathway of DMGs with differential peaks. (F) The expression of differentially expressed genes containing differential m6A peaks SUSD5, WDR41, EPG5, FOS, STAB2, and IFT74 in the resistant and susceptible groups. The data are pooled from 2 independent experiments with 6 replicates per group (n = 6) and presented as the mean ± SEM; ** representing P < 0.01. (G) The distribution m6A peaks located in SUSD5, WDR41, EPG5, FOS, STAB2, and IFT74.
The regulatory role of YTHDC2 in HD11 cells responding to C. jejuni colonization
3.5
In general, the qRT-PCR results for seven randomly selected genes were highly correlated with the sequencing results (R^2^ = 0.933, P < 0.0001) (Figure 6A). Additionally, the m^6^A modification related genes, just the expression level of YTHDC2 in the S group was significantly lower than that in the R group, which is consistent with the RNA-seq results (P < 0.05) (Figure 6B). The expression level of immune related DMGs EPG5, IFT74, SUSD5, STAB2 and WDR41 in the S group were significantly lower than those in the R group, whereas the expression level of FOS in the S group was significantly higher than that in the R group (P < 0.05) (Figure 6C). Using MeRIP-qPCR, we found that the m^6^A modification level of EPG5, STAB2 and WDR41 in R group was increased, but the m^6^A modification levels of SUSD5, IFT74 and FOS in R group were decreased compared to S group (P < 0.05) (Figure 6D).
Validation of m6A peaks and mRNA levels of differentially expressed genes containing differential m6A peaks in the C. jejuni-susceptible (S) and resistant (R) groups. (A) qRT-PCR validation of gene expression in the resistant and susceptible groups. (B) The expression levels of m6A modification related genes METTL3, METTL14, YTHDC2, ALKBH5, and FTO in the resistant and susceptible groups of chicken cecum. (C) qRT-PCR results of SUSD5, WDR41, EPG5, FOS, STAB2, and IFT74 in the resistant and susceptible groups of chicken cecum. (D) meRIP-qPCR results of SUSD5, WDR41, EPG5, FOS, STAB2, and IFT74 in the resistant and susceptible groups of chicken cecum. The data are pooled from 2 independent experiments with 6 replicates per group (n = 6) and presented as the mean ± SEM; * and ** represent P < 0.05, P < 0.01, respectively.
To further evaluate the function of YTHDC2, the YHTDC2 knockdown model in chicken HD11 cell line was constructed. The apoptosis rate of HD11 in LPS group was higher than that in NC group, whereas the apoptosis rate of HD11 in si-YTHDC2 group was lower than that in NC group (P < 0.05) (Figure 7A). The qRT-PCR results of apoptosis related gene CASP3 and anti-apoptosis related gene BCL2L1 further supported the above results (P < 0.05) (Figure 7B). Additionally, YTHDC2 knockdown could increase the expression of the autophagy related genes ATG5 and ULK1, whereas LPS stimulation could decrease the expression of the ATG5 and ULK1 (P < 0.05) (Figure 7B). Moreover, YTHDC2 knockdown significantly increased the expression of DMGs: EPG5, WDR41, SUSD5, STAB2, FOS, and IFT74 (P < 0.05). Compared to NC group, the expression of EPG5 and IFT74 was increased, whereas the expression of STAB2 was decreased in the LPS group (P < 0.05) (Figure 7B). These results indicated that YTHDC2 could be involved in regulating the apoptosis and autophagy process of HD11 cells through altering the expression of DMGs including IFT74, SUSD5, STAB2, EPG5 and FOS.
The regulatory role of YTHDC2 for chicken HD11 cell line responding to C. jejuni LPS stimulation. (A) Flow cytometric analysis of apoptosis in HD11 cells after YTHDC2 knock down followed by C. jejuni LPS stimulation. (B) Effects of interference YTHDC2 on the mRNA expression of apoptosis and autophagy related genes involved in responding to C. jejuni LPS stimulation. The data are pooled from 4 independent experiments with 4 replicates per group (n = 4) and presented as the mean ± SEM; * and ** represent P < 0.05, P < 0.01, respectively.
Discussion
4
C. jejuni, as a commensal bacterium in commercial broiler chickens, seriously hampers bird welfare (49). C. jejuni colonizes the avian intestines in high numbers and rapidly spreads within flocks (50). Studies on pathogen-resistant and -susceptible chicken inbred lines have revealed that differences in innate immunity are associated with variations in intestinal β-defensin secretion (51). The mechanism in response to C. jejuni inoculation in chickens is regulated by multiple molecular levels with manifestation in transcriptional level, post-transcriptional level, and the protein level (52–54). While, the regulatory role of m^6^A modification underlying chicken responding to C. jejuni inoculation still remains unclear. Therefore, the chicken model inoculated with C. jejuni inoculation was constructed, and the landscape of m^6^A modification of chicken cecum was characterized.
m^6^A modification, the most prevalent and abundant internal post-transcriptional modification of messenger RNA in eukaryotic organisms, plays essential regulatory roles in immune responsiveness (55–58). In this study, we identified numerous m^6^A modification sites in both susceptible and resistant chickens of cecum, which were mainly located in the 3′UTR, CDS, and stop codon regions, which aligns with previously findings (59–61). m^6^A modification has been mechanistically implicated in attenuating mRNA stability and facilitating mRNA decay across diverse biological processes (62, 63). Conversely, emerging evidence suggests that m^6^A methylation density is positively correlated with transcript abundance (64–66). In our study, the expression of genes containing m^6^A peak was significantly higher than that of genes without modification, indicating the m^6^A modification could regulate chicken responding to C. jejuni colonization though modulating gene expression.
Recent researches have uncovered that m^6^A methylation machinery emerged as important regulators of host immunity through dynamics regulation of RNA metabolism and innate immune signaling pathways (67, 68). In the current study, we identified numerous differential m^6^A peaks associated with immune related pathways, such as regulation of canonical NF-kappaB signal transduction, apoptotic signaling pathway, MyD88-dependent toll-like receptor signaling pathway, mTOR signaling pathway. As the prototypical adapter of the Toll-like receptor signaling cascade, MyD88 coordinates essential innate immune defenses against microbial pathogens (69). Furthermore, SPOP-mediated ubiquitination limits canonical NF-κB signaling activity, thereby attenuating IL-1β biosynthesis in chicken macrophages following lipopolysaccharide challenge (70). B cell-specific mTOR deficiency can limit humoral immune responses through AID signaling (71). In the current study, the above immune related pathways were significantly enriched by DMPs PIDD1, ZFAND6, CAPN3, WNT6, PRKCB, WNT4, and SLC38A9. Of which, PIDD1, ZFAND6, WNT6, PRKCB, and WNT4 were hyper-regulated in the C. jejuni-resistant chickens, whereas CAPN3, and SLC38A9 were hypo-methylated in the C. jejuni-resistant chickens. These genes are involved in the immune response by inducing M1 macrophages polarization, the over-activation of innate immunity, immune infiltration, and inhibiting the proliferation of various bacteria (72–74). Dysregulation of m^6^A modification in intestinal epithelial cells could disrupt intestinal immune cell homeostasis (75). Therefore, C. jejuni inoculation may trigger the immune related signaling pathways by altering the methylation levels of candidate genes.
m^6^A modifications are widely acknowledged as being specifically recognized and bound by m^6^A reader proteins (76). YTHDC2 as the member of the YT521-B homology (YTH) family of proteins, contains the highly conserved YTH domain and multiple helicase domains that selectively recognizes m^6^A (77). Numerous studies have demonstrated that YTHDC2 as a crucial regulator was involved in sex differentiation (55), ferroptosis (78), Yersinia ruckeri infection (79), virus invasion (80). In the current study, we found the expression of YTHDC2 was increased in the C. jejuni-susceptible chickens. Further analysis identified several DMGs SUSD5, IFT74, WDR41, EPG5, FOS, and STAB2 enriched in immune related terms including Notch signaling pathway, the regulation of autophagy pathway, defense response to bacteria, and apoptosis pathway. These pathways have been validated as critical modulators of immune responses, coordinating both innate regulator functions and adaptive immune priming through transcriptional and post-translational regulation of cytokine biosynthesis and immune cell determination (81–84). Notch signaling pathway could regulate the LPS induced cellular immune and inflammatory response in chicken macrophages (85). These findings elucidate a complex regulatory mechanism of immune responses in chickens during C. jejuni inoculation. The autophagy-related gene EPG5 mediates intestinal antiviral immunity through microbiota independent mechanisms (86). IFT74 was mainly associated with intraciliary transport involved in cilium assembly (87). STAB2 as a scavenger receptor was mainly associated with defense response to Gram-negative bacterium through inducing the production of anti-inflammatory mediators (88). FOS, a member of the AP-1 transcription factor family, plays a critical role in cell proliferation, differentiation, gene regulation, and tumorigenesis (89). Therefore, we inferred that EPG5, IFT74, STAB2 and SLC38A9 could involve in regulating chicken responding to C. jejuni colonization. YTHDC2 can reduce the translation efficiency of target genes and the mRNA abundance in the meiosis of germline cells (77). Here, we found the knockdown of YTHDC2 could decrease the apoptosis rate of chicken HD11, and increase the expression of IFT74, SUSD5, STAB2, EPG5 and FOS. Taken together, YTHDC2 could regulate the apoptosis and autophagy process of HD11 cells through altering the level of m^6^A methylated modification and expression of DMGs including IFT74, SUSD5, STAB2, EPG5 and FOS in the response to C. jejuni colonization.
Conclusion
5
In the current study, we found m^6^A methylation modification could involve in the process of chicken responding to C. jejuni inoculation through regulating gene expression. YTHDC2 could involve in regulating the apoptosis and autophagy process of HD11 cells through altering the expression of DMGs including IFT74, SUSD5, STAB2, EPG5 and FOS, which was confirmed by experiments in vitro. This regulatory role of m^6^A methylation modification underlying chicken cecum responding to C. jejuni inoculation was firstly characterized. Our results would provide novel insights into understanding the molecular mechanisms underlying chicken in response to C. jejuni inoculation, and offer new insights for improving chicken disease resistance.
The reference list from the paper itself. Each links out to its DOI / PubMed record.
- 1Tegtmeyer N Sharafutdinov I Harrer A Soltan Esmaeili D Linz B Backert S. Campylobacter virulence factors and molecular host-pathogen interactions. Curr Top Microbiol Immunol. (2021) 431:169–202. doi: 10.1007/978-3-030-65481-8_7, PMID: 33620652 · doi ↗ · pubmed ↗
- 2Awad WA Hess C Hess M. Re-thinking the chicken-Campylobacter jejuni interaction: a review. Avian Pathol. (2018) 47:352–63. doi: 10.1080/03079457.2018.1475724, PMID: 29764197 · doi ↗ · pubmed ↗
- 3Lopes GV Ramires T Kleinubing NR Scheik LK Fiorentini ÂM Padilha da Silva W. Virulence factors of foodborne pathogen Campylobacterjejuni. Microb Pathog. (2021) 161:105265. doi: 10.1016/j.micpath.2021.105265, PMID: 34699927 · doi ↗ · pubmed ↗
- 4Kaakoush NO Castaño-Rodríguez N Mitchell HM Man SM. Global epidemiology of campylobacter infection. Clin Microbiol Rev. (2015) 28:687–720. doi: 10.1128/cmr.00006-15, PMID: 26062576 PMC 4462680 · doi ↗ · pubmed ↗
- 5Sheppard SK Maiden MC. The evolution of Campylobacter jejuni and Campylobacter coli. Cold Spring Harb Perspect Biol. (2015) 7:a 018119. doi: 10.1101/cshperspect.a 018119, PMID: 26101080 PMC 4526750 · doi ↗ · pubmed ↗
- 6Dessouky YE Elsayed SW Abdelsalam NA Saif NAÁlvarez-Ordóñez A Elhadidy M. Genomic insights into zoonotic transmission and antimicrobial resistance in Campylobacter jejuni from farm to fork: a one health perspective. Gut Pathog. (2022) 14:44. doi: 10.1186/s 13099-022-00517-w, PMID: 36471447 PMC 9721040 · doi ↗ · pubmed ↗
- 7Al Hakeem WG Fathima S Shanmugasundaram R Selvaraj RK. Campylobacter jejuni in poultry: pathogenesis and control strategies. Microorganisms. (2022) 10:2134. doi: 10.3390/microorganisms 10112134, PMID: 36363726 PMC 9697106 · doi ↗ · pubmed ↗
- 8Knudsen KN Bang DD Andresen LO Madsen M. Campylobacter jejuni strains of human and chicken origin are invasive in chickens after oral challenge. Avian Dis. (2006) 50:10–4. doi: 10.1637/7376-051005 r.1, PMID: 16617974 · doi ↗ · pubmed ↗