Exploratory investigation of urinary alkanes and other volatile organic compounds in paediatric patients with tuberculous meningitis
Simon Isaiah, Du Toit Loots, A. Marceline Tutu van Furth, Regan Solomons, Sabine van Elsland, Martijn van der Kuip, Shayne Mason

TL;DR
This study explores changes in urinary alkanes and volatile compounds in children with tuberculous meningitis, revealing potential metabolic markers for the disease.
Contribution
The study identifies specific alkanes and VOCs in urine that are consistently altered during TBM treatment, offering new insights into M. tb metabolism.
Findings
Four elevated alkanes and three alkenes were found in TBM patient urine.
Three VOCs, including 2-pyrrolidinone, showed significant changes during treatment.
Altered VOCs remained consistent throughout the six-month treatment period.
Abstract
Tuberculous meningitis (TBM) is a disease caused by Mycobacterium tuberculosis (M. tb) infection of the brain. Alkanes and other volatile organic compounds (VOCs) are biologically important metabolites that are used by infectious mycobacteria species for growth and survival strategies. This study investigated the altered alkanes and other VOCs in the urine from paediatric cases with TBM. We used untargeted gas chromatography coupled with time-of-flight mass spectrometry (GC-TOFMS) to analyse and compare all volatile, underivatised compounds present in the urine from 27 confirmed cases of paediatric TBM over a treatment period of six months, as well as a control group (n = 13). Four elevated alkanes (pentadecane, 5,7-dimethyl-undecane, 4,7-dimethyl-undecane, and 2,6-dimethyl-undecane), three alkenes (decreased 2,5-dimethyl-2-hexene and 4,4-dimethyl-1-pentene, and increased…
Genes, proteins, chemicals, diseases, species, mutations and cell lines named across the full text — each resolved to its canonical identifier and authoritative record.
Click any figure to enlarge with its caption.
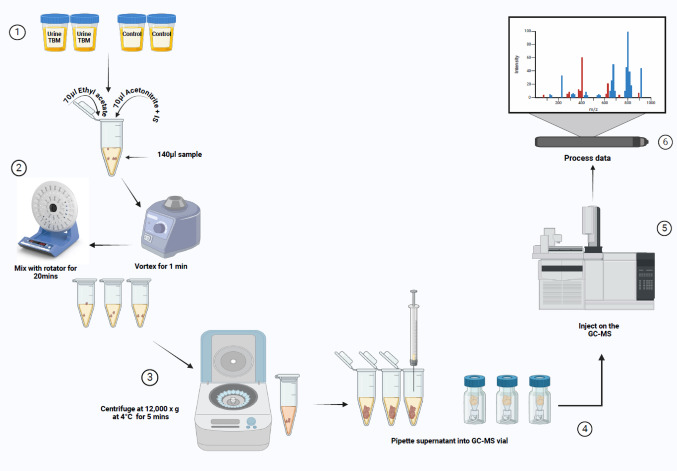 Figure 1
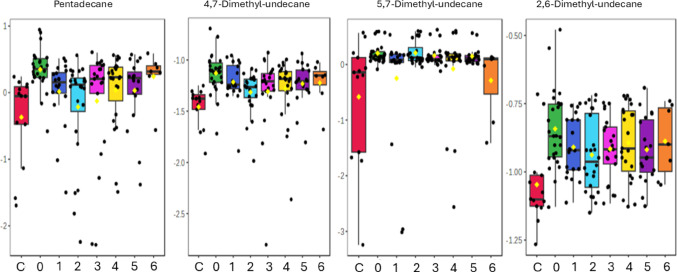 Figure 2
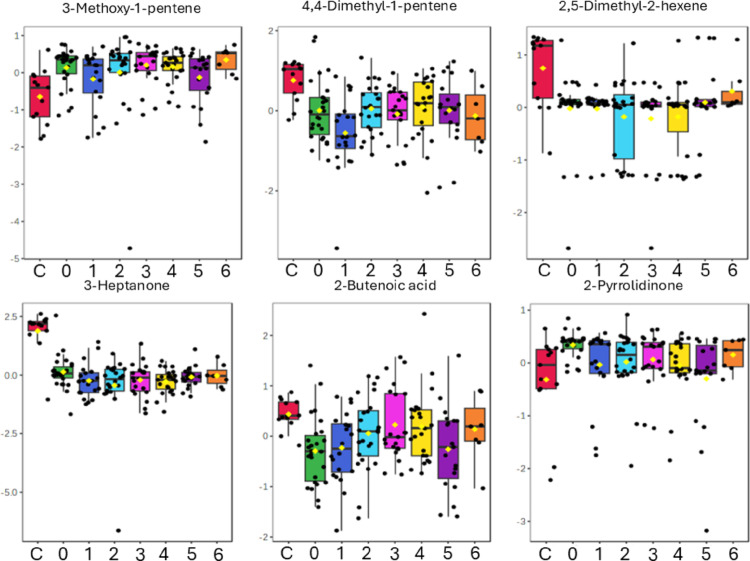 Figure 3
- —North-West University
Peer Reviews
No public reviews on file for this paper yet. If you reviewed it on a platform where reviews are public (OpenReview, ICLR, NeurIPS, ICML), you can paste yours below so the community can read it here.
Videos
No videos yet. Explain this paper in a talk, walkthrough, or lecture? Add one.
Taxonomy
TopicsTuberculosis Research and Epidemiology · Mycobacterium research and diagnosis · Pneumocystis jirovecii pneumonia detection and treatment
Introduction
Tuberculous meningitis [TBM; tuberculosis (TB) of the brain] is the most severe extrapulmonary form of TB, and if not diagnosed early, can result in a high probability of death or long-term neurological complications. Definite TBM is diagnosed based on microbiological evidence of Mycobacterium tuberculosis (M. tb) in the cerebrospinal fluid (CSF). However, the paucity of M. tb in the CSF can sometimes lead to an inconclusive differential diagnosis of TBM. Hence, there is a desperate need to discover new potential diagnostic markers to aid in quicker and more efficient diagnosis of TBM.
Alkanes are saturated hydrocarbons, meaning that they consist of a series of single-bonded carbon and hydrogen atoms. It is known from the literature that many species of bacteria use alkanes as a carbon source (Rojo, 2009; Wentzel et al., 2007). Although sparse in the literature, some studies have shown that species of Mycobacterium use alkanes as a carbon source. Dunlap and Perry showed that C13-C17 alkanes were incorporated into the fatty acid metabolism of an OFS lab strain of a Mycobacterium species (Dunlap & Perry, 1967); however, alkanes shorter than C13 or longer than C17 were not incorporated into the cellular fatty acids of mycobacteria without some form of degradation (Dunlap & Perry, 1968). Churchill et al. (1999) isolated a CH1 lab strain of a Mycobacterium species and showed that mycobacteria could use a wide range of alkanes [linear (dodecane and hexadecane); branched-chain (pristane); long-chain (octadecane, docosane, and octacosane)] as the sources of carbon and energy. Another study by Van Beilen et al. (2002) showed that various species of mycobacteria could use C6-C24 alkanes as carbon sources. To use alkanes, bacteria need the alkane hydroxylase system, which consists of three protein components: alkane hydroxylase (AlkB), rubredoxin (AlkG), and rubredoxin reductase (AlkT) (Smits et al., 2002). Stokas et al. (2022) showed that Mycobacterium tuberculosis (M. tb), the pathogen responsible for tuberculosis (TB), regulates a highly conserved alkane hydroxylase/rubredoxin system that contributes to the success of these specific mycobacteria in human macrophages. Hence, M. tb uses alkanes for growth and survival.
The breath of active cases of pulmonary TB has been investigated (Phillips et al., 2007, 2010), and it was found that the alkanes tridecane, 4-methyldodecane, and 3,7-dimethyldecane were among the volatile organic compounds (VOCs) in the breath that were diagnostic markers of TB. Additionally, urinary VOCs have been shown to have diagnostic potential by differentiating TB patients from controls (Banday et al., 2011; Lim et al., 2016). However, alkanes and VOCs have never been targeted in any TBM study nor investigated in other biofluids (urine, plasma, serum, etc.) from TBM cases. VOCs in biofluids are low-molecular-weight compounds that are easily vaporised when heated. Here, we conducted an exploratory investigation of alkanes and other VOCs in urine collected from paediatric cases undergoing treatment for confirmed TBM. For this study, we used gas chromatography coupled with time-of-flight mass spectrometry (GC-TOFMS) as the analytical approach, without derivatising the samples (derivatisation would result in loss of VOCs). Hence, the aim of this study was to evaluate the urinary profile of alkanes and other VOCs in cases of TBM.
Materials and methods
Sampling and ethics
This investigation involved retrospectively collected urine samples (van Elsland et al., 2018) from infants and children (aged < 13 years) residing in the Western Cape Province of South Africa, a geographical location known for its high prevalence of TB (681 per 100,000), especially among children (Donald et al., 1996; Mandalakas et al., 2021; van Toorn & Solomons, 2014). Children exhibiting clinical symptoms and signs indicative of meningitis, initially seen at the basic level and regional health facilities, were referred to the Department of Paediatrics and Child Health at Tygerberg Hospital in the Western Cape Province of South Africa. Following the application of the universal research case definition criteria for TBM (Marais et al., 2010), all TBM participants in our cohort (n = 27) were diagnosed with definite TBM. The diagnosis of definite TBM was based on the detection of M. tb in CSF by microscopy, culture, and/or a commercial nucleic acid amplification test. All TBM patients were stabilised in the Tygerberg Hospital Paediatric Neurology ward and treated with an intensified anti-tuberculous drug regimen comprising high-dose rifampicin, isoniazid, pyrazinamide, and ethionamide (Van Toorn et al., 2012). Urine samples were collected with the consent of the parents or guardians and the assent of the child if older than 7 years and can comprehend. All experimental samples were collected at baseline (time 0; T0 – collected upon discharge from the hospital; the median time from admission to discharge in the study setting over the past 38 years was 16 days, the interquartile range was 12–23 days) and at one-month intervals at the patient out-clinic, up to six months (T1-T6), until the completion of the TBM treatment (van Elsland et al., 2018). The control group (n = 13) consisted of anonymous paediatric patients with written and informed parental or guardian consent and the child’s assent, if older than 7 years, who were negative for meningitis, without neurological symptoms, and from the same geographic region as the TBM patients; classified as ‘normal and healthy cases’. Ethical approval was granted by the Stellenbosch University Health Research Ethics Committee (HREC) (ethics approval number: N16/11/142), the Western Cape Department of Health and Wellness, and the HREC of North-West University, Potchefstroom campus (ethics approval number: NWU-00063-18-A1-01). The presence of HIV co-infection further complicates an already intricate metabolic profile; hence, individuals with positive or unknown HIV status were excluded from this study.
Sample handling, storage, and transportation
The Division of Molecular Biology and Human Genetics at Stellenbosch University stored the urine samples in a dedicated freezer at -80 °C. Subsequently, all urine samples designated for metabolomics analysis were sent overnight by courier, frozen and on dry ice, to the Human Metabolomics BSL-3 Laboratory at the North-West University, Potchefstroom campus, where they were aliquoted and stored at -80 °C. A volume of 50 µL was collected from each urine sample and combined into a single tube to form a pooled quality control (QC) urine sample. See Fig. 1 for study design.Fig. 1. Schematic study design depicting the metabolomics experimental workflow
Sample preparation and GC-TOFMS analysis
Before analysis, the samples were defrosted to room temperature in a biological safety cabinet. A 140 µL volume of extraction solvent, containing 70 µL ethyl acetate and 70 µL acetonitrile with an internal standard (IS; 50 ppm concentration of 2E-pentenoic acid), was mixed with 140 µL urine in a ratio of 1:1:2. The material was thoroughly mixed by vortex for 1 min and allowed for proper mixing in a rotator for a further 20 min. Centrifugation at 12,000 x g at 4 °C was performed for 5 min on the 280µL of mixture to facilitate phase separation and sediment any particles and macromolecules. After centrifugation, 120 µL of the top organic phase was transferred to a glass GC vial and sealed. Samples were analysed in a random order, with QC samples inserted at regular intervals, on a GC-TOFMS (Leco Pegasus BT with Agilent 7890 GC).
Prior to analysis, a new liner and septum were installed into the GC-TOFMS to prevent undesired reactions and surface adsorption occurrences. Furthermore, routine maintenance procedures were conducted prior to analysis, encompassing leak detection, tuning, and mass calibration. The samples were analysed in 12 batches, following a randomised approach. A 1 µL volume was injected into the GC-TOFMS using a 1:10 split ratio, with purified helium as a carrier gas, maintained at a constant flow of 1 mL/min. Chromatographic separation was carried out using a Restek Rxi-5MS capillary column (30 m length; 250 μm diameter; 0.25 μm film thickness). Throughout the complete chromatographic procedure, the initial inlet temperature was maintained at 270 °C, the transfer line at 250 °C, and the ion source was set at 200 °C. The initial GC oven protocol began at 50 °C and sustained for 2 min. Subsequently, the temperature was increased in the following manner: 20 °C/min to 120 °C, 16 °C/min to 180 °C, 12 °C/min to 250 °C, and ultimately 8 °C/min to 300 °C, maintained for 1 min. The total duration of each sample analysis was approximately 23 min. Prior to the acquisition of MS data, a 180 s solvent delay was implemented, during which no mass spectra were recorded. Mass spectra were collected across a spectrum of 50–800 m/z at a rate of 20 spectra per second.
Data pre-processing
Prior to the execution of statistical data analyses, a standardised procedure for the pre-processing of GC-TOFMS metabolomics data was applied. All compounds underwent normalisation utilising the mass spectral total useful signal (MSTUS) by computing the total useful signal for each sample (Chetwynd et al., 2016). Subsequently, variables that exhibited no variation between the groups were excluded, and a data filtering process was executed on each variable to remove those that exhibited more than 50% zero values within each group (Smuts et al., 2013). A quantitative mass merge was then carried out. Thereafter, the coefficient of variation (CV) was evaluated across all quality control (QC) samples, with any variable with a CV > 70% being discarded. All variables with a match of at least 70% with the NIST MS library were labelled as metabolites, and their identities were checked manually afterwards.
Statistical analysis
All statistical analyses were done using MetaboAnalyst 6.0 (Pang et al., 2024) and Microsoft Excel. Univariate statistical analysis was done when comparing two groups and a one-way ANOVA was done when comparing more than two groups. A Wilcoxon rank-sum test, with multiple testing, was calculated to determine statistical significance (FDR p-value < 0.05). Since our sample size was small, a Hedge’s effect size (instead of a Cohen’s effect size) was calculated to determine practical significance. A small effect (low practical significance) has a g ≤ 0.2, a medium effect (moderate practical significance) has a 0.2 < g ≤ 0.8, and a large effect (high practical significance) has a g > 0.8. All data were log-transformed to allow for visual comparisons between groups (box plots).
Results
Using an untargeted metabolomics approach, univariate statistical results identified 13 urinary metabolites to be statistically significantly different (FDR p-value < 0.05) when comparing the urine collected from paediatric TBM patients at baseline (T0) and the control group. Six of these 13 compounds had a medium effect size (0.2 < g ≤ 0.8), and seven compounds had a large effect size (g > 0.8). The quantitative univariate statistical measures of these 13 statistically significant compounds are given in Table 1 (see relative abundance of all metabolites in supplementary data). Of these 13 metabolites, three are alkanes and six are VOCs, and the remainder of the results describe these 10 metabolites.
Table 1. Statistically significant (FDR p-value < 0.05) compounds in the baseline paediatric TBM patients when compared to the control groupCompoundFDR p-valueHedge’s effect size (g-value)3-Methoxy-1-pentene0.0141.524,7-Dimethyl-undecane0.0421.39Pentadecane0.0031.303-Heptanone< 0.0011.272-Pyrrolidinone0.0181.142,6-Dimethyl-undecane0.0421.07Dodecane0.0421.055,7-Dimethyl-undecane0.0210.62Dichloro-acetic acid, ethyl ester0.0210.562,5-dimethyl-2-hexene0.0420.462-Ethyl-trans-2-butenal0.0490.444,4-Dimethyl-1-pentene0.0420.412-Butenoic acid, methyl ester0.0180.36Hedge’s effect sizes are also given as g-values, with a medium effect size identified as 0.2 < g ≤ 0.8, and a large effect size identified as g > 0.8
Alkanes
Pentadecane (a 15-carbon alkane) and three 11-carbon alkanes with two attached methyl groups (5,7-dimethyl-undecane, 4,7-dimethyl-undecane, and 2,6-dimethyl-undecane) were found to be statistically significantly different in the paediatric TBM urine at T0 when compared to the controls. Pentadecane remained significantly increased (FDR p < 0.05) throughout the entire treatment duration (6 months of TBM treatment), except at T2 (2 months of TBM treatment) (FDR p = 0.083). The Hedge’s effect size g-value of pentadecane remained > 0.8 (large effect) for all TBM treatment points, except at T2, (g = 0.61; medium effect).
4,7-Dimethyl-undecane showed a similar trend to pentadecane– large effect size (g > 0.8) at all TBM treatment points and statistical significance at T3 and T5 when compared to the controls. All four alkanes remained increased and did not return to approximate control levels during TBM treatment. These results suggest that the TBM treatment was insufficient to lower these M. tb-related alkanes to control levels.
The other two remaining alkanes (5,7-dimethyl-undecane and 2,6-dimethyl-undecane) also differed statistically significantly in the TBM group at T0 when compared to the controls. However, no statistically significant differences occurred during the TBM treatment; although, they continued to show practical significant differences (medium effect size [0.2 < g ≤ 0.8]) for T1-T6 when compared to the controls. See Fig. 2 for box plots and Table 2 for univariate measures of pentadecane, 5,7-dimethyl-undecane, 4,7-dimethyl-undecane, and 2,6-dimethyl-undecane over the TBM treatment points.
Fig. 2. Box plots of the four urinary alkanes identified as showing significant changes across the longitudinal TBM data set. The groups are shown as controls (C; red), baseline TBM (0; green), one month of TB treatment (1; blue), two months of TB treatment (2; light blue), three months of TB treatment (3; pink), four months of TB treatment (4; yellow), five months of TB treatment (5; purple), and six months of TB treatment (6; orange). All data are log-transformed
Table 2. Four urinary alkanes over TBM treatment points compared to controlsAlkaneUnivariate measureControl vs. TBM treatment pointsC vs. 1C vs. 2C vs. 3C vs. 4C vs. 5C vs. 6PentadecaneFDR p-value0.010.0830.0120.0090.0070.011g-value1.070.621.041.051.141.484,7-Dimethyl-undecaneFDR p-value0.1610.0830.0380.1220.0310.141g-value1.360.921.011.091.281.575,7-Dimethyl-undecaneFDR p-value0.3060.0830.2320.1130.2990.403g-value0.370.630.430.570.380.402,6-Dimethyl-undecaneFDR p-value0.2140.390.1490.1210.6140.562g-value0.870.630.810.940.770.95Statistical significance indicated by FDR p-value < 0.05. Hedge’s effect sizes indicate a medium effect size at 0.2 < g ≤ 0.8 and a large effect size at g > 0.8. The groups are shown as controls (C), one month of TB treatment (1), two months of TB treatment (2), three months of TB treatment (3), four months of TB treatment (4), five months of TB treatment (5), and six months of TB treatment (6)
Other volatile organic compounds (VOCs)
Three alkenes (3-methoxy-1-pentene; 4,4-dimethyl-1-pentene; 2,5-dimethyl-2-hexene) and an aliphatic ketone (3-heptanone) were also found to be statistically significant. 2,5-Dimethyl-2-hexene and 4,4-dimethyl-1-pentene showed a statistically significant decrease in the TBM baseline samples compared to the controls and remained significantly decreased through the six-month TBM treatment period, with 4,4-dimethyl-1-pentene showing a large effect size (g > 0.8) and 2,5-dimethyl-2-hexene showing a medium effect size (0.2 < g ≤ 0.8). Methoxy-1-pentene was significantly increased at T0, T2-T4, and T6, but decreased (returning close to control levels) at T1 and T5 of TBM treatment. 3-Heptanone remained significantly decreased in the TBM cases throughout treatment, with a large effect size (high practical significance).
2-Butenoic acid methyl ester was significantly decreased and 2-pyrrolidinone was significantly increased at baseline TBM, and 2-butenoic acid methyl ester remained statistically significant at T1. However, for all other time points, these two compounds were not statistically significant but retained a medium effect size. Hence, 2-butenoic acid methyl ester and 2-pyrrolidinone are likely compounds that can be linked to the disease (TBM) because they were statistically significant at TBM baseline and as the disease (but not necessarily the M. tb infection) resolved, these compounds also resolved. In particular, 2-pyrrolidinone returned to control levels by T1 of TBM treatment. See Fig. 3 for box plots and Table 3 for the quantitative measures of these six VOCs over the TBM treatment period.
Dichloro-acetic acid, ethyl ester and 2-ethyl-trans-2-butenal are also VOCs (see supplementary data) but no link to biological function could be found in the literature and were thus not considered further in this study.
Fig. 3. Box plots of six urinary compounds identified as showing significant changes across the longitudinal TBM data set. The groups are shown as controls (C; red), baseline TBM (0; green), one month of TB treatment (1; blue), two months of TB treatment (2; light blue), three months of TB treatment (3; pink), four months of TB treatment (4; yellow), five months of TB treatment (5; purple), and six months of TB treatment (6; orange). All data are log-transformed
Table 3. Quantitative measures for the other statistically significant VOCs over TBM treatment points compared to controlsAlkaneUnivariate measureControl vs. TBM treatment pointsC vs. 1C vs. 2C vs. 3C vs. 4C vs. 5C vs. 63-Methoxy-1-penteneFDR p-value0.0580.0060.0010.0020.0640.007g-value0.71.141.591.420.951.644,4-Dimethyl-penteneFDR p-value< 0,0010.002< 0,0010.0020.020.032g-value2.171.512.041.461.291.472,5-Dimethyl-hexeneFDR p-value< 0,001< 0,001< 0,001< 0,0010.0280.106g-value0.320.590.350.390.270.323-HeptanoneFDR p-value< 0,001< 0,001< 0,001< 0,001< 0,0010.007g-value2.022.142.052.111.981.542-Butenoic acidFDR p-value0.0090.630.540.5810.6040.566g-value0.040.140.220.210.220.272-PyrrolidinoneFDR p-value0.2410.2820.2040.5810.9350.311g-value0.680.490.710.30.380.49Statistical significance indicated by FDR p-value < 0.05. Hedge’s effect sizes indicate a medium effect size at 0.2 < g ≤ 0.8 and a large effect size at g > 0.8. The groups are shown as controls (C), one month of TB treatment (1), two months of TB treatment (2), three months of TB treatment (3), four months of TB treatment (4), five months of TB treatment (5), and six months of TB treatment (6)
Discussion
In this untargeted GC-TOFMS metabolomics approach, we identified four alkanes and six other VOCs with biological function in the urine of TBM cases at baseline (T0) as being as statistically significant (FDR p-value < 0.05) and/or have medium effect size (0.2 < g ≤ 0.8) or large effect size (g > 0.8). The Hedge’s effect size used in this study provides valuable insights into the practical significance of the variables, going beyond just statistical significance. For more on the value of effect sizes in research, the reader is directed towards Hedges (2008). This discussion will cover the biological significance of these four alkanes and six other VOCs, with a focus on 2-pyrrolidinone, 2-butenoic acid and 3-heptanone.
Alkanes
Several species of mycobacteria produce distinctive patterns of VOCs that act as chemical ‘fingerprints’ (Phillips et al., 2007) of the organism and the associated diseases they cause. Alkanes and methylalkanes have been progressively employed by physicians as an innovative approach to the diagnosis of various pathological conditions, circumventing the discomforts associated with invasive methodologies (Cheepsattayakorn & Cheepsattayakorn, 2014). To facilitate the uptake of alkanes, bacteria secrete glycolipid surfactants (Ron & Rosenberg, 2002). The process starts with the oxidation of the terminal methyl group by alkane hydroxylases, leading to the formation of a primary alcohol, which is subsequently oxidised to an aldehyde and finally converted to fatty acids for energy or cell wall biosynthesis (Rojo, 2009). Understanding the adaptation and replication of M. tb in the intracellular environment of the host will aid in our understanding of the pathogenesis of TBM. A study by Loots (2014), in an isoniazid-resistant M. tb strain, characterised the TetR transcriptional regulator Rv3249c, which regulates a conserved alkane hydroxylase. Rv3249c represses the operon for AlkB, a predicted alkane hydroxylase that enables the utilization of medium- and long-chain (C5-C16) alkanes as carbon sources. It also shows similarity to membrane-bound fatty acid desaturases. Fatty acid desaturation entails the enzymatic removal of hydrogen from a methylene group within an acyl chain (Shanklin & Cahoon, 1998). The findings by Schnappinger et al. (2003) indicate that M. tb experiences heightened oxidative stress in the intra-phagosomal environment, leading to increased reliance on fatty acid oxidation for carbon and energy. Loots (2014) also noted that isoniazid-resistant strains with katG mutations likely face greater oxidative stress, prompting enhanced alkane uptake for fatty acid synthesis and energy utilisation. Additionally, alkanes and their derivatives have been detected in human breath as VOCs resulting from oxidative stress (Kneepkens et al., 1994; Phillips et al., 2000). Patients with TBM are known to exhibit increased oxidative stress (Davis et al., 2019). In this current study, we also identified urinary alkenes (2,5-dimethyl-2-hexene; 4,4-dimethyl-1-pentene; 3-methoxy-1-pentene) associated with M. tb. Other studies have also reported the presence alkene derivatives in patients with TB (Kolk et al., 2012; Makhubela et al., 2023). Research endeavours should continue to explore the role of VOCs in the diagnosis of TBM. For instance, Phillips et al. (2007) identified a spectrum of VOCs correlated with TB, and 3-heptanone, one of the markers identified in this investigation, has previously been reported as a significant biomarker for breath analysis in the context of TB. Unfortunately, we cannot comment on the possible persistent presence of M. tb because the samples used in this study were collected from a retrospective study, and follow-up metadata (e.g. M. tb presence/load) at various treatment points and treatment outcomes were not collected (van Elsland et al., 2018).
2-Pyrrolidinone
2-Pyrrolidinone is a lactam cyclisation product of the neurotransmitter gamma-aminobutyric acid (GABA) (Hyder et al., 1999). A study (Petroff et al., 1999) also found that antiepileptic drugs increase GABA and its related metabolites homocarnosine and 2-pyrrolidinone. Moreover, 2-pyrrolidinone is seen to induce long-lasting facilitation of hippocampal synaptic transmission by enhancing nicotinic acetylcholine (ACh) receptors in brain responses via a protein kinase C pathway (Miyamoto et al., 2003). AChs contribute to the control of the resting membrane potential, modulation of synaptic transmission, and mediation of fast excitatory transmission (Hogg et al., 2003; Miyamoto et al., 2003). GABA serves as the primary inhibitory neurotransmitter in the human nervous system, and the metabolism of GABA to succinic semialdehyde helps regulate its levels and neurotransmitter activity (Kennedy et al., 2019). The accumulation of GABA, either by the enzymatic inactivity of 4-aminobutyrate aminotransferase (ABAT) or by medical intervention, can result in elevated levels of 2-pyrrolidinone, due to GABA cyclisation (Callery et al., 1978). 2-Pyrrolidinone can also be converted to succinimide through a two-step reaction, and the opening of the hydrolytic ring of cyclic imides such as succinimide can occur through enzymatic and non-enzymatic routes (Kurono et al., 2008; Lerner et al., 2013; Maguire & Dudley, 1978). Inhibition of ABAT activity results in the accumulation of GABA, β-alanine, homocarnosine, and 2-pyrrolidinone (Jaeken et al., 1990; Parviz et al., 2014). Increased levels of GABA lead to symptoms including hypotonia, hyperreflexia, lethargy, refractory seizures, abnormal brain magnetic resonance imaging, and electroencephalogram abnormalities (Dracopoulos et al., 2010; Hussain et al., 2017; Pearl et al., 2009; Schonstedt et al., 2015). Kennedy et al. (2019) compared four patients with GABA-transaminase deficiency, using an untargeted metabolomics approach that compared the biochemical profile in different matrices (plasma, urine, and CSF) for clinical screening of 2-pyrrolidinone and succinimide. Three patients showed elevated levels of 2-pyrrolidinone, succinimide, or its open-ring form (succinamic acid) in plasma, urine, and CSF, and/or homocarnosine in urine and CSF. To elucidate these mechanisms, Kennedy et al. (2019) further indicated that the identification of medications alongside the levels of 2-pyrrolidinone gave insight into the mechanism of the elevation of 2-pyrolidinone as a clinical biomarker. Hence, 2-pyrrolidinone has several links to neurological functions, indicating impairment (shunting) of GABA metabolism in TBM.
2-Butenoic acid
2-Butenoic acid is a straight, aliphatic, unsaturated carboxylic acid with a strong apolar nature. 2-Butenoic acid is produced by the oxidation of 2-butanoic acid, coupled with the reduction of NAD^+^ to NADH:
\documentclass[12pt]{minimal} \usepackage{amsmath} \usepackage{wasysym} \usepackage{amsfonts} \usepackage{amssymb} \usepackage{amsbsy} \usepackage{mathrsfs} \usepackage{upgreek} \setlength{\oddsidemargin}{-69pt} \begin{document}$${\text{Butanoic acid }} + {\text{ NAD}}^{ + } < => {\text{ 2}} - {\text{Butenoate }} + {\text{ NADH }} + {\text{ H}}^{ + }$$\end{document}2-Butenoic acid and its derivatives permeate cell membranes through passive diffusion and active transport mechanisms utilising sodium-coupled monocarboxylate transporter-1 or monocarboxylate transporter-1, subsequently undergoing conversion to 2-butenoic acid-CoA, which serves as a principal substrate for the crotonylation of histone lysine residues. However, the comprehensive biological pathways that govern the metabolism of 2-butenoic acid are not yet adequately elucidated (Yang et al., 2023). A segment of the scholarly community posits that 2-butenoic acid, analogous to butyric acid, may function as a metabolic byproduct or an intermediary generated by specific microbial activity in the body; however, empirical substantiation for this hypothesis is currently absent (Fischer et al., 2010). 2-Butenoic acid-CoA, an intermediate metabolite synthesised from fatty acid catabolism, is derived from 2-butenoic acid through the enzymatic action of acyl-CoA synthetase short-chain family (ACSS2) or the oxidative breakdown of amino acids such as lysine, tryptophan, and butyrate (Fang et al., 2021). It has been demonstrated to play a crucial role in a variety of neurological disorders, including neuropathic pain, Alzheimer’s disease, neonatal hypoxic-ischemic encephalopathy, and various neurodevelopmental diseases (Yang et al., 2023). 2-Butenoic acid was also identified as a marker of the presence of poly-β-hydroxybutyrate (PHB), microbial origin (Watt et al., 1991). In the context of aerobic facultative physiology, bacteria exhibit a propensity to amass PHB as a reservoir for carbon and energy. During microbial proliferation and energy production, the tricarboxylic acid (TCA) cycle and the PHB metabolic pathway engage in competition for the substrate acetyl-CoA (Korotkova & Lidstrom, 2001). A study in search of drug targets for M. tb (Purohit et al., 2007) showed a truncated citric acid cycle with the glyoxylate shunt, suggesting an option for survival by the pathogen and pathogenesis. Purohit et al. (2007) proposed that precursors to support this pathway could also be generated via enzymatic conversion involving PHB. They supported this claim by using available genome sequence data, which were analysed for possible enzymatic conversions that can generate glyoxylate, acetyl-CoA, and other enolases that can also be useful for various fatty acid transformations. Therefore, 2-butenoic acid is another M. tb-related metabolite that needs further investigation.
3-Heptanone
3-Heptanone is an aliphatic ketone. The principal metabolite of 3-heptanone has been identified as 2,5-heptanedione, which serves as a neurotoxic analogue of 2,5-hexanedione (O’Donoghue et al., 1984). Notably, 2,5-hexanedione is recognised as the most neurotoxic metabolite arising from the metabolism of n-hexane and methyl n-butyl ketone (MnBK), a neurotoxin that was reported in the literature (Mendell et al., 1974; Spencer et al., 1975). The increased metabolic conversion of 3-heptanone to 2,5-heptanedione may lead to neurotoxic effects (O’Donoghue et al., 1984). 3-Heptanone is also a metabolite of valproic acid (VPA) or 2-propylpentanoic acid, which is classified as branched-chain fatty acid. VPA can exert its effects by inhibiting voltage-gated sodium channels, thereby enhancing the inhibitory actions of GABA (Erhart et al., 2009). The metabolic pathway of VPA includes the conversion to unsaturated compounds via hydrogenation, the generation of hydroxylated metabolites through oxidation, and the formation of carbonyl metabolites through further oxidation. The β-oxidation of VPA produces 3-oxo-VPA, which subsequently undergoes spontaneous decarboxylation to produce 3-heptanone (Erhart et al., 2009; Feriduni et al., 2019). The fact that this particular VOC remained significantly increased (with a very large effect size– high practical significance) in the TBM cases, despite 6 months of TBM treatment, suggests that this VOC is linked to a possible persistent perturbation caused by the M. tb infection. Future M. tb studies should target this VOC and evaluate its significance.
Conclusions
To the best of our knowledge, this is the first GC-TOFMS analysis of urinary alkanes and other VOCs in individuals with TBM. This study identified eight compounds possibly related to M. tb metabolism: four alkanes (pentadecane, 5,7-dimethyl-undecane, 4,7-dimethyl-undecane, and 2,6-dimethyl-undecane), three alkenes (2,5-dimethyl-2-hexene, 4,4-dimethyl-1-pentene, and 3-methoxy-1-pentene), an aliphatic ketone (3-heptanone), and two additional biological compounds (2-butenoic acid methyl ester and 2-pyrrolidinone). Furthermore, an alternative hypothesis for the persistent perturbation of these urinary VOCs is that they originate from damaged neurons, specifically the myelin sheaths of neurons that contain alkanes, which the M. tb bacteria have destroyed (Bourre et al., 1977; Broza et al., 2017; Toshniwal & Zarling, 1992). This suggests that neuronal damage persists throughout TBM treatment and may be permanent.
The limitations of this study include: limited metadata on TBM and control cases, only one sample point for the controls, and the absence of additional groups (e.g., TB or bacterial meningitis) for comparison to ascertain the specificity of these VOCs to TBM. However, this study shows that alkanes and other VOCs in urine are an important consideration in M. tb-related diseases and should be further investigated with larger cohorts of M. tb-infected individuals and across various biofluids. Therefore, this study improves our understanding of M. tb infection but also takes us one step closer towards using urine as a potential non-invasive diagnostic measure for TBM.
Electronic supplementary material
Below is the link to the electronic supplementary material.
Supplementary Material 1
The reference list from the paper itself. Each links out to its DOI / PubMed record.
- 1Fang, Y., Xu, X., Ding, J., Yang, L., Doan, M. T., Karmaus, P. W., Snyder, N. W., Zhao, Y., Li, J. L., & Li, X. (2021). Histone crotonylation promotes mesoendodermal commitment of human embryonicstem cells. Cell Stem Cell, 28(4), 748–763.10.1016/j.stem.2020.12.009PMC 802671933450185 · doi ↗ · pubmed ↗