Overexpression of m7G writers METTL1 and BUD23 confers oncogenicity in kidney renal clear cell carcinoma
Anni Su, Jessica Tieng, Xueying S Xu, Richard P Tan, Yuchen Feng, Justin J‐L Wong

TL;DR
This study shows that overexpression of METTL1 and BUD23, which are m7G writers, promotes kidney cancer growth and is linked to worse survival.
Contribution
The study identifies METTL1 and BUD23 as oncogenic m7G writers in kidney renal clear cell carcinoma.
Findings
METTL1 and BUD23 are overexpressed in advanced kidney cancer and linked to poor survival.
Knockdown of METTL1 or BUD23 reduces cancer cell proliferation and migration.
METTL1-mediated m7G methylation affects tumor suppressor genes in kidney cancer.
Abstract
Emerging evidence shows that N7‐methylguanosine (m7G) modification and its writers contribute to the development of diverse cancers. However, the role of m7G writers in kidney renal clear cell carcinoma (KIRC) remains unclear. In this study we show that the catalytic components of m7G writers, METTL1 and BUD23, are overexpressed in advanced KIRC and are associated with worse overall survival. Knockdown of METTL1 or BUD23 inhibited cell proliferation, colony formation, and migration in KIRC cell lines, indicating their oncogenic role in KIRC. Furthermore, we observed that METTL1 and BUD23 expression was negatively correlated with the expression of key tumor suppressor genes commonly dysregulated in KIRC. We observed METTL1‐mediated m7G methylation in mRNAs expressed by these tumor suppressor genes, indicating that METTL1 may regulate these genes via m7G modification. Overall, our study…
Genes, proteins, chemicals, diseases, species, mutations and cell lines named across the full text — each resolved to its canonical identifier and authoritative record.
Click any figure to enlarge with its caption.
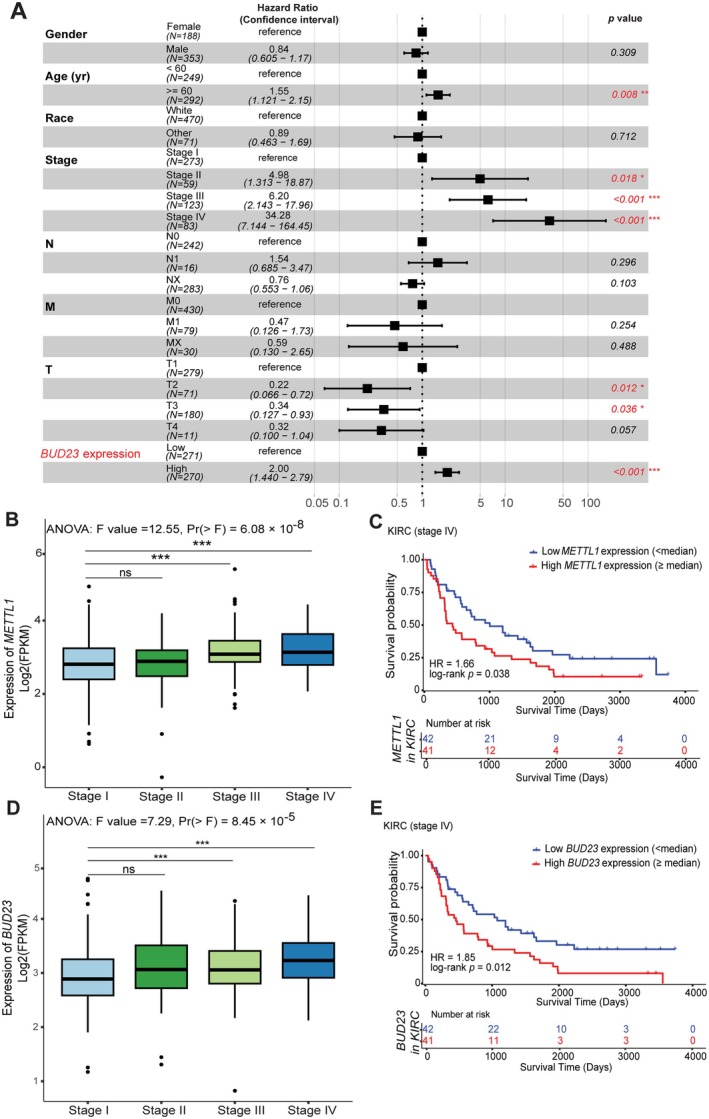 Figure 1
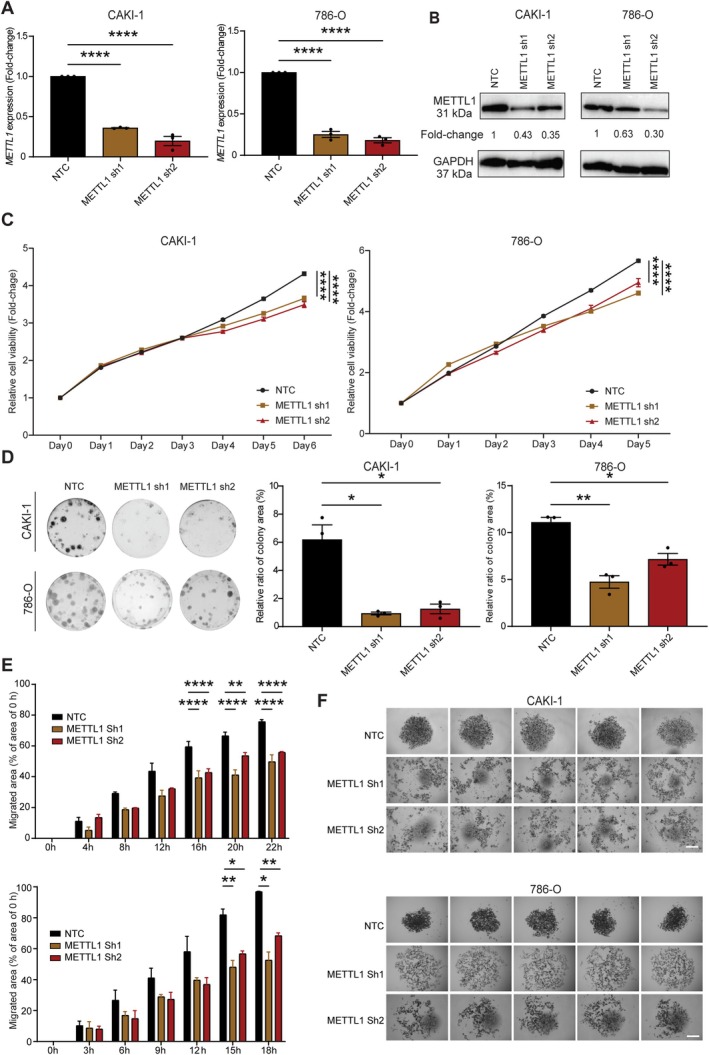 Figure 2
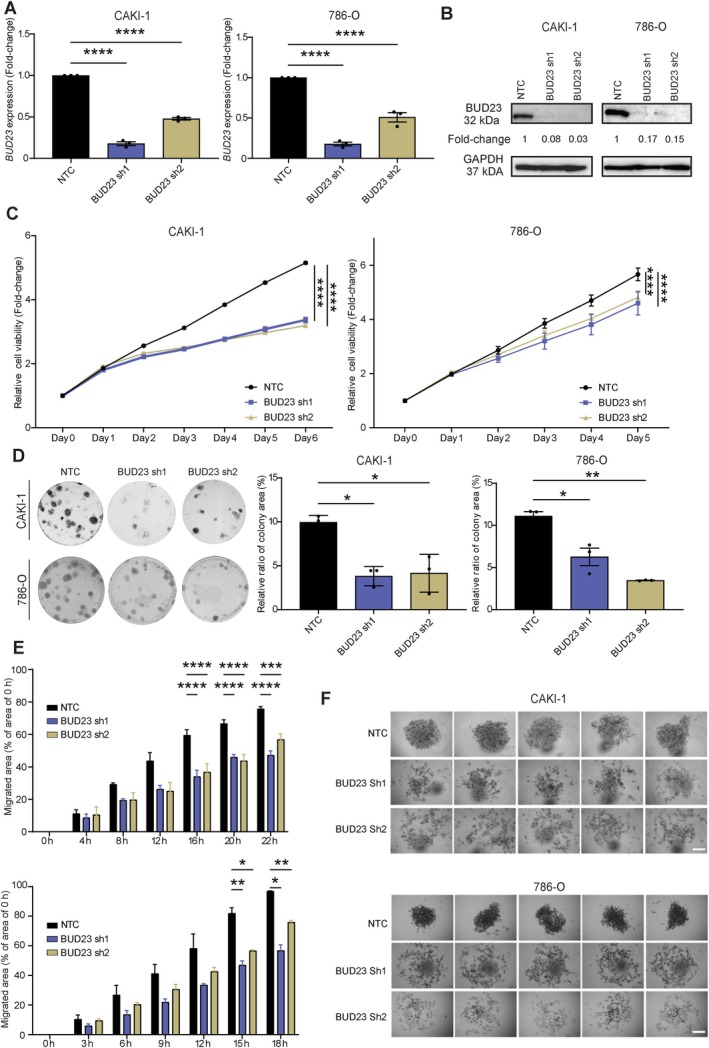 Figure 3
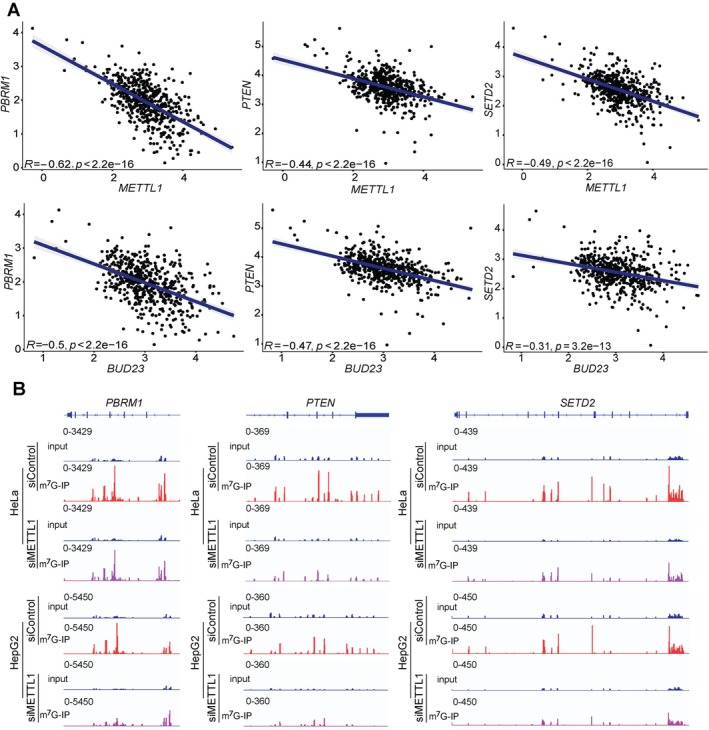 Figure 4
- —NSW Health10.13039/501100009287
- —National Health and Medical Research Council10.13039/501100000925
Peer Reviews
No public reviews on file for this paper yet. If you reviewed it on a platform where reviews are public (OpenReview, ICLR, NeurIPS, ICML), you can paste yours below so the community can read it here.
Videos
No videos yet. Explain this paper in a talk, walkthrough, or lecture? Add one.
Taxonomy
TopicsRNA modifications and cancer · Epigenetics and DNA Methylation · Cancer-related gene regulation
Introduction
Kidney renal clear cell carcinoma (KIRC) is the dominant subtype that constitutes up to 80% of all kidney cancers [1]. Current treatments for advanced KIRC, including combination therapy with tyrosine kinase inhibitors (TKIs), targeting the VEGF signaling and immune checkpoint inhibitors (ICIs), have shown efficacy but are limited by drug toxicities and high recurrence rates [1, 2, 3]. Identifying new therapeutic targets is essential to improve outcomes in advanced KIRC.
N7‐methylguanosine (m^7^G) is one of the most prevalent RNA modifications in eukaryotes. It is essential for gene expression control by regulating RNA processing, stabilization, maturation, and translation [4, 5, 6, 7, 8, 9]. In humans, internal m^7^G methylation in messenger RNA (mRNA), transfer RNA, and microRNA are methylated by the methyltransferase 1, tRNA methylguanosine (METTL1)/tRNA N7‐guanosine methyltransferase noncatalytic subunit (WDR4) complex, where METTL1 and WDR4 serve as the catalytic and the regulatory subunit respectively [4, 6]. Another m^7^G methyltransferase complex, BUD23 rRNA methyltransferase and ribosome maturation factor (BUD23), formerly known as WBSCR22/tRNA methyltransferase activator subunit 11–2 (TRMT112) methyltransferase, deposits m^7^G at G1639 in 18S rRNA, with BUD23 functioning as a catalytic subunit and TRMT112 maintaining its metabolic stability [8]. Recent studies have highlighted the pathological role of overexpressed METTL1 and BUD23 in the progression in several cancer types including brain cancer, liver, and prostate cancers [10, 11, 12, 13]. However, their roles in KIRC remain to be determined.
Analysis of data from The Cancer Genome Atlas Research Network (TCGA) suggests that dysregulation of m^7^G writers is associated with overall survival (OS) in KIRC [14]. Whether aberrant expression of m^7^G writers drives KIRC growth and metastatic potential has not been experimentally validated. Here, we further demonstrate that overexpression of METTL1 and BUD23 is associated with worse OS in late‐stage KIRC patients. Knockdown of METTL1 and BUD23 in KIRC cell lines significantly impairs cancer cell growth, colony‐forming capacity, and migration in vitro, indicating that overexpression of these genes encoding m^7^G writers confers oncogenic potential in KIRC. 3D culture models demonstrate the impairment of tumor mass formation following METTL1 and BUD23 knockdown. Furthermore, our bioinformatic analysis provides insights into the association between METTL1 and aberrant expression of tumor suppressor genes (TSGs) that may be regulated via m^7^G in KIRC.
Materials and methods
Computational analysis
The RNA‐seq dataset for KIRC primary tumors (n = 541) and associated clinical information were obtained from TCGA (https://portal.gdc.cancer.gov/) via the R package ‘TCGAbiolinks’ [15]. Gene expression analysis was stratified by the clinical stage in KIRC, and statistical significance was determined using analysis of variance (ANOVA) (p < 0.05).
OS analysis was performed by comparing KIRC tumors with expression of METTL1 and BUD23 above (high) and below (low) the median levels. The log‐rank test and Kaplan–Meier curves were generated using ‘survival’ (https://CRAN.R-project.org/package=survival) and ‘survminer’ (https://rpkgs.datanovia.com/survminer/index.html) R packages. Univariate and multivariate Cox proportional hazards regression models were employed, with p value <0.05 considered statistically significant.
The correlation of expression levels between METTL1, BUD23, PBRM1, PTEN, and SETD2 in KIRC tumors was determined using the Pearson correlation coefficient.
m^7^G methylated RNA immunoprecipitation sequencing (m^7^G‐MeRIP‐seq) data were obtained from GSE112276 [9]. Details on m^7^G‐MeRIP‐seq analysis are described in the Supplementary materials and methods.
Cell culture
CAKI‐1 cells and 786‐O cells were cultured in RPMI 1640 Medium supplemented with HEPES (ThermoFisher, Waltham, MA, USA),10% FBS (Bovogen, East Keilor, Victoria, Australia), 1 mm sodium pyruvate (ThermoFisher), and 1% penicillin/streptomycin (ThermoFisher).
Details on knockdown vector cloning, lentivirus production, and transduction are described in the Supplementary materials and methods. shRNA sequences are listed in supplementary material, Table S1. Transduced cells expressing the knockdown vector containing the puromycin resistance gene were selected in media with puromycin (ThermoFisher) (2 μg/ml for 786‐O and 1 μg/ml for CAKI‐1) for at least 7 days. After puromycin selection, the CCK8, colony formation, wound healing, and 3D tumor mass formation assays were performed (see Supplementary materials and methods).
Reverse‐transcription quantitative PCR (RT‐qPCR)
Total RNA was extracted from CAKI‐1 and 786‐O cells using the TRIzol™ Reagent (Invitrogen, La Jolla, CA, USA). The cDNA was synthesized with iScript™ gDNA Clear cDNA Synthesis Kit (Bio‐Rad, Hercules, CA, USA). RT‐qPCR was performed using SensiFAST SYBR No‐ROX kit (Bioline, Memphis, TN, USA) with cycling conditions of 95 °C (3 min), 95 °C (10 s), 60 °C (30 s), and 72 °C (20 s) for 40 cycles. Primer sequences are detailed in the supplementary material, Table S2.
Western blotting
For western blotting, proteins lysates were prepared with RIPA buffer (20 mm Tris–HCL, 150 mm NaCl, 1 mm EDTA, 1 mm EGTA, 1% (w/v) Triton X‐100, pH 7.5), 1% protease inhibitor (ThermoFisher), and 2% phosphatase inhibitor (Cell Signaling Technology, Danvers, MA, USA). Protein concentrations were determined using Micro BCA™ Protein Assay Kit (Life Technologies, Carlsbad, CA, USA). Twenty μg of samples were loaded onto the NuPAGE™ 4%–12%, Bis‐Tris gel (Life Technologies) and transfer to PVDF membranes (Millipore, Burlington, MA, USA). Membranes were blocked in 5% milk and incubated with primary and secondary antibodies (supplementary material, Table S3) before visualizing using SuperSignal West Pico PLUS Chemiluminescent Substrate (ThermoFisher) on a ChemiDoc™ Imaging System (Bio‐Rad).
Results and discussion
Our previous univariate analysis performed on the TCGA KIRC cohort demonstrated that METTL1 and BUD23 are upregulated in primary KIRC compared to normal kidney tissues [14]. Higher expression levels of these genes are associated with worse OS, indicating their potential as prognostic biomarkers in KIRC [14]. To evaluate whether METTL1 and BUD23 serve as independent prognostic factors, we conducted multivariate Cox regression analysis against clinicopathological features [gender, age, race, clinical stage, Tumor (T), Node (N), and Metastasis (M)] using the TCGA KIRC cohort. This analysis showed that upregulation of BUD23 is an independent prognostic factor in KIRC (Figure 1A). Although METTL1 upregulation did not appear to be a significant prognostic predictor against other clinical parameters in the KIRC cohort (supplementary material, Figure S1), it is significantly associated with a worse OS in advanced clinical stage (Stage IV) of KIRC (Figure 1B,C). Similarly, BUD23 is upregulated in late‐stage KIRC, further linking it to poor prognosis (Figure 1D,E). Overall, these findings indicate that upregulated METTL1 and BUD23 may contribute to worse clinical outcome in late‐stage KIRC.
Gene expression and clinical relevance of METTL1 and BUD23 in KIRC. (A) Multivariate analysis of BUD23 against other key clinicopathological features in KIRC. Significance is denoted by p < 0.05 with log‐rank text. (B) Expression levels of the METTL1 in KIRC across different clinical stages. Significance is denoted by p < 0.05 by ANOVA test followed by Dunnett's test for multiple comparison of the means. (C) Kaplan–Meier survival curves of KIRC patients based on the expression of METTL1. Red and blue represent higher (> median) and lower (< median) levels of gene expression, respectively. Significance is denoted by p < 0.05 by log‐rank test. (D, E) Gene expression and survival analysis (similar to panels (B) and (C)) were performed for BUD23 using data from the TCGA KIRC cohort.
To explore the functional role of METTL1 in KIRC, we depleted METTL1 using short hairpin RNAs (shRNA) in two KIRC cell lines, CAKI‐1 and 786‐O. Based on RT‐qPCR and western blotting assays, a significant decrease in transcript and protein levels of METTL1 (Figure 2A,B) led to significantly decreased cell proliferation and colony formation in CAKI‐1 and 786‐O compared to the control (Figure 2C,D). Wound‐healing assay revealed that METTL1 knockdown significantly impaired cell migration (Figure 2E and supplementary material, Figure S2A). 3D culture demonstrated an impairment in tumor mass formation consequent to METTL1 knockdown (Figure 2F). These findings suggest that METTL1 plays a role in KIRC maintenance by regulating cancer cell proliferation, clonogenicity, tumor mass formation, and migration.
*Knockdown of METTL1 suppresses proliferation, colony formation, and migration of KIRC cells. (A) Relative transcript levels of METTL1 in CAKI‐1 and 786‐O cell lines following shRNA‐mediated depletion of METTL1 (sh1 and sh2) compared to a nontargeting shRNA control (NTC) measured by RT‐qPCR. (B) Representative western blotting of METTL1 protein levels in CAKI‐1 and 786‐O cells transduced with lentivirus expressing METTL1‐targeting shRNAs (sh1 and sh2) or NTC. Fold‐change of METTL1 expression normalized to the loading control (GAPDH) is shown relative to NTC. (C) Cell viability in METTL1‐depleted CAKI‐1 and 786‐O cells measured by CCK‐8 assay. Relative cell viability (fold‐change) are normalized to day 0. (D) Colony formation assay showing colony‐forming ability in METTL1‐depleted CAKI‐1 and 786‐O cells. The relative colony area ratio is shown for each group. (E) Wound healing assay showing migratory ability of METTL1‐depleted CAKI‐1 and 786‐O cells, with migrated area normalized to 0 h for each cell line. Data are presented as the mean ± SEM from ≥3 biological replicates. For panels (A) and (D), significance was determined by one‐way ANOVA test. Two‐way ANOVA was performed to determine the significance in panels (C) and (E) by comparing METTL1 knockdown groups to the NTC control. Dunnett's Test was used for multiple comparisons of the means. *p < 0.05; **p < 0.01; ***p < 0.001; ***p < 0.0001. (F) Images of tumor mass that formed in the 3D culture spheroids following knockdown of METTL1 (sh1 and sh2) in CAKI‐1 and 786‐O cells compared to NTC. Scale bar, 200 μm.
We further investigated how BUD23 functions in KIRC. Similarly, shRNA‐mediated BUD23 knockdown resulted in significantly reduced transcript and protein levels of BUD23 in CAKI‐1 and 786‐O cells (Figure 3A,B). Depletion of BUD23 significantly repressed the proliferation, clonogenicity, migration, and tumor mass formation in both cell lines (Figure 3C–F and supplementary material, Figure S2B). These results highlight that BUD23 is also important in the maintenance of KIRC tumors, indicating that upregulation of BUD23 confers oncogenic potential.
*Knockdown of BUD23 suppresses proliferation, colony formation, and migration of KIRC cells. (A) Relative transcript levels of BUD23 in CAKI‐1 and 786‐O cell lines following shRNA‐mediated depletion of BUD23 (sh1 and sh2) compared to a nontargeting shRNA control (NTC) measured by RT‐qPCR. (B) Representative western blotting of BUD23 protein levels in CAKI‐1 and 786‐O cells transduced with lentivirus expressing BUD23‐targeting shRNAs (sh1 and sh2) or NTC. Fold‐change of BUD23 expression normalized to the loading control (GAPDH) is shown relative to NTC. (C) Cell viability in BUD23‐depleted CAKI‐1 and 786‐O cells measured by CCK‐8 assay. Relative cell viability (fold‐change) are normalized to day 0. (D) Colony formation assay showing colony‐forming ability in BUD23‐depleted CAKI‐1 and 786‐O cells. The relative colony area ratio is shown for each group. (E) Wound‐healing assay showing migratory ability of BUD23‐depleted CAKI‐1 and 786‐O cells, with migrated area normalized to 0 h for each cell line. Data are presented as the mean ± SEM from ≥ 3 biological replicates. For panels (A) and (D), significance was determined by one‐way ANOVA test. Two‐way ANOVA was performed to determine significance for panels (C) and (E) by comparing BUD23 knockdown groups to the NTC control. Dunnett's Test was used for multiple comparisons of the means. *p < 0.05; **p < 0.01; ***p < 0.001; ***p < 0.0001. (F) Images of tumor mass that formed in the 3D culture spheroids following knockdown of BUD23 (sh1 and sh2) in CAKI‐1 and 786‐O cells compared to NTC. Scale bar, 200 μm.
METTL1 and BUD23 overexpression are associated with dysregulation of MYC signaling and DNA repair pathways in KIRC (supplementary material, Figure S3). Using the TCGA KIRC datasets, we also demonstrated that METTL1 and BUD23 expression are negatively correlated with the expression of the most frequently dysregulated TSGs in KIRC, including polybromo 1 (PBRM1), phosphatase and tensin homolog (PTEN), and SET domain containing 2, histone lysine methyltransferase (SETD2) (Figure 4A) [16, 17, 18]. RT‐qPCR confirmed overall significantly higher expression of these TSGs in METTL1 knockdown, but not BUD23 knockdown cells relative to controls, consistent with METTL1's function as the mRNA m^7^G writer (supplementary material, Figure S4). We reanalyzed previously published m^7^G‐MeRIP‐seq datasets available for HeLa and HepG2 cells to determine the presence on m^7^G in PBRM1, PTEN, and SETD2 transcripts [9]. We found that these transcripts are m^7^G‐methylated (Figure 4B and supplementary material, Figure S5) and m^7^G peaks decreased after METTL1 knockdown in both cell lines compared to control (Figure 4B). These findings suggest that METTL1 may regulate the expression of TSGs (PBRM1, PTEN, and SETD2) in KIRC via an METTL1‐mediated internal m^7^G mRNA modification. IGF2BP3, an m^7^G reader, is known to bind m^7^G in mRNAs, promoting transcripts degradation [19]. Downregulation of these TSGs may be due to the action of IGF2BP3 in degrading m^7^G methylated mRNAs.
Negative correlation between METTL1 and BUD23 expression with PBRM1, PTEN, and SETD2, and observation of m7G methylation in these genes. (A). Correlation analysis of METTL1 and BUD23 expression with PBRM1, PTEN, and SETD2 expression in KIRC. Each point represents log2‐FPKM gene expression values for individual patients in the TCGA dataset. The blue line indicates linear regression with Pearson's correlation coefficient (R) and p values shown. (B) Integrative genome viewer plots showing the m7G‐MeRIP‐seq peaks at PBRM1, PTEN, and SETD2 in HeLa and HepG2 following stable knockdown of METTL1 compared to control (GSE112276).
In summary, our study demonstrates the oncogenic roles of METTL1 and BUD23 in KIRC, as their expressions are linked to worse overall outcome in advanced KIRC and depletion of these m^7^G writers suppresses cell proliferation, colony formation, and migration in vitro. We show that METTL1 and BUD23 expression is negatively correlated with key TSGs (PBRM1, PTEN, and SETD2) in KIRC. Furthermore, m^7^G‐MeRIP‐seq analysis indicates the METTL1‐mediated m^7^G modification affects mRNAs encoded by these TSGs, underscoring the involvement of m^7^G‐dependent pathways in KIRC pathogenesis. These findings clearly indicate the potential of METTL1 and BUD23 upregulation as prognostic biomarkers, and suggest potential mechanism of how these m7G writers contribute to KIRC maintenance via an m^7^G‐dependent manner. Our study establishes a foundation for future in vivo and mechanistic studies to further elucidate the roles of METTL1 and BUD23 in KIRC and assess their potential as therapeutic targets.
Author contributions statement
JJ‐LW conceived the idea. AS and JT performed experiment and analysis. AS performed bioinformatic analysis. XSX and RPT performed scratch assay. YF designed, performed the 3D culture and analyzed results. AS, YF and JJ‐LW wrote the article.
Supporting information
Supplementary materials and methods
Figure S1. Multivariate analysis of METTL1 and key clinicopathological features in KIRC Figure S2. Representative images from wound healing assays showing migratory ability of (A) METTL1 and (B) BUD23‐depleted CAKI‐1 and 786‐O cells, with migrated area normalized to 0 h for each cell line Figure S3. Correlation between METTL1 (A) and BUD23 (B) expression and cancer hallmark pathways Figure S4. Relative expression of PBRM1, PTEN, and SETD2 in CAKI‐1 and 786‐O cells subjected to METTL1 and BUD23 knockdown (METTL1 sh1, METTL1 sh2, BUD23 sh1 and BUD23 sh2) compared to non‐targeting shRNA control (NTC) Figure S5. Integrative genome viewer plots showing the m^7^G ‐MeRIP‐seq peaks at PBRM1, PTEN, and SETD2 in HeLa and HepG2 cells (GSE112276) Table S1. Sequences of shRNAs against non‐targeting control, METTL1 and BUD23
Table S2. RT‐qPCR Primers used in this study Table S3. Antibodies used in this study
The reference list from the paper itself. Each links out to its DOI / PubMed record.
- 1Gkolfinopoulos S , Psyrri A , Bamias A . Clear‐cell renal cell carcinoma ‐ a comprehensive review of agents used in the contemporary management of advanced/metastatic disease. Oncol Rev 2021; 15: 530.33747368 10.4081/oncol.2021.530PMC 7967495 · doi ↗ · pubmed ↗
- 2Yu EM , Linville L , Rosenthal M , et al. A contemporary review of immune checkpoint inhibitors in advanced clear cell renal cell carcinoma. Vaccine 2021; 9: 919.10.3390/vaccines 9080919 PMC 840265234452045 · doi ↗ · pubmed ↗
- 3Ljungberg B , Albiges L , Abu‐Ghanem Y , et al. European Association of Urology guidelines on renal cell carcinoma: the 2019 update. Eur Urol 2019; 75: 799–810.30803729 10.1016/j.eururo.2019.02.011 · doi ↗ · pubmed ↗
- 4Pandolfini L , Barbieri I , Bannister AJ , et al. METTL 1 promotes let‐7 micro RNA processing via m 7G methylation. Mol Cell 2019; 74: 1278–1290.31031083 10.1016/j.molcel.2019.03.040PMC 6591002 · doi ↗ · pubmed ↗
- 5Ramanathan A , Robb GB , Chan S‐H . m RNA capping: biological functions and applications. Nucleic Acids Res 2016; 44: 7511–7526.27317694 10.1093/nar/gkw 551PMC 5027499 · doi ↗ · pubmed ↗
- 6Tomikawa C . 7‐Methylguanosine modifications in transfer RNA (t RNA). Int J Mol Sci 2018; 19: 4080.30562954 10.3390/ijms 19124080 PMC 6320965 · doi ↗ · pubmed ↗
- 7Malbec L , Zhang T , Chen Y‐S , et al. Dynamic methylome of internal m RNA N 7‐methylguanosine and its regulatory role in translation. Cell Res 2019; 29: 927–941.31520064 10.1038/s 41422-019-0230-z PMC 6889513 · doi ↗ · pubmed ↗
- 8Haag S , Kretschmer J , Bohnsack MT . WBSCR 22/Merm 1 is required for late nuclear pre‐ribosomal RNA processing and mediates N 7‐methylation of G 1639 in human 18S r RNA. RNA 2015; 21: 180–187.25525153 10.1261/rna.047910.114PMC 4338346 · doi ↗ · pubmed ↗