How reliable is the labeling of a commercial phytosteroid product? A 12-week randomized double-blind training study
Joshua Dissemond, Tim Havers, Steffen Held, Stephan Geisler, Tihomir Kostov, Patrick Diel, Svea Türschmann, Maria K. Parr, Eduard Isenmann

TL;DR
A study tested a commercial phytosteroid supplement's effectiveness during resistance training but found the product's active ingredients were below labeled amounts, leading to no additional benefits.
Contribution
This study highlights the importance of verifying supplement contents and biological activity to ensure reliable research outcomes in phytosteroid studies.
Findings
The supplement contained less than 1% of the labeled 20E and 10.4% of the labeled DSG.
No group-specific performance or muscle growth improvements were observed with the supplement.
The supplement showed no biological activity in C2C12 cells.
Abstract
Phytosteroids like 20-hydroxyecdysone (20E) and diosgenin (DSG) have shown promising anabolic and performance-enhancing effects in in vitro, animal, and human studies. Combining phytosteroids is common in supplements, with early in vitro research suggesting additive effects via distinct signaling pathways. However, human studies on the combined effects of 20E and DSG are lacking. This study aimed to evaluate the anabolic and performance-enhancing potential of a commercially available 20E and DSG supplement. Twenty-eight resistance-trained young men were recruited for this study. Participants were randomized into two groups: a 20E and DSG (EcDi) group, and a placebo (Plac) group. Both groups performed free-weight resistance training three times per week for 12 weeks. The EcDi group received a commercially available phytosteroid product three times a day (as recommended on the label),…
Genes, proteins, chemicals, diseases, species, mutations and cell lines named across the full text — each resolved to its canonical identifier and authoritative record.
Click any figure to enlarge with its caption.
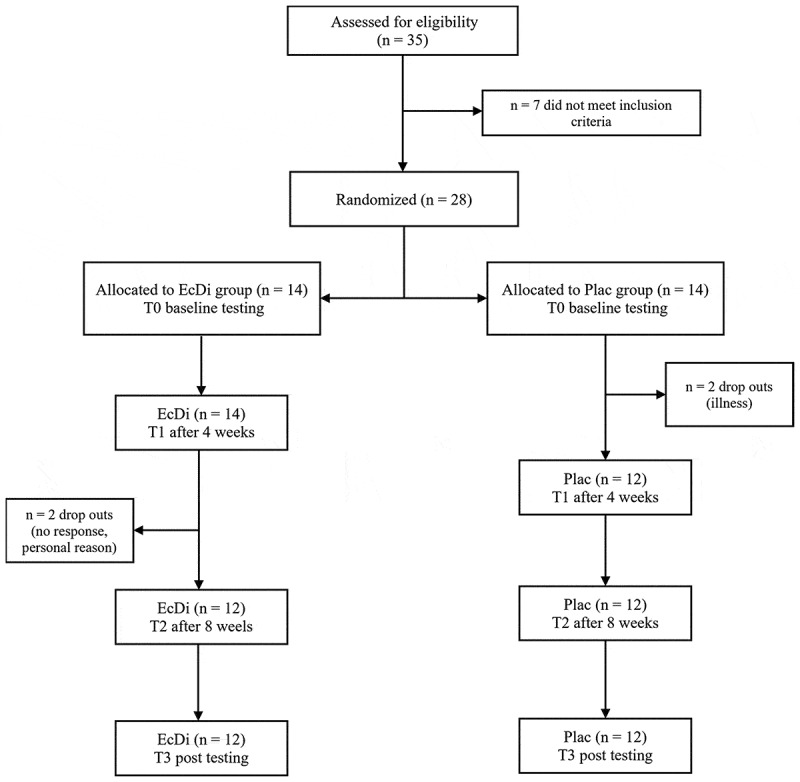 Figure 1
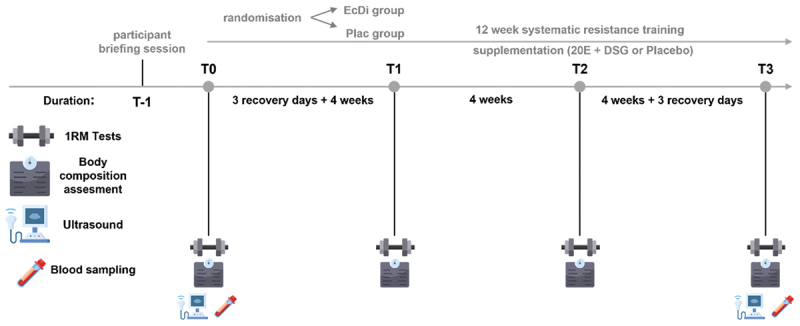 Figure 2
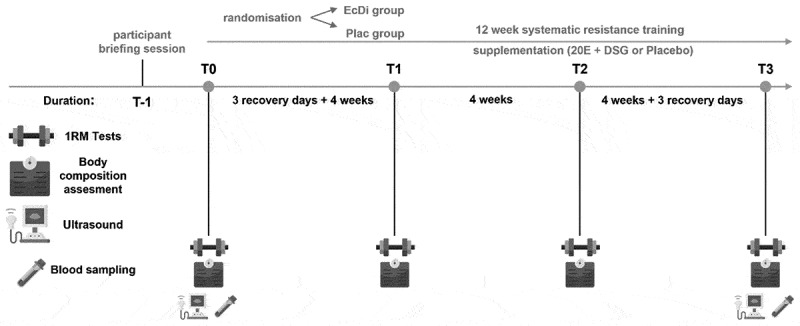 Figure 3
 Figure 4
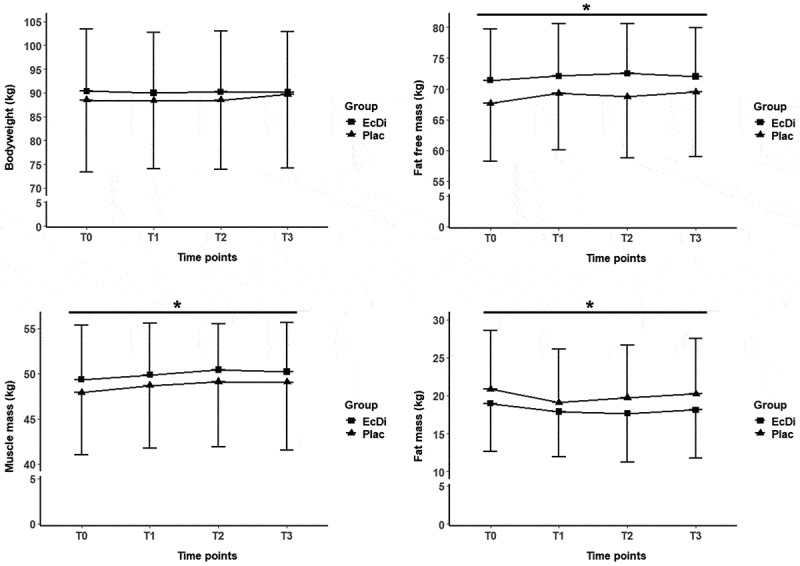 Figure 5
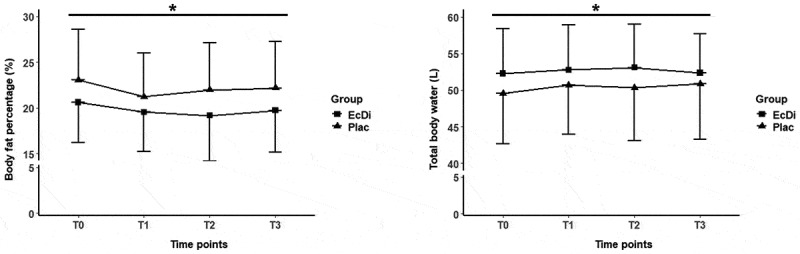 Figure 6
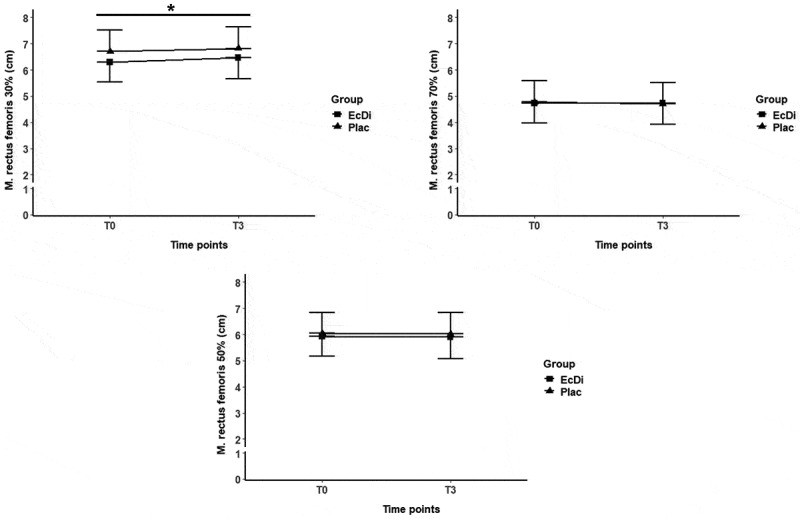 Figure 7
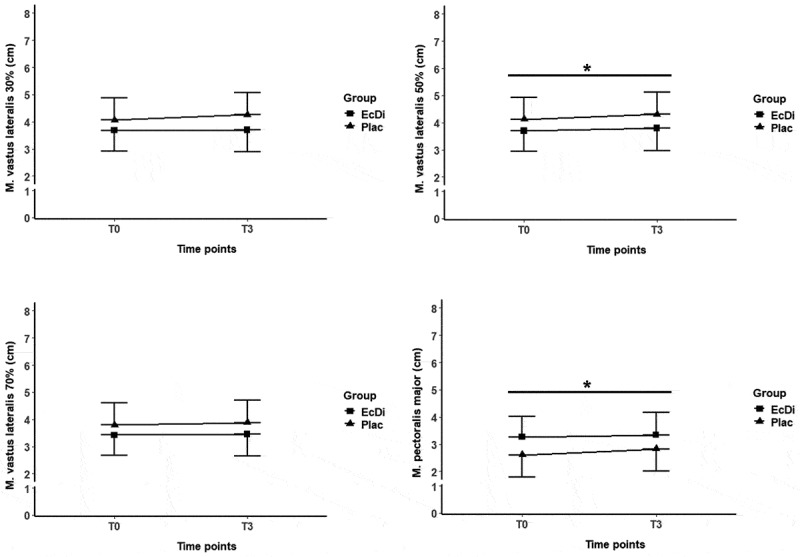 Figure 8
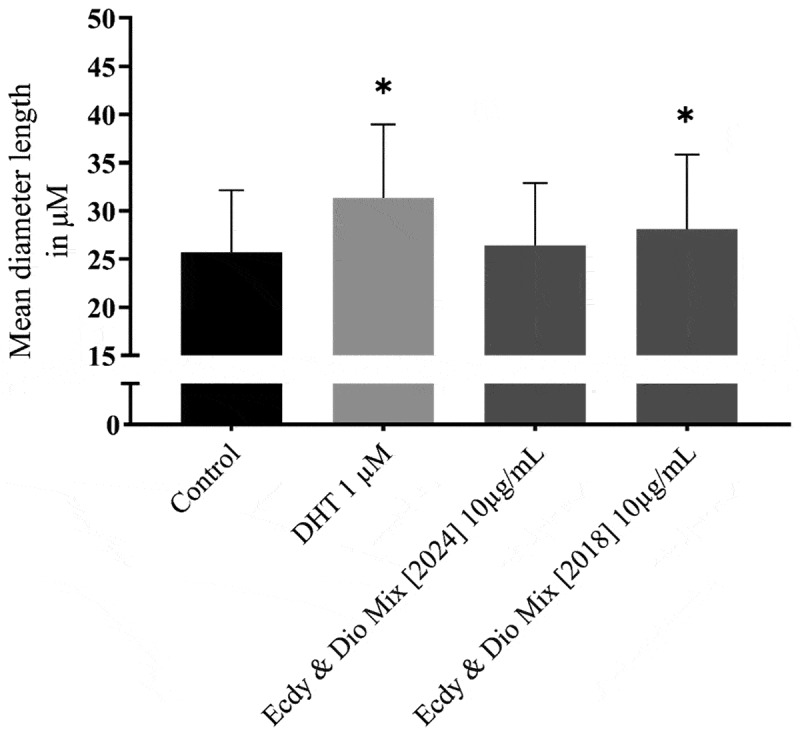 Figure 9
 Figure 10
 Figure 11
 Figure 12
Peer Reviews
No public reviews on file for this paper yet. If you reviewed it on a platform where reviews are public (OpenReview, ICLR, NeurIPS, ICML), you can paste yours below so the community can read it here.
Videos
No videos yet. Explain this paper in a talk, walkthrough, or lecture? Add one.
Taxonomy
TopicsHormonal and reproductive studies · Muscle metabolism and nutrition · Pharmacological Effects and Assays
Introduction
The use of dietary supplements is common in sports and varies depending on the specific sports discipline [1,2]. One of the main reasons for athletes to take nutritional supplements is to enhance their athletic performance, as even minor differences in performance can be decisive for success [3–6]. In this context, dietary supplements play an important role in athletes’ recovery, training adaptation, and performance.
Phytosteroids, like 20-hydroxyecdysone (20E) or diosgenin (DSG) are gaining attention for their potential performance-enhancing and anabolic effects [7–10]. Ecdysteroids are a class of polyhydroxylated steroids found in plants and other organisms, with 20E being the most abundant and biologically active form of ecdysteroids in insects [11,12]. Research on the effects of 20E in mammals shows promising results, indicating anabolic, fat-reducing, anti-diabetic, anti-inflammatory, and cardio-, bone-, and cartilage-protective properties [11]. However, the exact mechanism of action of 20E in mammals remains unclear, though in vitro studies suggest it may operate through various pathways, including a membrane G-protein coupled receptor (GPCR) and nuclear estrogen receptor-β (ERβ), with recent research proposing a combined interaction involving the GPCR Mas receptor and a membrane-bound estrogen receptor [10–15]. In addition recent studies demonstrated anabolic effects in vitro and in animal models [16–21]. Furthermore investigations in mice and rats aimed to identify metabolites to better understand the pharmacological effects of 20E [22,23].
Current studies in humans, however, are rather inconclusive. Isenmann et al. and Pérez-Piñero et al. were able to observe both performance-enhancing and anabolic effects through 20E application [7,24], whereas Willborn et al. were unable to detect any effect [25]. In comparison to the study by Wilborn et al., the actual 20E content was examined in the two other studies, but only Isenmann et al. also reported testing for the presence or absence of other prohibited substances and for anabolic effects in cell culture [7,24]. Isenmann et al. reported a total of 6 mg of 20E per capsule, corresponding to a daily dosage of 12 mg (84 mg/week) in the low-dose group and 48 mg (336 mg/week) in the high-dose group [7]. In contrast, the total daily dose in the study by Pérez-Piñero et al. was only 3.2 mg (22.4 mg/week) [24]. In addition to studies involving healthy and trained individuals, 20E is currently being investigated as a phytopharmaceutical in preliminary clinical pilot trials (phases 1 and 2). Single-dose administrations of 175 mg and 350 mg were well tolerated, with no significant adverse effects observed [26]. Furthermore, emerging data indicate that 20E can significantly enhance muscle function in geriatric populations and may reduce the risk of mortality and respiratory failure following COVID-19 infection [27,28].
Furthermore, Ambrosio et al. compared various 20E supplements and found that most products did not contain the amount of 20E stated on their labels [29]. Only three of the 12 analyzed supplements contained 20E levels that complied with the allowable deviation of 50% between the labeled and actual content [30]. Two of these products labeled to contain suma root reported 20E concentrations ranging from 1.7 to 3.3 mg/capsule (measured concentration 1.37 to 2.32 mg/capsule), while one product using spinach extract declared a 20E content of 25 mg/capsule (measured concentration 22.29 mg/capsule) [29]. These findings of Ambrosio et al. highlight the lack of quality assurance in supplement formulations and the inconsistency in human intervention studies. In addition to widely varying ingredient contents, dietary supplements may also be contaminated with banned substances. It is estimated that 6.4–8.8% of positive doping cases can be attributed to the use of contaminated dietary supplements [31–33]. Even worse, recent studies have shown that nearly 20% of tested 20E supplements contained impurities, including prohibited anabolic substances [34]. Therefore, if 20E and contaminations are not specifically analyzed, any observed effects could potentially be related to contamination rather than the compound itself.
Based on the effects in cell culture, animal models, and partly also in human studies, the World Anti-Doping Agency (WADA) has included 20E in their monitoring program in 2020 for their anabolic and performance-enhancement effects [35].
In addition to supplements, 20E can also be ingested through food sources. Spinach and quinoa in particular contain relatively large amounts of 20E [22,36]. However, the concentrations in food varies, depending on variety, genetics and environmental conditions [36,37]. The 20E content in quinoa seeds ranges from 70 to 800 μg/g and in spinach ranges from 4 to 800 μg/g fresh weight and 17 to 885 μg/g dry weight [22,36–38].
Recent studies have shown that, despite the consumption of large amounts of spinach ( > 900 g; 20 ± 3 µg/g 20E, approximately 18–19 mg/serving) and quinoa (150 g raw; 370 ± 14 µg/g 20E, approximately 53.3 mg/ serving), only 1–3% of 20E and its metabolites are absorbed. In contrast, administration of 50 mg of pure 20E resulted in approximately 50% recovery in urine, indicating significantly higher bioavailability compared 20E from food sources [39–41].
Following the promising effects of 20E, the phytosteroid DSG, found in fenugreek and yams, has also attracted considerable attention for its potential therapeutic and performance-enhancing properties [42]. DSG is of high interest for scientific research due to its postulated pharmacological properties against certain diseases such as diabetes, hyperlipidemia, cancer, cardiovascular diseases, metabolic syndrome, oxidative stress and inflammation [42–46]. Like 20E, DSG reportedly interacts with several signaling pathways, including NF-κB, JAK/STAT, and PI3K/AKT/mTOR as well as MAPK and several others [45]. Beyond its pharmaceutical applications, DSG has been studied for its effects on performance, body composition, and hormones. A meta-analysis by Isenmann et al. found small effects in lower body performance, body composition, and blood testosterone levels in healthy and trained men [8]. A small reduction in fat mass (FM) and estradiol concentration (E2) were also detected. However, the small sample size (n = 378) and limited number of studies (k = 6) suggest caution in interpreting these results. Similarly, a study by Rao et al. showed that high-dose fenugreek (600 mg Libifem) increased leg press strength and lean mass while reducing fat mass compared to placebo in women [47]. These effects were dose-dependent and similar to previous findings in male participants [8].
Apart from the individual anabolic effects of the two substances, there are already initial recommendations to combine phytosteroids such as 20E and DSG [48]. Combinations of 20E and DSG have shown promising results and are the subjects of ongoing research. Kostov et al. [21] investigated the combined effect of 20E and DSG in C2C12 cells at different dosages and showed significantly higher hypertrophic effects in three of the five combinations compared to the individual substances [21]. To our knowledge, the potential anabolic and performance-enhancing effects of the combination of 20E and DSG have not yet been investigated in humans. Therefore, the aim of this study was to examine changes in 1-RM performance, body composition, muscle thickness and several biomarkers in response to a 12-week free-weight-based resistance training (RT) program in strength-trained male athletes using a commercially available phytosteroid supplement compared to placebo. It was hypothesized that participants taking the combined supplement of 20E and DSG would have higher increases in 1-RM performance, muscle thickness, and better results in body composition and several biomarkers compared to placebo. The results of this study will provide additional data to improve the understanding of the currently contradictory findings regarding phytosteroid supplementation and its effects on performance enhancement in male athletes.
Material and methods
Participants and ethical approval
2.1.
To determine the required sample size, an a priori power analysis was conducted using F-tests (ANOVA: fixed effects, special, main effects, and interactions). The calculation was based on a medium effect size (f = 0.25), with an α-error of 0.05 and a power of 0.8 (1-β error), according to a previous study [7]. For a two-arm design (df = 1) and four measurement time points, the total sample size was 24 participants. However, considering the 12-week study duration and the potential for dropouts, the minimum sample size was adjusted to 28 participants. Initially, 35 male athletes were recruited, out of which 28 met the inclusion criteria. Twenty-four subjects completed the study and were included in the analysis. Two of the subjects were lost due to illness, one dropped out for personal reasons and one participant did not respond after the second test session. Figure 1 outlines subject recruitment, randomization, and reasons for dropout. Figure 1.Participant flow diagram. EcDi, ecdysterone + diosgenin group; Plac, placebo group.
All volunteers were recruited at a local gym (Windhagen, Germany) and met the following criteria: 1) at least 18 years old, 2) free from neuromuscular/musculoskeletal disorders and known chronic diseases (cardiovascular disease, type-2 diabetes mellitus, etc.), 3) no consumption of any type of phytosteroid supplements in the last 6 months, 4) no consumption of anabolic steroids, 5) 1-RM SQ of 120% body weight (BW) and 1-RM BP of 100% BW or higher, 6) at least 3 years of RT experience with a minimum of 3 sessions per week; 7) were nonsmokers. According to Santos et al. [49] and McKay et al. [50], the inclusion criteria for 1-RM and RT experience ensure that all subjects are at least advanced, well-trained athletes. The investigation was approved by the local ethics committee of the IST University of Applied Sciences, Düsseldorf (Nr.06/2023) and registered in the German register for clinical trial (DRKS00036224). Before the subjects were included in the study, they were informed about the study design and objectives and had to give their written consent to participate. All personal data collected was anonymized and complies with the data protection regulations in Germany.
Experimental design
2.2.
A randomized, placebo-controlled, double-blind study was used to investigate the effects of a commercially available supplement on 1-RM performance, body composition, muscle thickness, endocrine system, liver and kidney function. Figure 2 illustrates the experimental design of the study. At the initial visit (T-1), all individuals interested in participating in the study attended a participant briefing session outlining the study purpose and providing all necessary details for participation. The study consisted of a 12-week intervention with four measurement points (T0, T1, T2, T3) and a 3-day recovery period after the baseline test at T0 and before the posttest at T3. Figure 2.Experimental design. EcDi, ecdysterone + diosgenin group; Plac, placebo group; 1-RM, one-repetition-maximum; 20E, ecdysterone; DSG, diosgenin; T-1, initial visit; T0-T3, measurement times.
At T0 and T3, all athletes were assessed for body composition, hormonal status, kidney and liver function, muscle thickness, and dynamic strength. The testing session at four (T1) and eight weeks (T2) of the intervention consisted of body composition and 1-RM assessments only. After baseline testing, subjects were randomly assigned to either the ecdysterone and diosgenin group (EcDi) or the placebo group (Plac) using stratified randomization based on age and relative strength in squat (SQ) and bench press (BP). Six strata were created based on three levels of relative strength for squat (SQ: < 1.25; 1.26–1.49; ≥1.50) and bench press (BP: < 1.05; 1.06–1.30; > 1.30), as well as three age groups (19–25, 27–34, ≥35). After stratification, each of the six strata was randomized into two groups using a randomizer (ultimatesolver.com). The 20E + DSG and the placebo supplements were then administered to the participants after the 3-day recovery period.
Procedures
2.3.
Participants were not allowed to conduct RT or any other strenuous physical activity for 48 hours before testing. In addition, the participants had to arrive sober and were not allowed to consume any soft drinks, coffee or alcohol. However, the volunteers were instructed to drink 400–500 ml of water in the morning before testing to ensure that their water balance was equalized. The order of measurements at T0 and T3 was as follows: 1) blood samples, 2) body composition, 3) muscle thickness, and finally 1-RM SQ and BP. At T1 and T2, only body composition and 1-RM SQ and BP were measured, in this order. After the muscle thickness assessment and before the 1-RM tests, the participants consumed 1 g of oats per kilogram of body weight, one banana, 20 g honey, and hot water ad libitum to ensure sufficient energy availability. At T1 and T2, the meal was taken between the body composition assessment and the 1-RM tests. After the meal, participants had 30–60 minutes before the 1-RM assessment began. All measurements (T0-T3) were conducted in the morning (7:00–12:00 am) at the same time of the day by the same researchers, doctor and volunteer.
Blood samples
2.4.
To investigate the potential effects of EcDi supplementation on hormone status and metabolism, the following hormonal parameters were analyzed: estradiol (E2), total testosterone (T), free testosterone (fT), cortisol (CORT), and insulin-like growth factor 1 (IGF1). Biomarkers associated with kidney and liver function, which serve as essential indicators of metabolic health, were analyzed. These included creatinine, glutamate-oxaloacetate transaminase (GOT), glutamate-pyruvate transaminase (GPT), and gamma-glutamyl transferase (GGT). Blood samples were collected immediately at the beginning of T0 and T3 (7:00–8:30 am). While the participant was sitting or lying down, a physician applied a tourniquet and used a winged infusion set to venipuncture the participant’s right arm and collect fresh venous blood in a vacutainer. After all blood samples were collected, they were taken to an external laboratory for analysis (Labor Dr. Wisplinghoff, Horbeller Str. 18–20, 50858 Köln, Germany). This laboratory has been used in previous studies [7,51].
Body weight and body composition assessment
2.5.
All anthropometric measurements were assessed at each time point (T0, T1, T2, T3). For BW assessment, participants wore only underwear and no shoes or socks. A digital scale (Etekcity, EB4074S, Anaheim, California 92,806, USA) was used to assess BW of the subjects. Because the study was conducted in winter, participants were allowed to wear light clothing for the body composition assessment, but were required to remove all forms of jewelry, watches, or any object consisting of metal. Fat-free mass (FFM), MM, FM, total body water (TBW) and body fat percentage (BF%) were analyzed by bioelectrical impedance analysis (BIA 101 AKERN, Florence, Italy). The BIA 101 Akern is a valid and reliable alternative to dual-energy X-ray absorptiometry (DXA) for the assessment of body composition and has been used in various other studies [7,52–54]. Whole-body resistance (R) and reactance (Xc) were measured using an alternating sinusoidal electric current of 400 µA at an operating frequency of 50 kHz. The device was calibrated every morning using the standard control circuit supplied by the manufacturer with a known impedance (resistance (R) = 383 ohm; reactance (Xc) = 45 ohm). The accuracy of the device was 1% for R and 2% for Xc. For the bioelectrical impedance measurement, participants were placed in a supine position with their limbs slightly apart from the body and remained in this position for 10 minutes to allow for fluid shifts. Disposable tab electrodes (BIATRODES, Akern Srl, Florence, Italy) were then applied to the metacarpal and metatarsal sites of the right wrist and ankle [53]. Subsequently, the measurement was performed and the data analyzed using BodyGramPro software (Version 3.0, Akern, Florence, Italy).
Muscle thickness assessment
2.6.
Muscle thickness was assessed using noninvasive skeletal muscle ultrasound imaging of the right thigh and chest locations of all participants. Measurements were conducted at T0 (baseline) and T3 (post-intervention). A B-mode ultrasound device (Mindray DP-50, Mindray Medical International Ltd, Shenzhen, China) with an 8.5-MHz linear probe (Mindray 75L53EA, Mindray Medical International Ltd, Shenzhen, China) was used, following established procedures from previous studies [55–58]. Prior to image acquisition, all anatomical locations of interest were identified using standardized landmarks. Muscle thickness was assessed for the lateral quadriceps muscle (M. vastus lateralis (VL) and M. vastus intermedius (VI)), anterior quadriceps muscle (M. rectus femoris (RF)and VI), and M. pectoralis major (PM). To ensure consistent positioning for repeated measurements, all sites were marked with a waterproof pen. Lateral quadriceps thickness was measured at 30%, 50% and 70% of the distance between the most prominent point of the greater trochanter and the lateral condyle of the tibia (gain 50 dB) with the participants lying on their left side on an examination table. Landmarks of the anterior quadriceps femoris were set at 30%, 50% and 70% of the distance between the anterior inferior supra-iliac crest and the proximal border of the patella. Muscle thickness measurements of the anterior thigh were obtained with the subjects in the supine position (gain 50 dB). In the same supine position, the PM was measured on the right side between the third and fourth rib, below the midpoint of the clavicle (gain: 50 dB). The arms remained relaxed at the sides of the body. Muscle thickness was determined using the borders of the subcutaneous adipose tissue and the muscle-bone interface as reference points [56].
A water-soluble ultrasound transmission gel was applied to the probe to ensure optimal contact. The probe was carefully placed perpendicular to the muscle’s long axis, avoiding any compression of the underlying tissue. For each muscle, three images were captured and stored digitally. Muscle thickness was then analyzed using the caliper measurement tool of the ultrasound device. If one of the images showed a difference of more than 10%, a fourth image was taken and used as a reference instead of the deviating image. The mean value of the three images was used for further analysis. Muscle thickness measures were performed by an experienced and trained ultrasound technician, blinded to group allocation. The three images taken at T0 and T3 were used for further analysis of the coefficient of variation (CV) and the intraclass correlation coefficient (ICC). ICC estimates and their 95% confidence intervals were calculated using R (version 4.4.1) and RStudio, based on a mean-rating (k = 3), absolute-agreement, two-way mixed-effects model (ICC(3,k). The ICC(3,k) and CV values for the lateral quadriceps muscle, anterior quadriceps muscle, and M. pectoralis major were 1.00 (CV = 0.82%), 0.99 (CV = 0.55%), and 0.99 (CV = 1.17%), respectively.
Maximum dynamic strength test
2.6.1.
Free weight 1-RM, SQ, and BP were used to determine the maximum dynamic strength at each test session (T0, T1, T2, T3) in the following order: 1) 1-RM SQ, 2) 1-RM BP. A power rack (Gym 80 International GmbH, Gelsenkirchen, Germany) with a 20 kg Olympic barbell (Gym 80 International GmbH, Gelsenkirchen, Germany) and competition plates (Gym 80 International GmbH, Gelsenkirchen, Germany) was used for the 1-RM SQ and BP assessments. Prior to testing, participants performed a standardized warm-up consisting of five minutes of low-intensity running, followed by a specific warm-up for free weight SQ. After the warm-up, participants were instructed to perform warm-up sets of 10, 5, 3 and 1 repetitions using 50%, 60%, 70% and 80% of the subjects’ estimated 1-RM. Between the warm-up sets, participants rest for 1, 2, 3 and 4 minutes, respectively. A weight close to the participant’s 1-RM was then used and, if the lift was successful, the weight was increased until the subject failed the attempt. A rest period of 4 minutes was maintained between 1-RM attempts. Once the 1-RM SQ was achieved, a 10 minute rest was taken and the same procedure was used to determine the 1-RM BP. For the SQ, a 1-RM attempt was considered successful if the participant started squatting from a standing position with the knees fully extended, lowered the bar to a position where the top of the hip was below the top of the knee joint, and the participant then fully extended the knees without any corrective movements. The BP 1-RM was considered successful if the participant maintained contact with the upper back, buttocks and both feet, touched the bar to the chest (no pause) and then fully extended the arms. Strong verbal encouragement from the researcher was given during all 1-RM attempts. The protocol chosen for 1-RM assessment was in accordance with the NSCA guidelines for 1-RM determination [59]. The ICC(3,1) and the CV for this population were 0.97 and 5.1% for the SQ, and 0.99 and 2.0% for the BP (unpublished data). ICC(3,1) was chosen as it represents test-retest reliability using a two-way mixed-effects model with absolute agreement, based on a single measurement per test session [60].
Resistance training protocol
2.7.
The 12-week resistance training (RT) program for the EcDi and Plac groups consisted of three training sessions per week and followed a two-split training plan with three mesocycles of four weeks each. The two RT protocols (A/B) were trained alternately, with ABA in week one, BAB in week two, and so on. Each training day was followed by a rest day. Each mesocycle consisted of three weeks of loading phase and one deload week. The deload weeks were introduced to ensure adequate recovery for the 1-RM assessments and to counteract possible overloading due to rapid increases in training weights. Both training sessions consisted of six barbell, dumbbell or bodyweight exercises. [Tables 1 and 2](#t0001 t0002) show the protocols of the RT program with a detailed description of exercises, sets, repetitions, intensity (percentage (%) 1-RM; rate of perceived exertion (RPE)), tempo and rest.Table 1.Resistance training protocol A.ExerciseCycle 1Cycle 2Cycle 3Week 1–3 LoadingWeek 4 DeloadWeek 5–7 LoadingWeek 8 DeloadWeek 9–11 LoadingWeek 12 Deload(sets ×repetitions)Back Squat65% 1-RM65% 1-RM75% 1-RM75% 1-RM85% 1-RM85% 1-RM3 ×121–2 ×123 ×81–2 ×83 ×51–2 ×5Good MorningsRPE 8–10RPE 7RPE 8–10RPE 7RPE 8–10RPE 73 ×152 ×153 ×122 ×123 ×102 ×10Bench Press65% 1-RM65% 1-RM75% 1-RM75% 1-RM85% 1-RM85% 1-RM3 ×121–2 ×123 ×81–2 ×83 ×51–2 ×5Dumbbell FlysRPE 8–10RPE 7RPE 8–10RPE 7RPE 8–10RPE 73 ×152 ×153 ×122 ×123 ×102 ×10Barbell RowRPE 8–10RPE 7RPE 8–10RPE 7RPE 8–10RPE 73 ×152 ×153 ×122 ×123 ×102 ×10Landmine RotationRPE 8–10RPE 7RPE 8–10RPE 7RPE 8–10RPE 73 ×152 ×153 ×122 ×123 ×102 ×10Tempo (s)2:0:1 (eccentric : isometric : concentric)Rest (s)120–180 s (SQ, BP) and 90–120 s (all other lifts)1-RM, one repetition maximum; RPE, rate of perceived exertion; s, seconds; SQ, Squat; BP, Bench press;Table 2.Resistance training protocol B.ExerciseCycle 1Cycle 2Cycle 3Week 1–3 LoadingWeek 4 DeloadWeek 5–7 LoadingWeek 8 DeloadWeek 9–11 LoadingWeek 12 Deload(sets ×repetitions)Dumbbell LungesRPE 8–10RPE 7RPE 8–10RPE 7RPE 8–10RPE 73 ×152 ×153 ×122 ×123 ×102 ×10Romanian DeadliftRPE 8–10RPE 7RPE 8–10RPE 7RPE 8–10RPE 73 ×121–2 ×123 ×81–2 ×83 ×51–2 ×5Pull-upsRPE 8–10RPE 7RPE 8–10RPE 7RPE 8–10RPE 73 ×121–2 ×123 ×81–2 ×83 ×51–2 ×5Dumbbell incline Bench pressRPE 8–10RPE 7RPE 8–10RPE 7RPE 8–10RPE 73 ×152 ×153 ×122 ×123 ×102 ×10Dumbbell RowRPE 8–10RPE 7RPE 8–10RPE 7RPE 8–10RPE 73 ×152 ×153 ×122 ×123 ×102 ×10DumbbellLateral FlexionRPE 8–10RPE 7RPE 8–10RPE 7RPE 8–10RPE 73 ×152 ×153 ×122 ×123 ×102 ×10Tempo (s)2:0:1 (eccentric : isometric : concentric)Rest (s)120–180 s (RDL, PU) and 90–120 s (all other lifts)RPE, rate of perceived exertion; s, seconds; RDL, Romanian Deadlift; PU, Pull-ups;
The weights for SQ and BP for each participant started at 65% of their achieved 1-RM at T0 during weeks 1–4 and were increased by 10% every 4 weeks. The weight of the % 1-RM based exercises was adjusted after each 1-RM test session. As a counterpart to the SQ and BP exercises in RT protocol A, the Romanian deadlift (RDL) and pull-ups (PU) were trained at the same intensity using the RPE scale and repetition scheme in RT protocol B over the 12-week period. With the exception of the SQ and BP, the load for all other exercises was determined by trial and error and standardized using the RPE scale to ensure appropriate intensity [61,62]. During the loading weeks, the final set of each exercise was performed until momentary concentric failure or until proper exercise technique could no longer be maintained.
The participants increased the training weights for lower body exercises every third training session (TS), based on the final set of the specific exercise using the following formula:
For upper body exercises, the following formula was used:
Proper exercise technique was always prioritized, and if this could not be ensured, the weight was not increased. All exercises were performed using the maximum range of motion achievable by each individual participant. The RT sessions were partially supervised by a certified member of the research staff. There was a 48 h break between the performance test and the RT program at T1 and T2 and a 72 h break before T0 and T3. The described RT program was previously used by Isenmann et al. [9], showing significant improvements in 1-RM for SQ and BP, as well as gains in muscle mass, with only minor adjustments made to the RT program for the current intervention.
Nutrition
2.8.
Throughout the 12-week intervention, participants recorded their total dietary intake in a food diary using the FDDB app (Food Database GmbH, Bremen, Germany), which has been validated as a dietary assessment method [63]. After the baseline assessment, the subjects’ energy requirements were calculated using the Cunningham formula for resting energy expenditure (REE), and the physical activity level (PAL) was applied to determine total energy expenditure (TEE) [64]. Participants were instructed to eat in energy balance, and their TEE was provided to the subjects at the beginning of the intervention. Furthermore, subjects were required to consume 1.6–2.0 g of protein per kilogram of BW to ensure adequate recovery from the RT program [65].
Supplements and dosage
2.8.1.
In this study, a commercially available supplement (Weider Beta-Ecdysterone, LOD: 903176) was administered according to manufacturer’s recommendations (3 capsules per day). In previous research, the product analyzed for 20E content had a labeled concentration of 25 mg per capsule, with 22.29 mg (89.16% of the labeled amount) actually detected [29]. Therefore, this supplement demonstrated the highest total concentration and content of 20E per capsule [29]. According to the manufacturer’s label, the product (Weider Beta-Ecdysterone) contains 25 mg 20E from spinach extract, 50 mg DSG from yam root extract, 250 mg γ-oryzanol, 0.07 mg vitamin B6, 0.03 mg folic acid and 0.3 mg pantothenic acid per capsule. In addition, the new batch of the product was analyzed for its 20E content after the study. For validation, capsules from the same batch used by Ambrosio et al. [29] were also analyzed. The placebo consisted of a gelatin capsule and 1 g of sugar and was prepared by a member of the research team. Each individual in the Plac group took three capsules of the placebo compound per day. In both groups, the capsules were taken as follows: one in the morning, one at noon, and one in the evening. All participants in both groups were not allowed to talk about the supplement or open up the capsules to ensure blinding. The first dose consisted of 28 daily servings and was given to the subjects on the first day of the intervention. The next two doses (28 daily servings) were given to the participants after T1 and T2.
Quantitative supplement analysis
2.9.
Quantitative analysis was performed by UHPLC-MS/MS on an Agilent 1290 Infinity II UHPLC coupled to an Agilent 6495A triple quadrupole (QQQ) tandem MS system for the analysis of 20E or to an Agilent 6550A quadrupole time of flight (QToF) tandem MS system (Agilent Technologies GmbH, Waldronn, Germany) for the analysis of DSG. MassHunter software (Agilent Technologies GmbH, Waldronn, Germany) was used for data acquisition and quantitative analysis.
Chromatographic separation was achieved on an Agilent Poroshell EC-C18 column (50×2.1 mm; 1.9 µm particle size) with solvent A consisting of H_2_O:formic acid (99.9:0.1, v:v) and solvent B of ACN:formic acid (99.9:0.1, v:v). While for DSG, an isocratic elution for 5 min at 20 % A/80 % B [https://doi.org/10.1155/2022/5607347] was employed, a stepwise linear gradient was used for 20E analysis: 5 % B for 1 min, 0.2 min increase to 19 % B, 2.8 min increase to 35 % B, 0.2 min increase to 98 %, 2 min hold and 0.3 min re-equilibration to 5 % B followed by 2 min of post run time. Sample injection volume was set to 2 µL (20E)/5 µL (DSG), flow rate to 0.5 mL/min and column temperature to 30 °C (20E)/35 °C (DSG).
Both MS systems utilized a jet stream electrospray ionization source operated in positive mode (ESI+). Ion source parameters have previously been reported by Ambrosio et al. [29]. For DSG analysis capillary voltage and nozzle voltage were adapted to 3000 V and 2000 V, respectively. The QQQ was operated in multiple reaction monitoring (MRM) mode with the transitions reported in Table 3, whereas the QToF ran in MS1 scan mode. For quantitation of DSG, [M+H]^+^ was used with the extraction window set to ±10 ppm.Table 3.MRM transitions.SubstanceFragmentPrecursor Ion (m/z)Product Ion (m/z)Collision EnergyCell Accelerator VoltageEcdysteroneQuantifier481445125Qualifier 1371124Qualifier 2165285Ponasterone(internal standard)Quantifier46580.9443Qualifier 1173246Qualifier 2109326
The supplement batch used in this trial (L:903176) was tested as well as the previous batch (L: 402305) already analyzed by Ambrosio et al. [29]. Six capsules of each batch were opened, their content weighted and mixed. Three times 100 mg of capsule content were dissolved in 10.0 mL DMSO:EtOH:H_2_O (50:30:20, v:v:v) each and subsequent extraction was carried out analogously to Ambrosio et al. [29].
To account for the unknown matrix effect, quantitation was performed by standard addition. The extracts were diluted with LC-MS grade methanol. Aliquots of 10 µL 20E standard solution (0; 10; 20; 30; 40; 50; 60 ng/mL) and 10 µL ponasterone standard solution (100 ng/mL) as internal standard were added to 80 µL of diluted extract (1:10 dilution). For DSG 10 µL of standard solution (0; 500; 1000; 1500; 2000; 2500 ng/mL) were added to 90 µL of diluted extract (1:10000 dilution). All calibration points were prepared in triplicate.
Myotube measurement of C2C12 cell
2.9.1.
Following the training intervention, the commercially available supplement used in this study (Ecdy & Dio Mix 2024) was analyzed for its biological activity and potential anabolic effects in a well-established C2C12 cell line-based assay, that has been used in numerous other studies [7,21,66–68]. C2C12 cells, a myoblast cell line derived from murine satellite cells, were used as an in vitro model to study muscle fiber hypertrophy induced by this supplement. The effects of this supplement on myotube diameter were compared with the control, dihydrotestosterone (DHT), as well as the same batch of the supplement (Ecdy & Dio Mix. 2018) previously analyzed by Ambrosio et al. [29].
Statistical analysis
2.9.2.
All analyses were performed using R statistical software version 4.4.1 and R Studio [69]. Results are presented as mean ± standard deviation (SD) unless otherwise stated. Baseline characteristics of the participants and nutritional data from the food diary were tested for normal distribution using the Shapiro-Wilk test. If normal distribution was confirmed, a Welch two-sample t-test was used for further analyses. In cases where the data did not confirm normal distribution (body weight at baseline testing T0), the Wilcoxon test was used. The blood sample, body composition, muscle thickness, and 1-RM data were tested and checked for normal distribution using both residuals vs. fitted plots and Q-Q plots. All dependent variables from the blood samples, body composition, muscle thickness and 1-RM tests were analyzed using linear mixed model (LMM) with the lme4 and the lmerTest packages [70,71]. For all LMM, the fixed effects of group (EcDi, Plac), time (T0, T1, T2, T3), and their respective interaction terms are incorporated into each model. In the LMM models for blood samples and muscle thickness assessments, only T0 and T3 were used for the fixed effects of time. The emmeans package [72] was used to fit the models. Post hoc tests were then calculated for the appropriate model with false discovery rate (FDR) adjustment, and a pairwise comparison of the changes (Δ) in both groups was performed for each variable. The significance threshold for all analyses was set at a p-value < 0.05. Effect sizes were estimated using Cohen’s d and classifications were categorized as follows: trivial < 0.2; small < 0.5; moderate < 0.8; strong > 0.8 [73]. Figures were generated using R statistical software with the ggplot2 package [74].
Results
After dropouts, 24 participants (EcDi, n = 12; Plac, n = 12) completed the study and were included in the analyses. Reasons for dropout are shown in the participants flowchart (Figure 1). The baseline characteristics of the subjects can be seen in Table 4. There were no significant differences between the groups at baseline.Table 4.Baseline characteristics. EcDi (n = 12)Plac (n = 12)p-valuesAge (y)31.7 ± 7.230.5 ± 9.3.733Height (cm)183.0 ± 7.0180.7 ± 9.5.501Bodyweight (kg)90.4 ± 13.188.5 ± 15.1.686Training Age (y)8.5 ± 5.110.4 ± 5.6.380Relative strength (SQ)1.43 ± 0.231.50 ± 0.30.538Relative strength (BP)1.21 ± 0.221.21 ± 0.23.972Data are shown as mean ± standard deviation; SQ, Squat; BP, Bench press; y, years; p-values from Welch two Sample t-test and in case of BW Wilcoxon test.
1-RM tests
3.1.
Results of the 1-RM tests over the 12 weeks are reported in Table 5.Table 5.1-RM SQ and BP T0-T3.MetricGroupT0T1T2T3p-values timep-values group1-RM SQ (kg)EcDI128.3 ± 22.4132.9 ± 23.5136.3 ± 22.6141.0 ± 20.9 < 0.05n.s.Plac130.8 ± 24.3136.0 ± 22.6138.9 ± 19.8143.8 ± 18.81-RM BP (kg)EcDI107.7 ± 18.5107.3 ± 18.8108.8 ± 19.1110.8 ± 18.1 < 0.05n.s.Plac105.0 ± 15.2105.8 ± 15.7105.9 ± 16.1107.3 ± 16.4RS SQEcDI1.43 ± 0.231.49 ± 0.241.52 ± 0.221.58 ± 0.23 < 0.05n.s.Plac1.50 ± 0.301.56 ± 0.281.59 ± 0.231.63 ± 0.28RS BPEcDI1.21 ± 0.221.21 ± 0.221.22 ± 0.221.24 ± 0.22 < 0.05n.s.Plac1.21 ± 0.231.22 ± 0.241.24 ± 0.241.25 ± 0.25Data are shown as mean ± standard deviation; SQ, Squat; BP, Bench press; n.s., not significant; *Significance level at p ≤ 0.05.
Figure 3 illustrates the development of the 1-RM SQ and BP strength, along with the relative strength progression for both exercises. Figure 3.1-RM SQ and BP T0-T3. *significance level at p ≤ 0.05; time effects were marked with *.
At baseline (T0), no significant differences were found between the groups for 1-RM SQ and BP (all p > 0.05). The LMM analysis revealed a significant time effect for both 1-RM SQ and BP. For SQ, a significant time effect (all p < 0.05) was observed at T1, T2, and T3. However, for BP, a significant effect of time was only found at T3. In addition, no significant group effect or time × interactions were detected.
The estimation of Cohen’s d indicated a moderate effect size (d = 0.60) for the significant increase in 1-RM SQ and a trivial effect size (d = 0.16) for 1-RM BP from T0 to T3.
The LMM showed no significant difference between both groups for relative strength in SQ and BP (all p > 0.05). Similar to the significant time effect observed for 1-RM SQ and BP, a significant time effect was found for relative strength in SQ at T1, T2, and T3, and for BP only at T3. No significant group effects or time × interactions were detected. Analysis of effect sizes revealed a moderate effect for relative strength in SQ (d = 0.55) and a small effect for relative strength in BP (d = 0.16) in the increase from T0 to T3.
Body composition
3.1.1.
The LMM showed no significant differences between groups at T0 for BW (p = 0.74), FFM (p = 0.32), FM (p = 0.50), MM (p = 0.58), TBW (p = 0.31), and BF% (p = 0.22). The development of the body composition variables from T0 to T3 is shown in Table 6.Table 6.Body composition variables T0-T3.MetricGroupT0T1T2T3p-valuestimep-value groupBody-weight(kg)EcDi90.4 ± 13.189.9 ± 12.690.2 ± 12.890.1 ± 12.7.142n.s.Plac88.5 ± 15.188.3 ± 14.388.5 ± 14.689.7 ± 15.5Fat free mass (kg)EcDi71.4 ± 8.372.1 ± 8.472.5 ± 8.072.0 ± 7.9.003n.s.Plac67.7 ± 9.469.3 ± 9.268.8 ± 9.969.5 ± 10.4Fat mass(kg)EcDi18.9 ± 6.317.9 ± 5.917.7 ± 6.418.1 ± 6.3.048n.s.Plac20.9 ± 7.719.1 ± 6.919.8 ± 6.920.2 ± 7.3Muscle mass (kg)EcDi49.3 ± 5.949.9 ± 5.750.4 ± 5.050.2 ± 5.5.002n.s.Plac47.9 ± 6.948.7 ± 6.749.1 ± 7.349.0 ± 7.6Total body water (L)EcDi52.3 ± 6.152.8 ± 6.253.0 ± 5.952.3 ± 5.3.025n.s.Plac49.5 ± 6.950.7 ± 6.750.3 ± 7.350.9 ± 7.6Body fat p. (%)EcDi20.6 ± 4.419.5 ± 4.319.2 ± 4.919.7 ± 4.5.029*n.s.Plac23.1 ± 5.521.2 ± 4.721.9 ± 5.122.2 ± 5.1Data are shown as mean ± standard deviation; n.s., not significant; *Significance level at p ≤ 0.05.
[Figures 4 and 5](#f0004 f0005) illustrate the changes in the body composition variables from T0 to T3. Figure 4.Bodyweight, fat free mass, muscle mass, fat mass, total body water and body fat percentage T0-T3. *significance level at p ≤ 0.05; time effects were marked with *.Figure 4 and 5 are only one Figure (4) Figure 5.Total body water and body fat percentage T0-T3. *significance level at p ≤ 0.05; time effects were marked with *.Figure 4 and 5 should be summarized to figure 4
For BW, the LMM showed no significant main effect of time (p > 0.05). FFM showed significant increases over time, with values at T1, T2, and T3 higher than at baseline (T0) (all p < 0.05). However, no significant differences were found between T1, T2, and T3 (all p > 0.05), indicating that FFM levels plateaued after the initial increase. FM decreased significantly over time, with reductions observed at T1 and T2 (both p < 0.05) and a trend toward significance at T3 (p = 0.09). No significant differences were found between T1, T2, and T3 (all p > 0.05), suggesting that the decrease occurred primarily between T0 and T1. BF% also decreased significantly over time, with reductions at T1 and T2 (both p < 0.05) and a trend at T3 (p = 0.09). No significant differences were found between T1, T2, and T3 (all p > 0.05), suggesting that the decrease in BF% occurred mainly in the early stages, similar to FM. MM increased significantly over the study period at all time points (all p < 0.05). TBW also increased significantly at all time points (all p < 0.05). While the LMM showed significant effects for FFM, FM, BF%, MM and TBW over time, no group effects or time × group interactions were observed for any of the variables (all p > 0.05).
Calculations of Cohen’s d for FFM (d = 0.13), FM (d = 0.10), MM (d = 0.15), BF% (d = 0.18), and TBW (d = 0.10) indicated trivial effect sizes for the main effect of time.
Muscle thickness
3.1.2.
Table 7 presents the development of muscle thickness for RF, VL, and PM from T0 to T3, with changes illustrated in Figures 6 and 7. Figure 6.Anterior quadriceps femoris muscle thicknessT0-T3. *significance level at p ≤ 0.05; time effects were marked with . Figure 7.Muscle thickness of lateral quadriceps femoris and M. pectoralis major T0-T3. significance level at p ≤ 0.05; time effects were marked with .Table 7.Muscle thickness T0-T3.ParameterGroupT0T3P-values timep-values groupAnterior quadriceps femoris 30% (cm)EcDi6.3 ± 0.86.6 ± 0.8.011n.s.Plac6.7 ± 0.86.8 ± 0.8Anterior quadriceps femoris 50% (cm)EcDi5.9 ± 0.95.9 ± 0.7.783n.s.Plac6.0 ± 0.96.0 ± 0.8Anterior quadriceps femoris 70% (cm)EcDi4.7 ± 0.74.7 ± 0.7.501n.s.Plac4.8 ± 0.94.7 ± 0.8Lateral quadricepsfemoris 30% (cm)EcDi3.7 ± 0.93.7 ± 0.7.086n.s.Plac4.1 ± 1.14.3 ± 1.1Lateral quadricepsfemoris 50% (cm)EcDi3.7 ± 0.73.8 ± 0.5.020n.s.Plac4.1 ± 1.04.3 ± 0.8Lateral quadricepsfemoris 70% (cm)EcDi3.4 ± 0.53.5 ± 0.4.118n.s.Plac3.8 ± 0.83.9 ± 0.6M. pectoralismajor (cm)EcDi3.3 ± 0.63.3 ± 0.7.008n.s.Plac2.6 ± 0.52.8 ± 0.6Data are shown as mean ± standard deviation; n.s., not significant; *Significance level at p ≤ 0.05.
Anterior quadriceps femoris muscle thickness
3.1.2.1.
At baseline (T0), no significant differences (p > 0.05) were observed between both groups for anterior quadriceps femoris muscle thickness at the 30%, 50% or 70% landmarks. The LMM model showed a significant increase (p < 0.05) in anterior quadriceps femoris muscle thickness at 30% over time. However, no group effect or time × group interaction was observed (all p > 0.05). The calculation of Cohen’s d for anterior quadriceps femoris thickness at 30% was 0.17, indicating a trivial effect size.
Lateral quadriceps femoris muscle thickness
3.1.2.2.
Similarly, no significant differences (all p > 0.05) were found between the EcDi and Plac groups at baseline (T0) for the lateral quadriceps femoris muscle thickness at the 30%, 50%, or 70% landmarks. A significant time effect was observed for lateral quadriceps femoris at 50% landmark (p < 0.05), whereas no significant changes were found at the 30% or 70% landmarks. Additionally, no significant group effect or time × group interaction (all p > 0.05) was detected. The calculation of Cohen’s d for lateral quadriceps femoris thickness at 50% was 0.17, indicating a trivial effect size.
M. pectoralis major muscle thickness
3.1.2.3.
In contrast, at baseline (T0), a significant group difference (p < 0.05) was observed between the EcDi and Plac groups for M. pectoralis major. The LMM analysis revealed a significant time effect (p < 0.05) for PM muscle thickness; however, no significant group effect or time × group interaction was found. Cohen’s d for the change in PM thickness between T0 and T3 was 0.38, indicating a small effect size.
Liver and kidney biomarkers
3.1.3.
After analysis of liver and kidney biomarkers, creatinine, GOT, and GGT showed no significant main effects of group or time, nor any significant group × time interaction effects (p > 0.05). For GPT, the LME model revealed a significant main effect of group, with the EcDi group having lower GPT levels compared to the Plac group at T0 (p < 0.05). There was also a trend toward a significant effect of time (p = 0.09), suggesting a decrease in GPT levels over time in the Plac group. Furthermore, an initial significant group × time interaction was observed (p < 0.05), but this effect was no longer significant after FDR adjustment.
Hormone concentrations
3.1.4.
Throughout the 12-week intervention period the hormone concentrations of E2, T, fT, CORT, and IGF1 showed no significant main effects for group or time, nor any significant group × time interaction effects (p > 0.05). The raw data for liver and kidney function and the various hormone parameters are shown in the Supplementary Appendix.
Nutritional behaviour
3.1.5.
After the 12-week intervention period, analysis of the food diaries using the Welch two-sample t-test showed no significant differences in any of the provided macronutrients or daily energy intake. Table 8 shows the mean values for macronutrients and kilocalories, as well as the relative protein intake per kilogram of BW over the 12-week study period.Table 8.Nutrition of the participants.MacronutrientEcDiPlacP-valuesEnergy intake (kcal/day)2697 ± 2992522 ± 511.404Fat (g/day)89 ± 2182 ± 26.580Carbohydrates (g/day)283 ± 43267 ± 73.584Protein (g/day)174 ± 24162 ± 26.317Protein (g/kg BW)1.9 ± 0.41.8 ± 0.3.306Data are shown as mean ± standard deviation; BW p-values from the Welch Two Sample t-test.
Diameter of C2C12 cells
3.1.6.
According to the analysis of C2C12 cells, the commercially available supplement (Ecdy & Dio Mix 2024) revealed no significant hypertrophic effects on myotube diameter. Table 9 shows the myotube diameter after treatment with the different batches of the supplement. As shown in Figure 8, both DHT and the earlier batch of the supplement (Ecdy & Dio Mix 2018) showed a significant increase in diameter length compared to the control. Figure 8.Results for the C2C12 cell line; significance level at p < 0.05; treatment effects were marked with.Table 9.Myotube diameter after treatment with the supplements.Substances in µM% of ControlP valueControl25,7 ± 6,4100 Dihydrotestosterone (DHT)31,3 ± 7,6122 < .05Ecdy & Dio Mix [2018]28,1 ± 7,7110 < .05Ecdy & Dio Mix [2024]26,4 ± 6,5103n.s.Data are shown as mean ± standard deviation. n.s. not significant.
Supplement analysis
3.2.
For the new batch, less than 10 µg 20E and 15.6 mg DSG per capsule were detected, equivalent to less than 0.1% and 31.2% of the packaging’s claim. In contrast, analysis of the old batch confirmed the previous findings of Ambrosio et al. [26] for 20E and revealed a content of 40.4 mg DSG per capsule, accounting for 80.8% of packaging’s claim.
Discussion
This study aimed to investigate the potential anabolic and performance-enhancing effects of a commercially available phytosteroid product labeled to contain 20E and DSG. The training protocol was shown to increase upper and lower body strength as well as FFM and MM. Analyses of the commercially available product revealed that the actual 20E content was less than 0.1% while the DSG content was only 10.4% of the amount claimed by the manufacturer. Consequently, no hypertrophic effects were observed in the C2C12 model, and no difference was detected between the two human intervention groups. However, the in vitro model showed that anabolic effects were achieved when 20E and DSG were included in the product, as demonstrated by the commercial product of 2018.
In terms of performance, the training protocol was shown to induce a significant increase in 1-RM SQ and BP performance. The increases in both exercises were consistent with a previous study using a similar training protocol [7]. A significant moderate effect was observed for 1-RM SQ and a significant trivial effect for 1-RM BP in both groups. Considering the performance level of the participants in this study, it can be classified as slightly higher than that of a previous study [7]. Therefore, the potential for adaptation in terms of performance, as well as an increase in FFM, MM and muscle thickness, was lower in the population examined in this study. Nevertheless, the results are similar to those of the previous investigation [7].
Consistent with these findings, the present study also observed significant changes in FFM, MM, and TBW, along with decreases in FM and BF%. Effect sizes for body composition were trivial, which is reasonable given the participants’ advanced training levels. Results align with the meta-analysis by Benito et al. [75], who reported mean increases of 1.6 kg in FFM and 1.1 kg in MM in response to RT programs, further supporting the findings of the present study. Furthermore, analysis of the muscle thickness data showed a significant main effect of time on the anterior quadriceps muscle thickness at 30% and lateral quadriceps muscle thickness at 50%, both of which had a trivial effect size (d = 0.17). When compared with similar muscle thickness measurements by Gavanda et al. [54] over a 12-week period, the absolute increases in M. rectus femoris (Block: 0.11 cm; DUP: 0.20 cm) and M. vastus lateralis (Block: 0.13 cm; DUP: 0.10 cm) thickness are similar. Taken together, these findings provide plausibility for the significant increases in FFM and MM and support the efficacy of the RT program, suggesting that it can be reliably used in future studies.
However post-study analysis of the supplement revealed a 20E content of less than 0.1% of the amount claimed by the manufacturer on the label (25 mg 20E). The content differs significantly from that of the old batch of the same product, but illustrates the wide variance in the actual 20E concentration in commercially available ecdysterone products as also reported by Ambrosio et al. [29]. These findings raise important considerations, as dietary supplements are widely used by both the general population and athletes. The Federal Office for Consumer Protection and Food Safety in Germany states that dietary supplements do not require proof of efficacy and that the manufacturer is responsible for safety [30]. In addition, the amount of ingredients listed on the label can vary by as much as 50% from the actual amount of ingredients [30]. Due to the lack of regulation, many dietary supplements on the market are not analyzed for the content of certain ingredients. Several studies of the accuracy of dietary supplement labeling have found that many of the products analyzed contained significantly lower amounts of the specific ingredient or additional, possibly risky, ingredients that were not declared on the supplement label [29,32,33,76–81]. Similar to Germany, dietary supplements in the U.S. do not require proof of efficacy and are assumed to be safe, unless proven otherwise [82]. According to Navarro et al. [83], herbal and dietary supplements (HDS) accounted for 20% of liver injuries in 2013–2014 due to contamination with anabolic steroids or toxic potential of other ingredients. Contamination of dietary supplements is not only a health problem for the general population. Kozhuharov et al. [84] conducted a systematic review and showed that more than 28% of the analyzed dietary supplements posed a potential risk of unintentional doping. This is supported by previous investigations [33]. For professional athletes in particular, this may be career-terminating due to a suspension by the WADA and public standing. Irrespective of the potential risks of side effects due to inaccurate amounts of ingredients and potential impurities, the sometimes contradictory observations of the potency of 20E in humans may be explained.
Initial studies by Wilborn et al. failed to demonstrate any additive effects of chronic application of 100 mg Polypodium Vulare/Suma root on performance and body composition after 8 weeks of strength training [25]. According to the information provided at the time, the capsules should contain 30 mg 20E. However, no information was provided on the analyses of the supplements used and the actual concentration [25]. Studies on foods such as spinach or quinoa, which generally contain 20E, show that the concentration is highly dependent on various factors such as origin, genetics and environmental conditions [38,85–90]. Similar to this study, the extract used in the investigations by Wilborn et al. at that time may not have contained any significant biologically active concentrations of 20E [25]. In contrast, in vitro studies and animal models with the pure substance 20E show clear anabolic effects [16–21]. In addition, anabolic effects, improvements in muscle quality and performance-enhancing effects have been observed in human studies [7,24]. Even though the actual concentration of the product used in the study by Isenmann et al. also deviated significantly from the specified concentration, anabolic effects were demonstrated in the cell culture [7]. Furthermore, the actual concentrations used per week (low dose: 72 mg/week, high dose: 336 mg/week) by Isenmann et al. were within the range of classic anabolic substances [91]. Besides, comprehensive screening for prohibited substances was conducted on both the administered product and the participants, in compliance with current WADA guidelines. In contrast, the weekly dosage in the study by Pérez-Piñero et al was considerably lower (22.4 mg/week) than that reported by Isenmann et al. While some anabolic steroids exert anabolic effects at doses as low as approximately 10 mg per week, Pérez-Piñero et al. suggest that the high nitrate concentration (14.18 mg/day, 99,26 mg/week) may be primarily responsible for the observed biological activity [24]. Consequently, the anabolic effects cannot be clearly attributed to the 20E concentration. Although spinach (~900 g) and quinoa (150 g) contained approximately 18–19 mg and 55.3 mg of 20E, respectively, only a small proportion (1–3%) was absorbed, rendering significant biological activity unlikely [39,41]. While anabolic effects have been unequivocally demonstrated in vitro and in animal models [14,16,18–21], and partially observed in humans [7], current data remain insufficient to define precise dose – response relationships.
Unlike the analysis of 20E, no method has yet been established for determining DSG in supplements. The present study determined the DSG concentration in supplements for the first time. Similar to 20E, the concentration of DSG varied considerably among the tested products. In the product used for this investigation, only approximately 30% of the declared content was present in the capsules. Based on the very low concentrations of both phytosteroids, no anabolic effects were observed in either the cell culture or the human experiment. In previous cell culture experiments by Kostov et al., a dose-response relationship was identified for both phytosteroids [21]. Moreover, similar effects were also observed in humans. Studies in both men and women have observed higher effects on MM with higher doses of DSG-rich fenugreek [47,92]. Comparing the DSG data of the product used here, however, they are lower than those reported in previous studies [47,92].
Interestingly, the results of 20E, DSG Mix from 2018 in the cell culture experiments were similar to the effects by Kostov et al. for the ratio of 1:2 (20E:DSG) [21]. It appears that a combination of 1:2 20E to DSG has no additive effect. Based on the findings of Kostov et al., two different mechanisms of action are activated, but additive effects are primarily observed at ratios of 2:1; 10:1 or 1:10 20E to DSG [21]. As a result, exact combination ratios have not yet been sufficiently investigated.
In summary, it is currently not possible to comment on the possible additive effects of 20E and DSG in humans due to the almost complete absence of 20E and DSG in the study supplement. Therefore, for future studies with phytosteroids in general, the following points need to be considered to identify potential effects in general:
- Verification of the product content and absence of potential contamination with prohibited substances,
- Verification of biological activity in vitro models,
- Human intervention study with blood and urine analyses regarding bioavailability of the substances.
If these recommendations are followed in the studies, outcomes similar to those observed in this study are less likely to recur.
Limitations
The primary limitation of this study is that the supplement used was not analyzed prior to the start of the investigation to ensure that it contained a sufficiently high amount of 20E and DSG, which could potentially have performance-enhancing and anabolic properties. Although a previously tested product was used, relying on older analyses is insufficient; each batch must be independently tested to ensure consistency in substance concentration. As long as regulatory guidelines remain vague, these issues are likely to persist. Besides, this study included only a small sample size of male participants, so no conclusions can be drawn regarding female responses. Although body composition assessment using BIA is considered valid, the current gold standard remains dual-energy X-ray absorptiometry (DXA). However, this is scarcely feasible in Germany with healthy people.
Conclusion
Based on the significant time effects observed in 1-RM performance, body composition variables, and muscle thickness data, the RT program used in this study appears to be effective and can serve as a foundation for future research. However, given the minimum 20E and DSG content found in the supplement, there is a clear need for stringent guidelines for future phytosteroid studies. Sufficient testing of study materials prior to initiating human studies would reduce the likelihood of outcomes similar to those observed in this study. Furthermore, policymakers should establish more specific regulations to ensure that consumers are not misled by manufacturers’ claims and to prevent adverse health effects from incorrect labeling of ingredient concentrations.
The reference list from the paper itself. Each links out to its DOI / PubMed record.
- 1Knapik JJ, Steelman RA, Hoedebecke SS, et al. Prevalence of dietary supplement use by athletes: systematic review and meta-analysis. Sports Med. 2016;46(1):103–23. doi: 10.1007/s 40279-015-0387-726442916 PMC 4697915 · doi ↗ · pubmed ↗
- 2Isenmann E, Tolle P, Geisler S, et al. Differences in consumption behaviour of dietary supplements in competitive athletes depends on Sports discipline. Nutrients. 2024;16(3):374. doi: 10.3390/nu 1603037438337659 PMC 10857381 · doi ↗ · pubmed ↗
- 3Sánchez-Oliver AJ, Domínguez R, López-Tapia P, et al. A survey on dietary supplement consumption in amateur and professional rugby players. Foods. 2020;10(1):7. doi: 10.3390/foods 1001000733375061 PMC 7822035 · doi ↗ · pubmed ↗
- 4Moreno B, Veiga S, Sánchez-Oliver AJ, et al. Analysis of Sport supplement consumption by competitive swimmers according to sex and competitive level. Nutrients. 2022;14(15):3218. doi: 10.3390/nu 1415321835956394 PMC 9370690 · doi ↗ · pubmed ↗
- 5Halabchi F, Shab-Bidar S, Selk-Ghaffari M. Prevalence of supplement consumption in Iranian athletes: a systematic review and meta-analysis. Int J Prev Med. 2021;12(1):32. doi: 10.4103/ijpvm.IJPVM_189_2034249281 PMC 8218796 · doi ↗ · pubmed ↗
- 6Garthe I, Maughan RJ. Athletes and supplements: prevalence and perspectives. Int J Sport Nutr Exerc Metab. 2018;28(2):126–138. doi: 10.1123/ijsnem.2017-042929580114 · doi ↗ · pubmed ↗
- 7Isenmann E, Ambrosio G, Joseph JF, et al. Ecdysteroids as non-conventional anabolic agent: performance enhancement by ecdysterone supplementation in humans. Arch Toxicol. 2019;93(7):1807–1816. doi: 10.1007/s 00204-019-02490-x 31123801 · doi ↗ · pubmed ↗
- 8Isenmann E, Alisauskas P, Flenker U, et al. The anabolic effect of fenugreek: a systematic review with meta-analysis. Int J Sports Med. 2023;44(10):692–703. doi: 10.1055/a-2048-592537253363 · doi ↗ · pubmed ↗