Trends in Labor After Cesarean Delivery Access in the US
Brittany L. Ranchoff, Kimberley H. Geissler, Sarah L. Goff, Elizabeth R. Bertone-Johnson, Mary T. Paterno, Laura B. Attanasio

TL;DR
This study explores how access to labor after cesarean delivery has changed in US counties from 2016 to 2021.
Contribution
The study provides new county-level insights into trends of labor after cesarean delivery access in the US.
Findings
County-level data reveals variations in access to labor after cesarean delivery.
Trends from 2016 to 2021 show changes in availability of this option across the US.
Abstract
This cross-sectional study examines county-level trends in labor after cesarean delivery access across the US from 2016 to 2021.
Genes, proteins, chemicals, diseases, species, mutations and cell lines named across the full text — each resolved to its canonical identifier and authoritative record.
Click any figure to enlarge with its caption.
 Figure
| County characteristics | County-years, No. (%) | County-level LAC access, aOR (95% CI) | ||||
|---|---|---|---|---|---|---|
| Overall | County-level LAC access | |||||
| No | Yes | |||||
| County-level LAC access | 18 648 (100.00) | 15 691 (84.1) | 2957 (15.9) | |||
| Year | ||||||
| 2016 | 3108 (16.7) | 2602 (83.7) | 506 (16.3) | .98 | 1 [Reference] | NA |
| 2017 | 3108 (16.7) | 2619 (84.3) | 489 (15.7) | 0.92 (0.83-1.01) | .08 | |
| 2018 | 3108 (16.7) | 2609 (83.9) | 499 (16.1) | 0.94 (0.84-1.05) | .27 | |
| 2019 | 3108 (16.7) | 2625 (84.5) | 483 (15.5) | 0.89 (0.79-1.01) | .06 | |
| 2020 | 3108 (16.7) | 2617 (84.2) | 491 (15.8) | 0.89 (0.78-1.02) | .09 | |
| 2021 | 3108 (16.7) | 2619 (84.3) | 489 (15.7) | 0.89 (0.77-1.01) | .08 | |
| Rurality | ||||||
| Metropolitan county | 6960 (37.3) | 4837 (69.5) | 2123 (30.5) | <.001 | 1 [Reference] | NA |
| Nonmetropolitan county adjacent to a metro area | 6156 (33.0) | 5698 (92.6) | 458 (7.4) | 0.27 (0.21-0.35) | <.001 | |
| Nonmetropolitan county nonadjacent to a metro area | 5532 (29.7) | 5156 (93.2) | 376 (6.8) | 0.22 (0.16-0.31) | <.001 | |
| County with lowest-quartile median income | ||||||
| No | 8298 (44.5) | 6235 (75.1) | 2063 (24.9) | <.001 | 1 [Reference] | NA |
| Yes | 10 350 (55.5) | 9456 (91.4) | 894 (8.6) | 0.96 (0.81-1.13) | .62 | |
| % Of adult population who are insured by Medicaid, mean (SD) | 14.69 (7.5) | 14.92 (7.7) | 13.5 (6.4) | <.001 | 0.94 (0.93-0.96) | <.001 |
| % Of population who are Black or African American, mean (SD) | 10.02 (14.7) | 9.80 (15.0) | 11.2 (13.0) | <.001 | 1.04 (1.03-1.05) | <.001 |
| % Of population who are Hispanic or Latino, mean (SD) | 9.39 (13.9) | 8.91 (13.9) | 12.0 (13.3) | <.001 | 1.03 (1.02-1.04) | <.001 |
| Uninsured rate, mean (SD) | 10.32 (5.1) | 10.60 (5.2) | 8.8 (4.3) | <.001 | 0.97 (0.94-0.99) | .01 |
| No. of obstetrician-gynecologists per 100 000 adult reproductive-aged female people, mean (SD) | 25.61 (34.8) | 22.1 (32.4) | 62.8 (42.8) | <.001 | 1.02 (1.01-1.02) | <.001 |
| No. of midwives per 100 000 adult reproductive-aged female people, mean (SD) | 7.13 (17.5) | 5.27 (16.1) | 17.0 (21.0) | <.001 | 1.02 (1.01-1.02) | <.001 |
| Region | ||||||
| Northeast | 1302 (7.0) | 776 (59.6) | 526 (40.4) | <.001 | NA | NA |
| Midwest | 6330 (33.9) | 5413 (85.5) | 917 (14.5) | NA | NA | |
| South | 8532 (45.8) | 7619 (89.3) | 913 (10.7) | NA | NA | |
| West | 2484 (13.3) | 1883 (75.8) | 601 (24.2) | NA | NA | |
| County with an obstetric hospital | ||||||
| No | 9077 (48.7) | 9077 (100.0) | NA | <.001 | NA | NA |
| Yes | 9571 (51.3) | 6614 (69.1) | 2957 (30.9) | NA | NA | |
Peer Reviews
No public reviews on file for this paper yet. If you reviewed it on a platform where reviews are public (OpenReview, ICLR, NeurIPS, ICML), you can paste yours below so the community can read it here.
Videos
No videos yet. Explain this paper in a talk, walkthrough, or lecture? Add one.
Taxonomy
TopicsMaternal and Perinatal Health Interventions · Maternal and fetal healthcare · Assisted Reproductive Technology and Twin Pregnancy
Introduction
Despite the potential benefits of vaginal birth after cesarean (VBAC) delivery, access to labor after cesarean (LAC) delivery is limited for many individuals with a prior cesarean birth, as many clinicians and hospitals do not offer LAC services.^1,2,3^ Although clinical practice guidelines have become somewhat more encouraging of VBAC, the extent to which LAC services are available nationally in recent years is unknown. We examined county-level trends in LAC access across the continental US from 2016 to 2021.
Methods
This cross-sectional study used data from the Natality Restricted-Use Data Files (2016 to 2021), which captures all US births. Our outcome was a binary measure of LAC access in each county-year, defined as at least 1 hospital offering LAC. We adapted prior methods for determining hospital-level LAC access to the county-level based on rates of LAC, LAC ending in VBAC, and prior cesarean birth, as well as an estimated expected LAC count.^3^ Counties with near zero LAC and/or lower than expected LAC counts were considered to not have LAC access. We descriptively examined LAC access by year and other factors, using χ^2^ tests and t tests. We then used a generalized estimating equation model to conduct multivariate analysis for county-level LAC access by year, controlling for other county characteristics. Finally, we repeated the analysis limited to counties with an obstetric hospital, because approximately 50% of counties do not have an obstetric hospital. This cross-sectional study was reviewed and approved by the University of Massachusetts institutional review board and Strengthening the Reporting of Observational Studies in Epidemiology (STROBE) reporting guideline.
Results
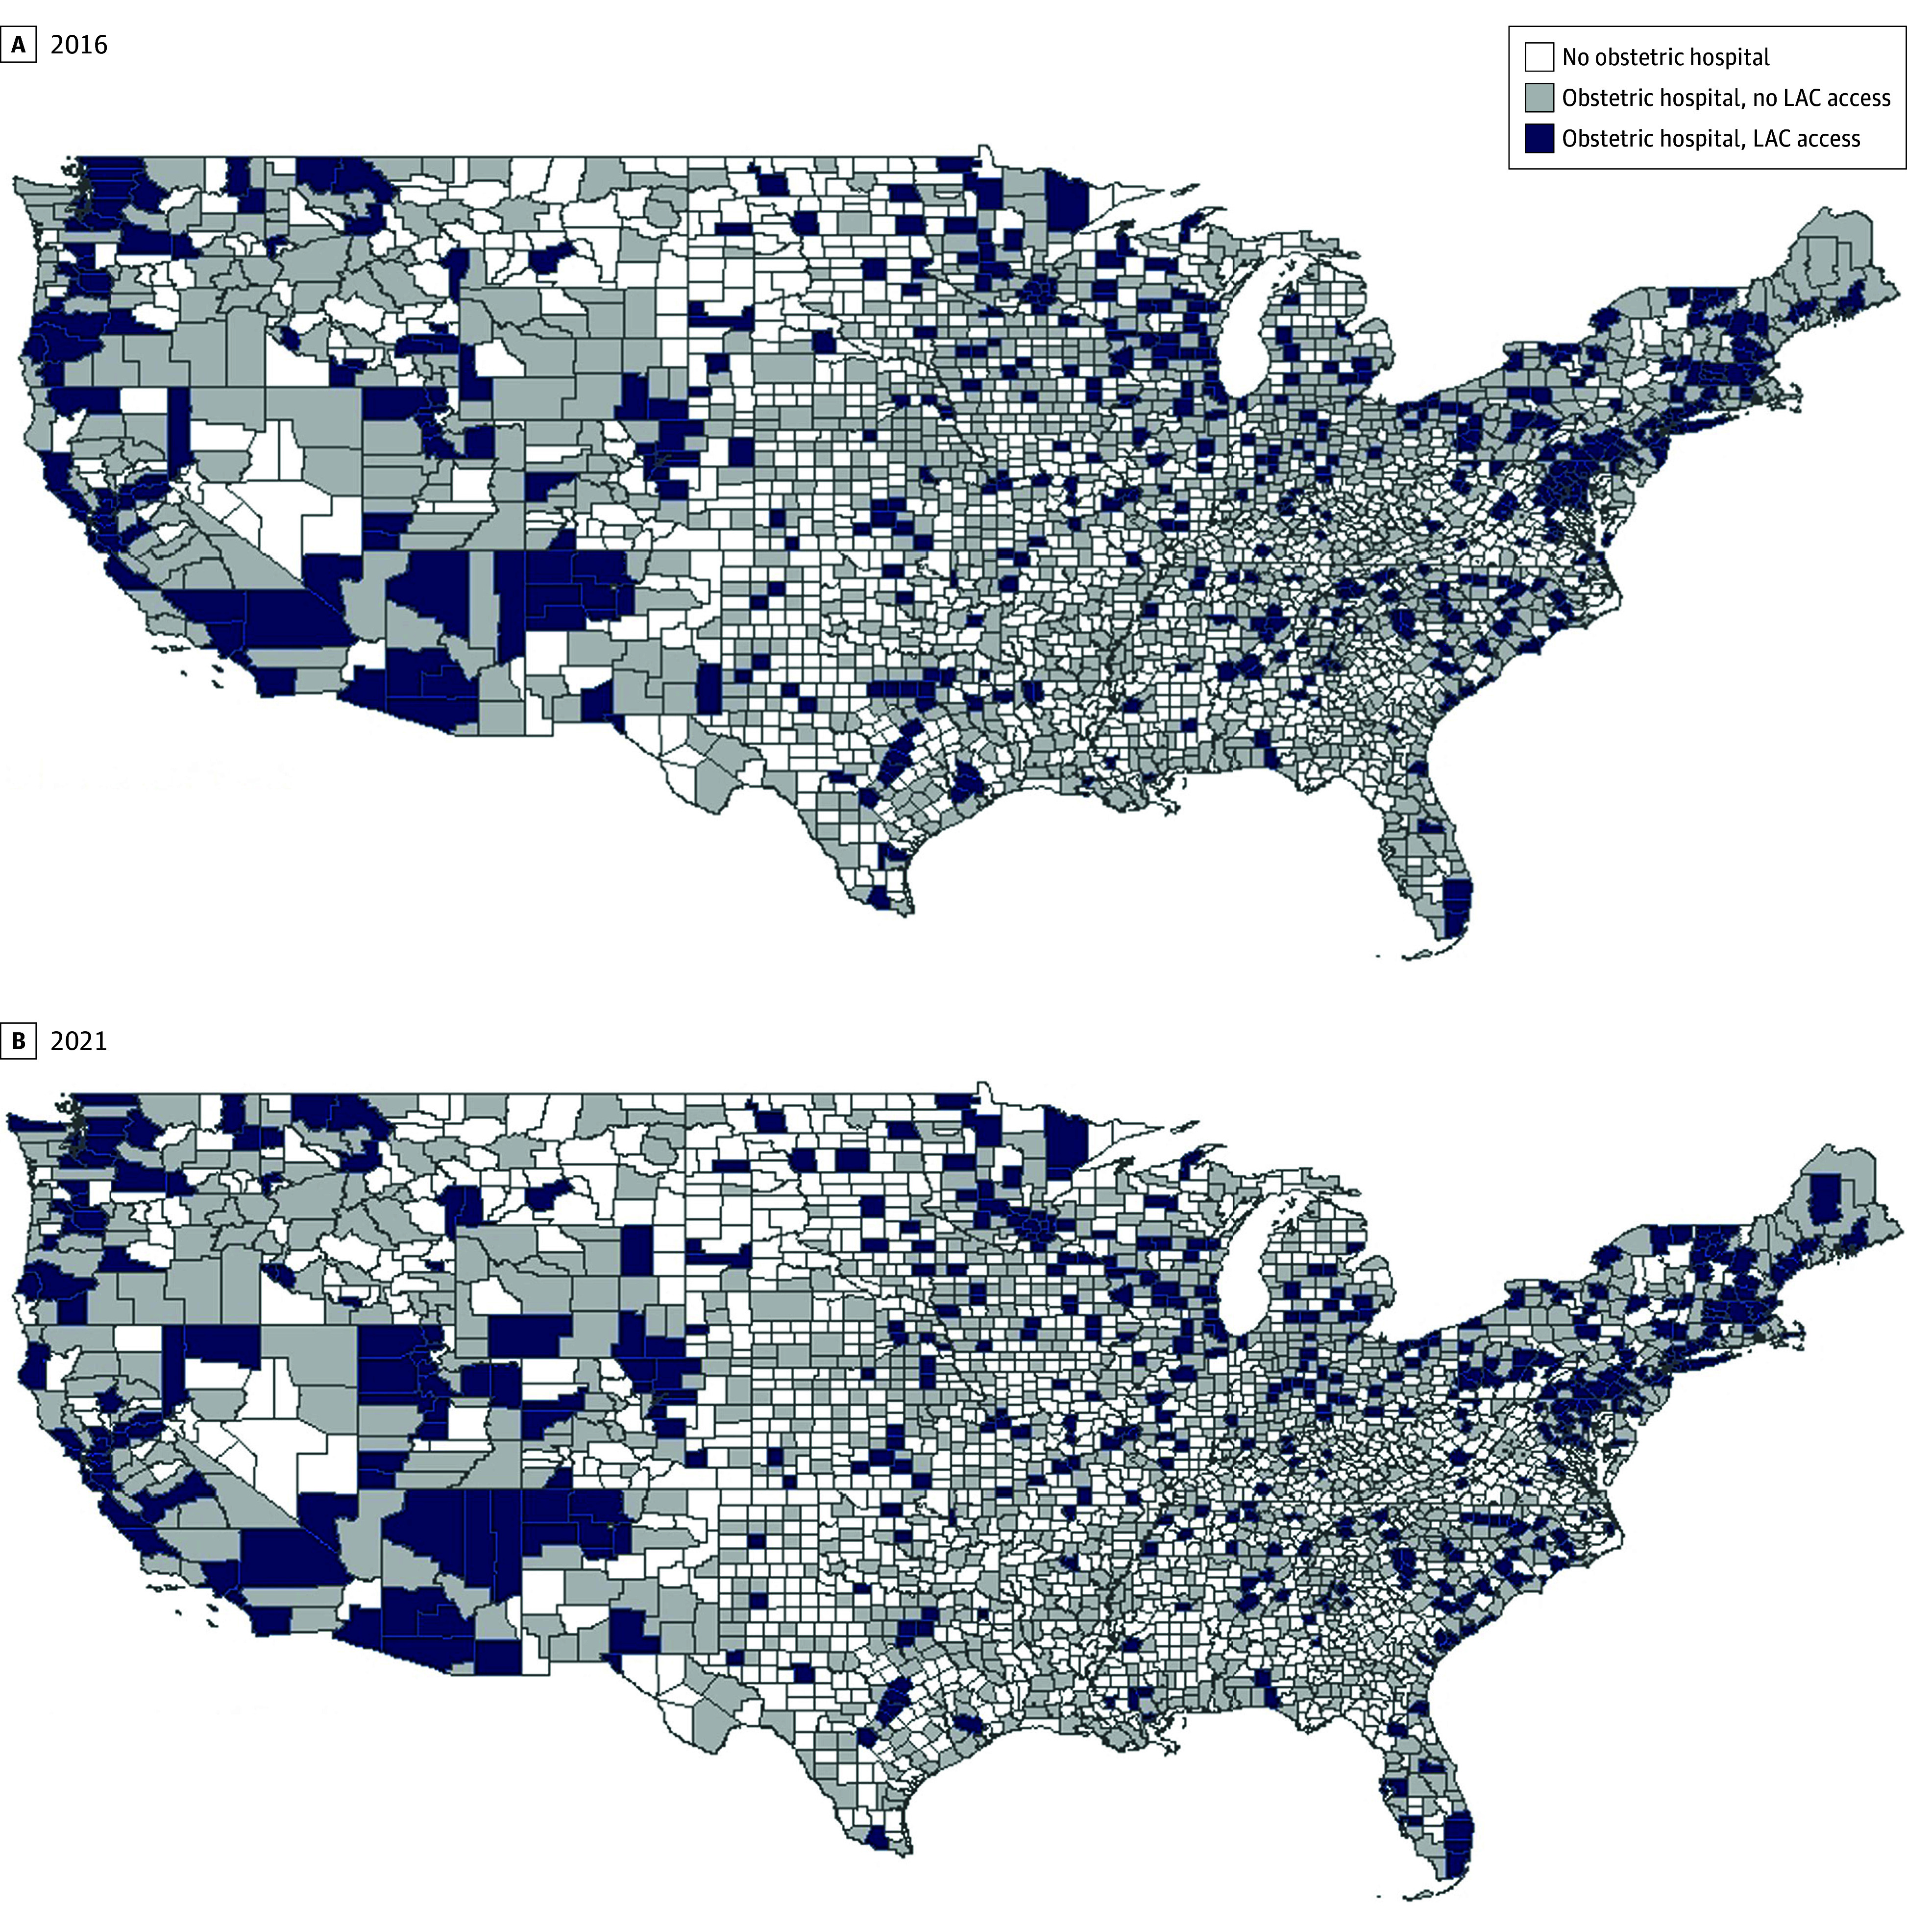
The final analytic sample included 18 648 county-years (3108 counties) from 2016 to 2021. The Figure A and B depict the geographic distribution of LAC access in 2016 (first year in study) and 2021 (last year in study). Counties with LAC access were more prevalent in the Northeast and Western regions.
County-Level Labor After Cesarean (LAC) Access
Throughout the study, 2957 county-years (15.9%) had LAC access (Table). Nearly a third of metro counties had LAC access (2123 county-years [30.5%]), compared with 458 county-years in metro-adjacent counties (7.4%) and 376 county-years in metro-nonadjacent counties (6.8%). Among counties with hospital-based obstetric services only, 2957 county-years (30.9%) had LAC access. LAC access did not vary across years in bivariate or multivariate analyses. In the subgroup analysis limiting to counties with an obstetric hospital, results were similar in magnitude, direction, and significance as the main analysis.
Discussion
We found fewer than 16% of counties offered LAC throughout the study, with extremely limited access to LAC in some regions. Prior studies have examined LAC access within specific states, but no recent studies have assessed county-level LAC access nationally.^1,2,3^ We found limited but stable LAC availability overall and when limiting to counties with obstetric hospitals, despite increases in VBAC rates between 2011 and 2021.^4^ Our findings confirm the difficulty individuals have expressed in accessing LAC.^5^ Although the American College of Obstetricians and Gynecologists states LAC is a reasonable option for many individuals with a prior cesarean delivery, many birthing people may not be able to access LAC due to a lack of local availability. Other barriers, such as insurance and transportation limitations, may limit LAC access even for individuals in counties where LAC is available.
Study limitations include the quality of birth certificate items which could lead to potential misclassification in defining LAC-offering counties.^6^ Despite small increases in the US VBAC rate in recent years,^4^ our results indicate LAC access continues to be limited, suggesting LAC and VBAC may have become more concentrated among a smaller set of hospitals or clinicians. Future research should investigate the consequences of limited LAC access on perinatal care experiences and outcomes for the substantial proportion of individuals with a prior cesarean delivery.
The reference list from the paper itself. Each links out to its DOI / PubMed record.
- 1Leeman LM, Beagle M, Espey E, Ogburn T, Skipper B. Diminishing availability of trial of labor after cesarean delivery in New Mexico hospitals. Obstet Gynecol. 2013;122(2 Pt 1):242-247. doi:10.1097/AOG.0b 013e 31829 bd 0a 023969790 · doi ↗ · pubmed ↗
- 2Barger MK, Dunn JT, Bearman S, De Lain M, Gates E. A survey of access to trial of labor in California hospitals in 2012. BMC Pregnancy Childbirth. 2013;13:83. doi:10.1186/1471-2393-13-8323551909 PMC 3636061 · doi ↗ · pubmed ↗
- 3Wendling A, Taglione V, Rezmer R, . Access to maternity and prenatal care services in rural Michigan. Birth. 2021;48(4):566-573. doi:10.1111/birt.1256334145616 · doi ↗ · pubmed ↗
- 4Chehab RF, Ferrara A, Grobman WA, . Racial, ethnic, and geographic differences in vaginal birth after cesarean delivery in the US, 2011-2021. JAMA Netw Open. 2024;7(5):e 2412100-e 2412100. doi:10.1001/jamanetworkopen.2024.1210038758560 PMC 11102014 · doi ↗ · pubmed ↗
- 5Basile Ibrahim B, Knobf MT, Shorten A, . “I had to fight for my VBAC”: a mixed methods exploration of women’s experiences of pregnancy and vaginal birth after cesarean in the United States. Birth. 2021;48(2):164-177. doi:10.1111/birt.1251333274500 PMC 8122048 · doi ↗ · pubmed ↗
- 6Gregory ECW, Martin JA, Argov EL, Osterman MJK. Assessing the quality of medical and health data from the 2003 birth certificate revision: results from New York City. Natl Vital Stat Rep. 2019;68(8):1-20.32501201 · pubmed ↗